

 PDF
PDF Citation
 Print
Print


INTRODUCTION
Seaweeds have been a major constituent of traditional diets as well as alternative medicine in Asian countries such as Korea. Seaweeds have numerous health beneficial effects, such as lipid-lowering [123], anti-inflammatory [45], and anti-diabetic [1267] activities, and have been intensively studied in recent decades. Brown seaweeds are the most commonly consumed, followed by red and green seaweeds consisting of non-digestible dietary fibers, proteins including essential amino acids, minerals, vitamins, and polyphenols [8910].
Our previous study demonstrated that supplementation with brown seaweeds (5% Undaria pinnatifida [UP], Laminaria japonica [LJ], Sargassum fulvellum [SF], or Hizikia fusiforme [HF]) in a high fat diet (HFD, 60% calories from fat) for 16 weeks in obese C57BL/6N mice decreased systemic inflammation at least in part by reduction of macrophage infiltration in adipose tissue [11]. Especially, supplementation with LJ and HFD resulted in significant amelioration of insulin resistance compared to HFD feeding only. In addition, alterations of muscle physiology and insulin signaling-related proteins by LJ and HF supplementation were confirmed and further compared to the results of treatment with LJ and HF water extracts in mouse-derived skeletal muscle cells (C2C12 myotubes) [12]. Furthermore, others have reported the anti-diabetic effects of brown seaweeds based on their ability to improve liver functionality. For example, Jang and Choung [13] demonstrated that the 6 weeks of Laminaria japonica Areshoung ethanol extract treatment improved insulin resistance induced by HFD in rats. In addition, fucoxanthin, a type of carotenoid from the brown seaweed UP, appeared to reduce obesity by ameliorating fat accumulation as well as improve insulin signaling [14].
Currently, there is a decent body of evidence that consumption of seaweed may attenuate risk factors for metabolic syndrome, which establishes seaweed as a potential therapeutic agent [15]. However, the effects of seaweed supplementation on lipid metabolism in the context of diet-induced obesity remain unclear. Since the liver is the largest organ in the human body and plays a pivotal role in the regulation of numerous functions, abnormal lipid and/or glucose metabolism in the liver has become highly associated with increased risk factors for metabolic syndrome [16]. Indeed, accumulation of triglycerides (TGs) and other active lipid species (i.e., diacylglycerols) has been implicated in the pathogenesis of insulin resistance and could be a common denominator in the improved metabolic profile observed in the liver and muscle [17]. Therefore, the aims of this study were to investigate alterations of blood glucose, plasma, and hepatic total cholesterol (TC) and TG levels as well as fecal TC, TG, and bile acid (BA) levels in HFD-induced obese mice in order to evaluate the effects of seaweed supplementation on glucose and lipid metabolism in the liver. In addition, we further examined insulin signaling- and lipogenesis-related proteins to decipher the mechanism(s) behind the anti-diabetic and hypotriglyceridemic effects of seaweed supplementation in diet-induced obese (DIO) mice.
Go to : 
MATERIAL AND METHODS
Experimental design and animals
C57BL/6N male mice (5-weeks-old) were purchased from Orient Bio Co. (Sungnam, Korea), housed individually, and allowed to rest for 1 week, followed by random assignment into 5 groups (n = 6 per group). The respective diets were provided for 16 weeks: HFD (60% kcal% fat, D12492) or HFD containing 5% freeze-dried UP (HFD + UP), LJ (HFD + LJ), SF (HFD + SF), or HF (HFD + HF). Four types of domestic seaweed were purchased from a traditional market in Jeju from December 2014 to March 2015. The freeze-dried seaweed powder was prepared by Research Diets (New Brunswick, NJ, USA) to produce HFD supplemented with seaweeds (5%). As a negative control, a low fat diet (LFD) group was also included in the original experimental design; however, we only represented the HFD and HFD + seaweed groups herein due to the clear and various differences between LFD and HFD. The composition of the experimental diets was reported in our previous study [11]. Animals were maintained at constant temperature (21 ± 2°C) and humidity (50 ± 20%) with a 12 h dark-light cycle and had free access to their respective food and water throughout the study. The experimental protocol was approved by the Jeju National University Institutional Animal Care and Use Committee (#2014-0004). Weekly body weight and food intake were monitored, and the fasting blood glucose (FBG) concentrations were measured every 4 weeks via tail vein during the feeding experimental period. Mice were sacrificed by cervical dislocation, followed by CO2 narcosis. Blood was collected by cardiac puncture, and plasma samples were aliquoted for storage at −80°C.
TC, TG, and BA levels in plasma, liver, and feces
Plasma TG and TC contents were measured by using a TG kit and TC kit (Asan Pharmaceutical, Seoul, Korea), respectively, according to the manufacturer's instructions. Briefly, 2 μL of plasma and 300 μL of enzyme reagent were mixed and incubated at 37°C for 10 min for TG and 15 min for TC. In addition, TC and TG contents in the liver and feces were measured by using the Folch method with some modifications [11]. A piece of liver (0.5 g) in 6 mL of Folch solution (chloroform/methanol mixture [2:1, v/v]) with 2 mL of distilled water were homogenized for 5 min using a tissue homogenizer, followed by centrifugation at 1,000 × g for 10 min. Weekly collected feces were stored at −80°C until analysis. Frozen feces were freeze-dried and homogenized in Folch solution (1 g of feces/6 mL of Folch solution) and 2 mL of distilled water for 5 min. The chloroform phase containing TC and TG was then collected. To measure TC, 500 μL of the chloroform phase was air-dried and vortexed with 50 μL of Triton X-100/chloroform mixture (1/1, v/v) and then dissolved in 450 μL of chloroform. Then, 10 μL of the mixture was transferred to a new tube and air-dried. Finally, 1.5 mL of enzymatic reagent (Asan Pharmaceutical) was added to the tube and incubated at 37°C for 5 min. To measure TG, 10 μL of the cholesterol phase was air-dried and dissolved in 50 μL of methanol. The mixture was then reacted with 1.5 mL of enzymatic reagent (Asan Pharmaceutical) at 37°C for 10 min. Absorbance was measured at 550 nm for TG or 500 nm for TC using a spectrophotometer (Molecular Devices, San Jose, CA, USA). Concentrations of plasma TG and TC were calculated based on a standard curve. Lastly, total BA levels in feces of mice fed either HFD or HFD supplemented with the 4 types of seaweed were measured using a total BA assay kit (Cell Biolabs, Inc. San Diego, CA, USA) according to the manufacturer's instructions.
Liver histology
Mice were killed by cervical dislocation following CO2 narcosis. Livers were fixed in 10% formaldehyde overnight, embedded in paraffin, sectioned, and stained with hematoxylin and eosin (H & E). Digital images were acquired with an Olympus BX51 light microscope (Olympus, Tokyo, Japan).
Western blot analysis
Proteins from frozen liver samples were isolated as described previously [11]. Briefly, liver tissue (50 mg) was processed in 500 μL of lysis buffer (50 mM Tris-HCL [pH 7.5], 150 mM NaCl, 1% Nonidet P-40, 2 mM EDTA, 1 mM EGTA, 1 mM NaVO3, 10 mM NaF, 1 mM dithiothreitol, 1 mM phenylmethylsulfonyl fluoride, 25 μg/mL of aprotinin, and 25 μg/mL of leupeptin), followed by homogenization and centrifugation. Proteins samples were quantified by a protein assay kit (Bio-rad, CA, USA). Proteins (50 μg/lane) were then separated by SDS-polyacrylamide gel electrophoresis and transferred to polyvinylidene fluoride membranes (Bio-rad, Hercules, CA, USA). Membranes were processed with 5% blocking buffer for 2 h at room temperature, followed by the indicated primary antibody (acetyl-CoA carboxylase [ACC], phospho-protein kinase B [AKT], AKT, phospho-5′-AMP-activated protein kinase [AMPK], AMPK, fatty acid synthase [FAS], glyceraldehyde-3-phosphate dehydrogenase [GAPDH], sterol regulatory element-binding protein [SREBP]-1c [1:1,000; Cell Signaling Technology, Danvers, MA, USA]) overnight at 4°C. After a series of washing with TBS-T (0.1% Tween-20 in TBS), secondary antibody, horseradish peroxide-coupled anti-species antibody (1:2,000; Cell Signaling Technology), was applied to the membrane. Proteins were visualized by enhanced chemiluminescence and quantified by Fusion Solo (Vilber Lourmat, Baden-Württemberg, Germany).
Statistical analysis
Data are presented as the mean ± standard error of the mean. Statistical differences were determined by t-test or one-way analysis of variance (significance, P ≤ 0.05), followed by Dunnett's multiple comparisons test performed using GraphPad Prism version 8.0.0 for Windows, GraphPad Software (San Diego, CA, USA).
Go to :
RESULTS
Effects of seaweed supplementation on regulation of blood glucose levels in C57BL/6N mice fed a HFD
In order to evaluate the alteration of FBG levels by seaweed supplementation in DIO mice, FBG levels were measured every 4 weeks during the course of 16 weeks of HFD feeding via tail vein (Fig. 1). Average FBG levels in LFD-fed mice were 146.5 ± 2.4 mg/dL (data not shown). At weeks 4 and 16, the LJ, SF, and HF groups showed significantly lower FBG levels compared to the HFD group. At week 8, all brown seaweed supplemented groups showed significantly lower FBG levels than the HFD group. As shown in the plot of FGB levels by feeding time (Fig. 1B), changes in FBG levels for all 3 LJ, SF, and HF groups showed a gentle slope compared to the HFD and HFD + UP groups. Thus, despite the increase in FBG levels induced by HFD in all experimental groups, seaweed supplementation (LJ, SF, and HF) did ameliorate HFD-induced FBG levels during the 16 weeks of HFD feeding.
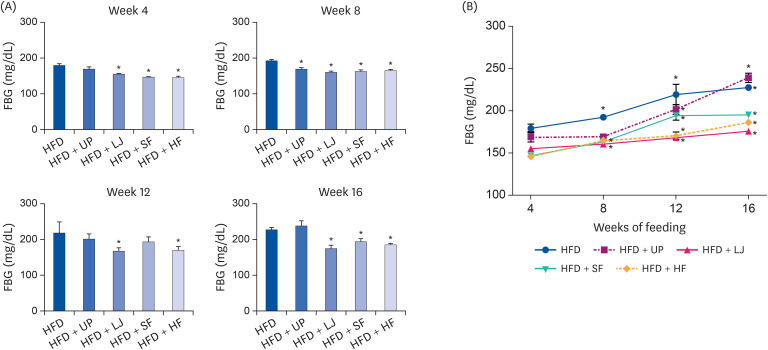 | Fig. 1Alteration of plasma FBG levels during the 16-week period of HFD or HFD supplementation with 4 types of seaweed in C57BL/6N mice. (A) Plasma FBG levels at weeks 4, 8, 12, and 16 of the experimental diet present significant differences between the seaweed supplemented groups compared to the HFD group every 4 weeks. (B) Alteration of plasma FBG levels measured every 4 weeks during the entire 16 weeks of feeding in C57BL/6N mice. Values are the mean ± standard error of the mean (n = 6 mice per group). An asterisk indicates a significant difference compared to either the HFD group (P < 0.05) or week 4 values of each group in (A) and (B), respectively.FBG, fasting blood glucose; HFD, high fat diet; UP, Undaria pinnatifida; LJ, Laminaria japonica; SF, Sargassum fulvellum; HF, Hizikia fusiforme.
|
Effects of seaweed supplementation on TC and TG levels in the liver and plasma of DIO mice
Next, we evaluated changes in the liver and plasma lipid profiles of DIO mice caused by seaweed supplementation for 16 weeks. As shown in Fig. 2, plasma TC levels were significantly reduced in the UP and HF groups compared to the HFD group. Although the LJ and SF groups tended to have lower plasma TC levels than the HFD group, the difference was not statistically significant. In the case of plasma TG levels, all 4 types of seaweed significantly lowered TG levels compared to HFD feeding only. In addition, liver H & E staining demonstrated that all 4 brown seaweed supplemented groups showed less lipid accumulation than the HFD group (Fig. 3A). Furthermore, we observed no significant alteration of TC levels in the livers of mice fed a HFD or seaweed supplemented HFD, whereas the LJ and HF groups showed significantly reduced TG levels in the liver compared to the HFD group (P < 0.05, Fig. 3B). Thus, brown seaweeds appeared to have species-specific TG-lowering effects in both the liver and circulation in DIO mice.
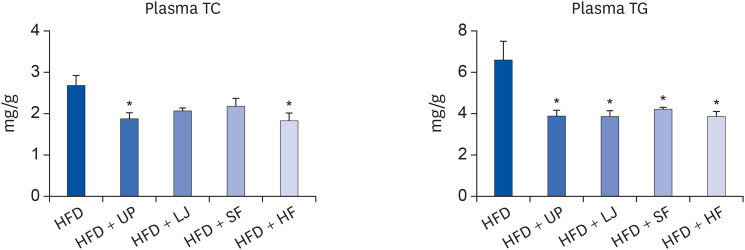 | Fig. 2Effects of seaweed supplementation on plasma TC and TG levels of C57BL/6N mice fed a HFD or seaweed supplemented HFD for 16 weeks. Values are the mean ± standard error of the mean (n = 6 mice per group). An asterisk indicates a significant difference compared to the HFD group (P < 0.05).TC, total cholesterol; TG, triglyceride; HFD, high fat diet; UP, Undaria pinnatifida; LJ, Laminaria japonica; SF, Sargassum fulvellum; HF, Hizikia fusiforme.
|
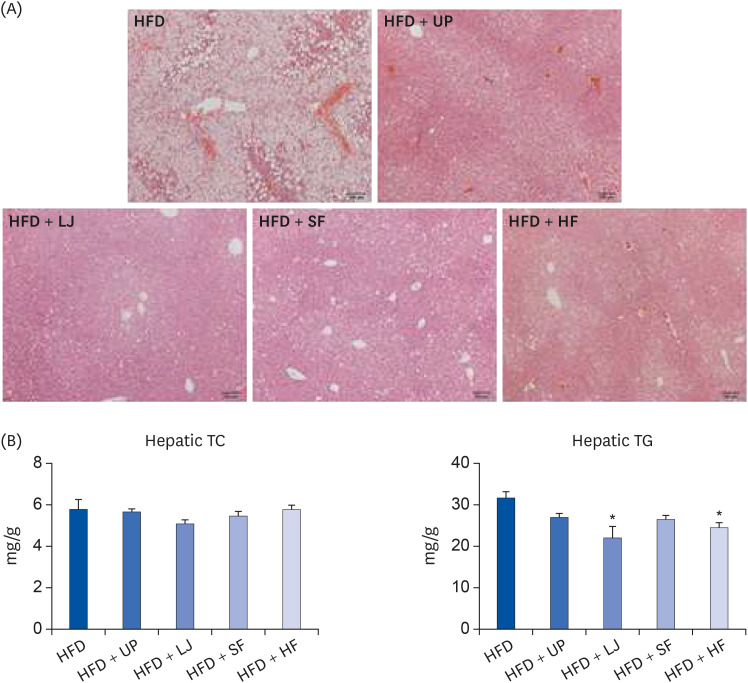 | Fig. 3Protective effects of seaweed supplementation on hepatic lipid accumulation in diet-induced obese mice. (A) Representative hematoxylin and eosin staining of livers from mice fed a HFD or seaweed supplemented HFD for 16 weeks, (B) Liver TG and TG contents of mice fed a HFD or seaweed supplemented HFD for 16 weeks (n = 5–6). Values are the mean ± standard error of the mean. An asterisk indicates a significant difference compared to the HFD group (P < 0.05).HFD, high fat diet; UP, Undaria pinnatifida; LJ, Laminaria japonica; SF, Sargassum fulvellum; HF, Hizikia fusiforme; TC, total cholesterol; TG, triglyceride.
|
Alterations of TC, TG, and BA excretion in feces of DIO mice by seaweed supplementation
We next investigated changes in TC, TG, and BA excretion in feces of DIO mice during the latter half of the 16-week HFD feeding period by performing measurements at weeks 8, 12, and 16 (Fig. 4). The TC and TG levels in feces were not dramatically altered during this period in either the HFD only or seaweed supplemented groups, whereas BA levels in feces were significantly altered especially in the UP, LJ, and SF groups at week 16. As shown in the last graph of Fig. 4 (connecting dot graph for BA concentration at weeks 8, 12, and 16), all 4 brown seaweed supplemented groups showed a continuous increase in fecal BA concentration during this period of feeding. Thus, brown seaweed supplementation increased BA excretion into feces in HFD-fed mice, although the degree of increase was different among the seaweed types (i.e., SF > LJ > UP > HF).
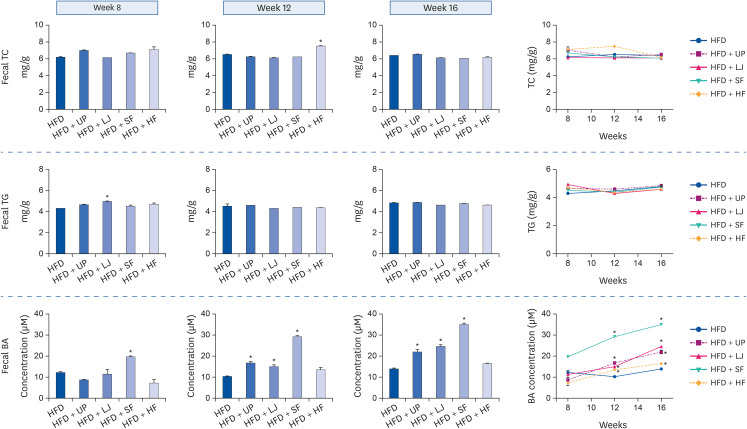 | Fig. 4Alterations of fecal TC, TG, and BA contents by seaweed supplementation during the latter half of the HFD feeding period in C57BL/6N mice. Feces samples from individual mouse cages were collected in order to measure fecal TC, TG, and BA levels as described in the Methods. Values are the mean ± standard error of the mean (n = 4–5). An asterisk in the bar graphs indicates a significant difference compared to HFD feeding only, whereas an asterisk in the connecting line graphs indicates a significant difference compared to week 8 (P < 0.05).HFD, high fat diet; UP, Undaria pinnatifida; LJ, Laminaria japonica; SF, Sargassum fulvellum; HF, Hizikia fusiforme; TC, total cholesterol; TG, triglyceride; BA, bile acid.
|
Effects of seaweed supplementation on regulation of insulin signaling and lipogenesis-related proteins in DIO mice
To further elucidate the effects of seaweed supplementation on the insulin signaling pathway, changes in 2 crucial related proteins, including AMPK and PKB/AKT, in the livers of mice fed either a HFD or seaweed supplemented HFD were investigated. As shown in Fig. 5, all 4 brown seaweed supplemented groups showed significantly improved AMPK activation via phosphorylation compared to the HFD group. In addition, the SF and HF groups showed significantly increased phospho-AKT levels compared to the HFD group.
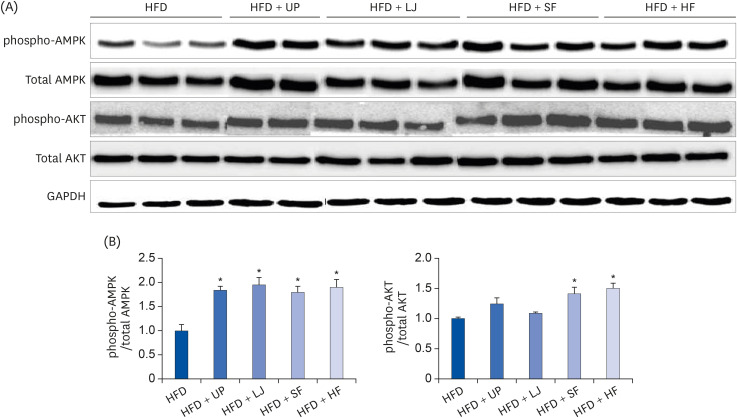 | Fig. 5Effects of insulin signaling-related proteins via seaweed supplementation in the livers of diet-induced obese mice. (A) Representative immunoblot analysis of phospho-AMPK and total AMPK, phospho-AKT, total AKT, and GAPDH levels in the liver, (B) Intensity of phospho-AMPK was normalized to total AMPK, and intensity of phospho-AKT was normalized to total AKT. Values are the mean ± standard error of the mean. An asterisk indicates a significant difference compared to the HFD group (P < 0.05).UP, Undaria pinnatifida; LJ, Laminaria japonica; SF, Sargassum fulvellum; HF, Hizikia fusiforme; AMPK, 5′-AMP-activated protein kinase; AKT, protein kinase B; GAPDH, glyceraldehyde-3-phosphate dehydrogenase; HFD, high fat diet.
|
Alterations of lipogenesis-related proteins such as ACC, FAS, and SREBP-1c were observed in the livers of mice fed either a HFD or seaweed supplemented HFD for 16 weeks (Fig. 6). Specifically, ACC expression was significantly reduced in the UP and HF groups compared to the HFD group. In the case of FAS and SREBP-1c expression, only the HF group showed significant reduction of FAS and SREBP-1c protein expression compared to the HFD group.
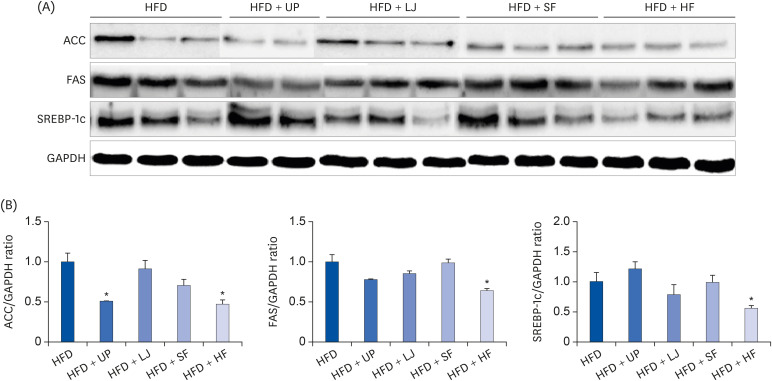 | Fig. 6Effects of lipogenesis-related proteins via seaweed supplementation in the livers of diet-induced obese mice. (A) Representative immunoblot analysis of ACC, FAS, SREBP-1c, and GAPDH in the liver, (B) Intensities of ACC, FAS, and SREBP-1c were normalized to GAPDH. Values are the mean ± standard error of the mean. An asterisk indicates a significant difference compared to the HFD group (P < 0.05).UP, Undaria pinnatifida; LJ, Laminaria japonica; SF, Sargassum fulvellum; HF, Hizikia fusiforme; ACC, acetyl-CoA carboxylase; FAS, fatty acid synthase; SREBP-1c, sterol regulatory element-binding protein-1c; GAPDH, glyceraldehyde-3-phosphate dehydrogenase; HFD, high fat diet.
|
Go to :
DISCUSSION
We previously reported that seaweed consumption ameliorated insulin resistance and systemic inflammation in C57BL/6N mice fed a HFD for 16 weeks [11]. Among the 4 types of brown seaweed (UP, LJ, SF, and HF), LJ resulted in the strongest improvement of insulin sensitivity in DIO mice based on an insulin-tolerance test, followed by HF. Even though seaweed consumption did not prevent the obese phenotype in mice, a metabolically healthy phenotype with reduced local (i.e., adipose tissue and muscle) and systemic inflammation was observed in the 5% seaweed supplemented groups. Therefore, we concluded that such physiological alteration of adipose tissue and muscle in DIO mice contributed to the potential health beneficial effects of seaweed [1112]. In the present study, we further examined lipid accumulation in the liver and local/systemic lipid profiles along with alterations of fasting glucose levels and hepatic insulin signaling- and lipogenesis-related proteins by seaweed supplementation during 16 weeks of HFD feeding in DIO mice in order to decipher the anti-diabetic and lipid-lowering effects along with potential mechanism(s) of seaweed.
In addition to LJ, other 3 brown seaweeds (UP, SF, and HF) seemed to exhibit protective potential against HFD-induced hyperglycemia in C57BL/6N mice by inhibiting and/or slowing the increase in FBG levels (Fig. 1) during the experimental feeding period. This alteration of FBG levels by seaweed supplementation in DIO mice might be attributable to both improvement of the plasma lipid profile and up-regulation of insulin signaling-related proteins such as AMPK and AKT in the liver (Figs. 2 and 5). Brown seaweeds are a rich source of non-digestible polysaccharides (dietary fiber), minerals, vitamins, polyunsaturated fatty acids, and bioactive polyphenols [81819]. Thus, seaweeds, their extracts, and/or isolated bioactive compounds from seaweeds have been shown to have various health beneficial effects, including anti-diabetic activity in both in vitro and in vivo models. For example, fucoxanthin, a carotenoid in brown seaweeds such as UP and HF, has been shown to reduce blood glucose levels in obese and diabetic KK-Ay mice [20]. In addition, a recent study by Jia et al. [21] reported the hypoglycemic and hypolipidemic properties of 3 different polysaccharides isolated from Ascophyllum nodosum, Fucus vesiculosus, and UP in diet-induced and streptozotocin-induced type 2 diabetes rats, although a direct comparison to the results of the present study might be difficult due to the different types of seaweed added to animal diets (i.e., purified polysaccharides vs. freeze-dried seaweed powder). Previously, it was demonstrated using C2C12 myotubes that water extracts of LJ and HF have anti-diabetic properties, as the extracts significantly increased phosphorylation of skeletal AMPK and AKT as well as promoted glucose uptake to levels comparable to that of insulin action on AMPK and AKT [12]. In addition, the same phenomenon was observed in muscle tissue of mice fed LJ and HF with a HFD compared to mice fed HFD only. Therefore, the anti-diabetic potential of freeze-dried seaweed supplementation in long-term HFD-induced obese mice in this present study could be attributed to the combinatory and species-specific effects of bioactive compounds contained in brown seaweeds.
Our findings also demonstrated the hypotriglyceridemic effects of all 4 brown seaweeds in the HFD feeding-DIO mouse model, whereas only UP and HF supplementation reduced circulating TC levels. Although no solid conclusion has been made yet, several studies have demonstrated the lipid-lowering effects of seaweed consumption in experimental animal models based on their high contents of polysaccharides [822]. Bocanegra et al. [22] demonstrated that dietary supplementation with Laminaria digitata (kombu) or Porphyra tenera (nori) (7% freeze-dried seaweed) in a cholesterol-rich diet for 3 weeks had a significant cholesterol-lowering effect in rats. In addition, Zha et al. [23] demonstrated the hypolipidemic effects of an LJ-derived crude polysaccharide in a diet-induced mouse model of atherosclerosis. Fucoidans are soluble fibers found in great abundance in brown seaweeds, and they constitute a potential candidate for lowering lipids. Recently, Yang et al. [24] reported that administration of fucoidan from the brown seaweed Ascophyllum nodosum for 6 weeks decreased plasma lipids in HFD-fed C57BL/6J mice via regulation of reverse cholesterol transport. Thus, the relative short-term lipid-lowering effects of seaweed consumption have been studied, but the health benefits of long-term dietary seaweed consumption in terms of hypolipidemic effects have not been well established. Future studies are necessary to identify which compound(s) from seaweeds are responsible for the plasma lipid-lowering effects of seaweed supplementation in this study.
To investigate the possible mechanism behind the hypotriglyceridemic effects observed in the present study, hepatic expression levels of proteins involved in lipogenesis, including SREBP-1c, ACC, and FAS, were determined. SREBP-1c is known to play an essential role in TG synthesis by regulating the expression of lipogenic genes, including ACC and FAS [25]. In this study, we observed that UP and HF supplementation dramatically suppressed ACC protein expression compared to the HFD group, whereas FAS and SREBP-1c protein expression levels were significantly attenuated by HF supplementation. Thus, HF supplementation appeared to suppress lipogenesis-related proteins such as ACC, FAS, and SREBP-1c compared to the HFD group, which was supported by the significant reduction of plasma TG and hepatic TG accumulation. On the other hand, inhibition of lipogenesis in the liver may not be a major factor contributing to the TG-lowering effects of LJ and SF supplementation. Evaluation of the expression of lipolysis-related genes in the liver and serum non-esterified fatty acids levels could help to further elucidate the mechanisms driving the TG-lowering effect of seaweed consumption in DIO mice.
Next, fecal TG, TC, and BA levels were measured during the latter half of the 16-week feeding period. Although seaweed supplementation did not dramatically alter fecal TC or TG levels in DIO mice, fecal BA contents profoundly increased in the UP, LJ, and SF groups compared to the HFD group. The increase in BA levels upon UP, LJ, and SF supplementation compared to that of HFD became even more pronounced as the experiment continued (i.e., fecal BA levels at weeks 8, 12, and 16). However, such alteration of fecal BA excretion was not in agreement with the reduced plasma TC levels resulting from UP and HF supplementation. Cholesterol homeostasis in the body is maintained by endogenous synthesis, hepatic transport, intestinal absorption, and excretion [26]. In the case of excretion, hepatobiliary cholesterol excretion is one method by which the body removes cholesterol, whereas active secretion of cholesterol in the proximal part of the small intestine, called transintestinal cholesterol efflux, is another way [27]. Therefore, the hepatic expression of genes involved in cholesterol synthesis and BA biosynthesis should be evaluated in a future study in order to understand the distinctive effects of the 4 different brown seaweeds.
It has been well established that dietary fiber plays an important role in regulating BA metabolism via adsorption of bile salts and their metabolites, eventually altering the excretion amounts of BAs [2829]. For example, Wang et al. [30] reported that the bile salt-binding capacity of dietary fibers derived from seaweeds, including Porphyra yezoensis, UP, LJ, and HF, can prevent the reabsorption of BA in the liver in order to maintain the balance of the bile pool, which may partially explain the increase in BA excretion upon seaweed consumption observed in the present study. In addition, AMPK, a well-known regulator of lipid and energy metabolism, was highly up-regulated by all 4 brown seaweeds in this study. Activation of insulin signaling-related protein AKT was only induced by SF and HF supplementation in DIO mice. This phenomenon was also observed in the skeletal muscle of DIO mice in our previous study; both AMPK and AKT in muscle were highly activated by LJ and HF supplementation in HFD-induced obese C57BL/6N mice [12]. Further study is needed to determine whether or not regulation of lipogenic- and insulin signaling-related proteins in the liver are pivotal elements of the systemic lipid profile.
In summary, 4 brown seaweeds (UP, LJ, SF, and HF) appeared to exhibit health beneficial properties, including reduction of systemic TG (all 4 seaweeds) and systemic cholesterol levels (UP, HF), lowering of blood glucose (LJ, SF, and HF), protection against insulin resistance (LJ, HF), and anti-inflammatory effects (all 4 seaweeds), in a long-term HFD-induced metabolically unhealthy and obese mouse model mediated via complex mechanisms involving: 1) combinatory regulation of BA excretion and hepatic expression of proteins involved in lipogenesis, 2) alteration of insulin signaling-related proteins in the liver and muscle, and 3) metabolically healthy and less inflamed adipose tissue due to a smaller cell size and reduced macrophage infiltration. Thus, the health beneficial potential of brown seaweed consumption in DIO mice could be achieved by local alterations of various organs, including adipose tissue, muscle, and the liver, resulting in improvement of whole-body physiology in a seaweed species-specific manner.
Go to :
 XML Download