

 PDF
PDF Citation
 Print
Print


INTRODUCTION
Subcutaneous implantable cardioverter defibrillators (S-ICDs) have been approved for the treatment and prevention of sudden cardiac death,1) but there are still many problems associated with inappropriate defibrillator shocks related to the implantation position and other physiological factors. According to the Investigational Device Exemption (IDE) study and EFFORTLESS registry, the proportion of patients experiencing inappropriate cardiac shocks, mostly due to T-wave oversensing (TWO), had reached 13% over three years.2) The researchers conducted preimplantation QRS-T morphology screening (TMS) by electrocardiography (ECG) simulation through a telemetry programmer (Boston Scientific, Natick, MA, USA) to avoid such events. This type of screening has become the gold standard for determining the patient's susceptibility to TWO and suitability for S-ICD implantation.3) Unfortunately, 7–15% of patients, including patients with indications for cardiac resynchronization therapy pacemaker/defibrillator (CRT-P/CRT-D), do not fulfill the screening criteria based on the intrinsic QRS/T-wave morphology during the initial stage of S-ICD screening, leaving them ineligible for S-ICD implantation.
While studying the changes of TMS in transvenous ICD candidates, we accidently tested a CRT-D candidate who had failed the TMS before CRT-D implantation, but passed the screening after 6 months. Patients in whom CRT is indicated usually have combined systolic heart failure and left bundle branch block (LBBB), which is characterized by wide QRS complexes and high-amplitude R and T waves on the ECG, resulting in non-passing TMS results. Previous studies have demonstrated that patients with such ECG morphology tend to respond to CRT, as indicated by a reduction of the left ventricular (LV) volume, increased left ventricular ejection fraction (LVEF), and improved cardiac function after CRT. In patients with CRT, the QRS complexes are narrowed, the vectorcardiogram is changed, and the R and T-wave amplitudes are decreased. The apparent shortened QRS duration indicates significantly improved biventricular electrical synchrony. Thus, we decided to investigate whether the TMS, as a composite system based on ECG changes, can predict the outcomes of patients on CRT.
The aim of this study was to determine the proportion of patients that fulfilled the TMS requirements during biventricular pacing mode and to explore the value of TMS in predicting the patient's response to CRT.
METHODS
Study population
We enrolled 55 patients who underwent de novo CRT device implantation at the Chinese Academy of Medical Sciences Fuwai Hospital between January 2016 and March 2017. All of the patients had sinus rhythm combined with LBBB before implantation, as well as indications based on the recommendations for CRT device implantation of the 2016 European Society of Cardiology (ESC) Guidelines for the diagnosis and treatment of acute and chronic heart failure.4) This study conformed to the tenants of the Declaration of Helsinki. The local Ethics Committees approved the study, and all of the patients provided written informed consent.
TMS
TMS was performed before and on the third day after CRT device implantation (Boston Scientific). The ECG leads were placed on the body to simulate S-ICD implantation positioning: the left arm lead was placed lateral to the left xiphoid, the right arm lead was placed left of the sternum and 14 cm cranial to the left arm lead, and the left leg lead was placed in the fifth intercostal space on the left midaxillary line.5) Three vectors were produced among the electrodes: primary, secondary, and alternate vectors. These vectors were recorded at a paper speed of 25 mm/s with a gain of 5−20 mV for a period of 10 seconds in the supine and sitting positions. During the test, peak-cutting was avoided and QRS complexes were kept stable as much as possible. TMS templates were utilized for the ECG screening. The ECG recording indicated a passing TMS result only if the maximum R or S-wave amplitude was located in the peak or trough area of the templates, and no portion of the QRS complexes or T waves exceeded the template. If at least one vector passed the TMS in both positions (supine and sitting), the patient was considered to be a “pass” (Supplementary Figure 1).3) The ECG recordings were evaluated by at least 2 reviewers. Training department commissioners from Boston Scientific participated in determining the results.
CRT device implantation
All of the patients underwent CRT device implantation using the transvenous approach. Coronary venous angiogram was performed prior to LV lead positioning to determine whether the coronary sinus branch was suitable for LV lead placement. In all of the cases, the LV lead was preferably positioned in the lateral or posterolateral vein and positioning in the apical LV segment was avoided. If these veins were not accessible, the lead would be implanted in the other branch of the coronary sinus. The right ventricular and atrial leads were implanted in the right ventricular apex and right auricle, respectively. LV pacing thresholds, sensing parameters, and LV impedance values were noted, and pacing output was programmed to achieve adequate pacing safety margins. Subsequently, the guiding long sheath in the coronary sinus was cut and extracted. A pulse generator was connected with the leads and inserted subcutaneously in a pocket on the left chest. In order to improve the degree of biventricular pacing, patients received optimal medical treatment and device programing. The medical treatment consisted of a maximized dosage of β-blocker and ACE-inhibitors. The patient underwent transmitral Doppler-directed adjustment of the AV delay using an iterative technique6) prior to discharge, and at every scheduled follow-up visit thereafter. The CRT interventricular delay ranged from 0 to 40 ms, according to the standard of the shortest biventricular paced QRS duration. The pacemakers of patients with permanent atrial fibrillation were programmed to account for this condition, such as switching the pacing mode to VVI, activating “Ventricular Sense Response (VSR)”, or undergoing AV node ablation.
Surface 12-lead ECG analysis
All of the patients received surface 12-lead ECG tests prior to, 3 days after, and 6 months after CRT implantation. The QRS and the T waves of leads II and III were analyzed because these leads mimic leads II and III of the S-ICD. The QRS /T amplitude ratio in each of the two leads was collected. All of the ECGs were analyzed by 2 independent electrophysiologists.
Echocardiographic analysis
Echocardiographic parameters included left atrial diameter (LAD) and LV end-systolic volume (LVESV). Echocardiography investigators and sonographers were experienced in performing echocardiography tests. Echocardiography investigators analyzing the images were blinded to treatment assignment and clinical outcome. LVEF was calculated using the modified biplane Simpson's rule for apical imaging planes. LAD was measured by Simpson disk method in the apical 4- and 2-chamber views.7)
Definitions
Ischemic cardiomyopathy (ICM) was defined as cardiomyopathy with impaired contractile performance and a history of myocardial infarction. The intervention treatments were percutaneous coronary intervention, coronary artery bypass grafting, or clear evidence of coronary stenosis (more than 75%).8)
Non-ischemic cardiomyopathy (NICM) was the default diagnosis of ICM, which was characterized by myocardial dysfunction in the absence of prior history of infarction or significant coronary artery disease.9)
Response to CRT was defined as a ≥15% reduction in the LVESV, while super-response was defined as a ≥30% reduction in the LVESV after 6 months of CRT.10)
The LBBB criteria were based on Strauss criteria, and included QRS duration (QRSd) ≥ 140 ms for men and ≥130 ms for women, as well as mid-QRS notching or slurring observed at least in 2 contiguous leads in V1, V2, V5, V6, I, and/or aVL, in addition to QS or rS in leads V1 and V2.
QRS duration was measured from the beginning to the end of the QRS wave.
QRS shortening was defined as a QRS duration of less than 120 ms during the biventricular pacing mode.
ΔQRS was defined as the change in QRS duration after CRT (post-CRT biventricular-paced QRS duration minus pre-CRT RV-paced QRS duration).
The ΔQRS_Index was defined as ΔQRS duration /baseline QRS duration×100.11)
BiV pacing QTc measured from the beginning of the QRS wave to the end of the T wave and was corrected for heart rate during BiV pacing mode.
The QRS/T amplitude ratio was the QRS wave amplitude divided by T amplitude in leads II or III.
Statistical analysis
All of the analyses were conducted using SPSS version 22 (IBM Inc., Chicago, IL, USA). Continuous variables were expressed as mean±standard deviation and categorical variables were expressed as numbers or percentages. Different patient groups were compared using the Mann-Whitney U test for continuous variables and the χ2 test or Fisher's exact test for categorical variables, as appropriate. Logistic regression analysis was used to determine the response-rate-associated predictors. The factors with a level of significance of p<0.1 in the univariate analysis were included in the multivariate analysis. The odds ratio of continuous variables indicated risk with each unit increase. Statistical significance was set at p<0.05. All of the reported p values are 2-tailed.
RESULTS
Patient characteristics before and after CRT device implantation according to TMS passing status
Of the 55 enrolled patients, 38 (69.1%) were male, 15 (27.3%) were preoperative New York Heart Association (NYHA) class II, 34 (61.8%) NYHA class III, and 6 (10.9%) were NYHA class IV. Twenty-nine patients (52.7%) were implanted with CRT-D. The average QRS width was 167.7±17.2 mm preoperatively and 121.4±19.2 mm postoperatively. The average BiV pacing QTc was 466.7±18.2 ms. The average BiV pacing QRS/T ratios in leads II and III were 3.7±2.0 and 3.9±2.0, respectively. The BiV pacing QRS/T ratio in lead II in the passing group was significantly larger than in the non-passing group (4.0±2.2 vs. 3.0±1.2, p=0.048). The mean LVESV, LAD, and LVEF were 186.9±57.3 mL, 43.6±5.8 mm, and 29.3±6.1%, respectively. Etiologically, there were 42 patients with NICM and 13 with ICM.
Interestingly, all of the patients failed to pass the TMS under intrinsic rhythm. Thirty-nine patients (70.9%) passed the TMS during the biventricular pacing mode soon after CRT implantation. Among them, 5 (12.8%) qualified based on scoring of 3 vectors, 15 (38.5%) qualified based on 2 vectors, and 19 patients (48.7%) qualified based on 1 vector. The patients were divided into the passing or non-passing group according to whether they passed the TMS after CRT implantation. There were no significant differences between the TMS passing and non-passing groups in the baseline characteristics, except for a lower proportion of hypertension in the passing group (7.7% vs. 43.8%, p=0.004; Table 1).
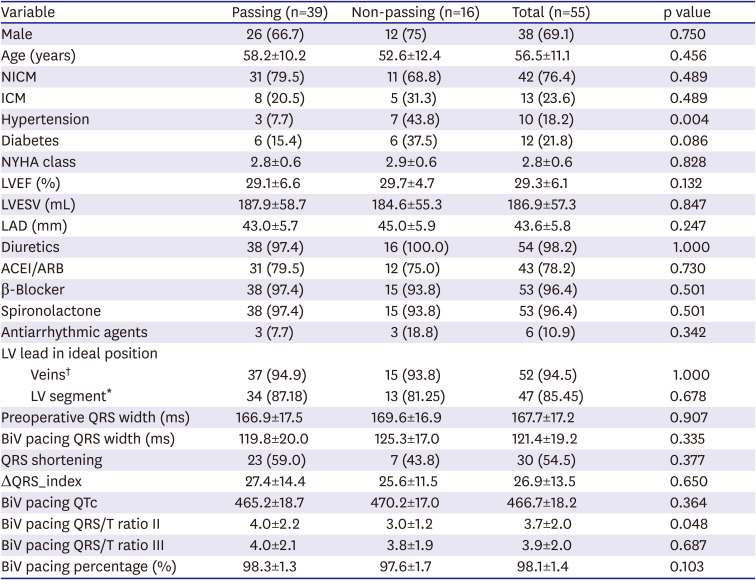
Table 1
Pre- and postoperative characteristics of patients according to TMS passing status
Data are presented as numbers (%) or mean±standard deviation.
ACEI = angiotensin converting enzyme inhibitor; ARB = angiotensin receptor blocker; BiV = biventricular; ICM = ischemic cardiomyopathy; LAD = left atrial diameter; LVEF = left ventricular ejection fraction; LVESV = left ventricular end-systolic volume; NICM = non-ischemic cardiomyopathy; NYHA = New York Heart Association; TMS = QRS-T morphology screening.
*The LV lead is in the LV non-apical segments. †The LV lead is in the lateral or posterolateral branches of the coronary sinus.
![]()
Comparison of the heart functional indices between the baseline and 6 months after CRT device implantation according to TMS passing status
At the 6-month follow-up after CRT device implantation, the NYHA functional class, LVEF, and LVESV had significantly improved in both groups compared with those at baseline. LVESV was significantly more reduced in the passing group than in the non-passing group (45.5±32.1 mL vs. 16.6±30.8 mL; p=0.003). No other significant differences were found between the 2 groups (Table 2).
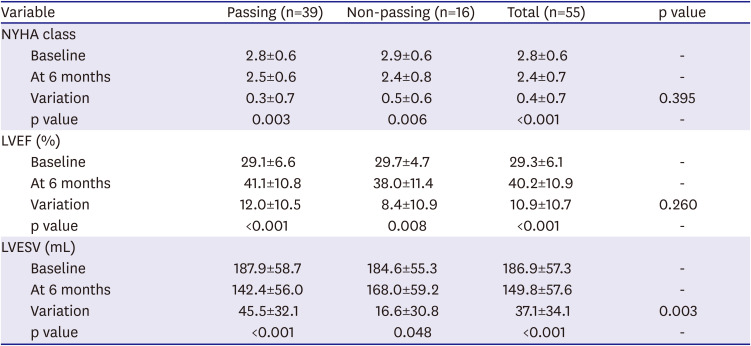
Table 2
Comparison of the functional heart indices between the baseline and 6 months after CRT device implantation according to TMS passing status
Data are presented as mean±standard deviation.
CRT = cardiac resynchronization therapy; LVEF = left ventricular ejection fraction; LVESV = left ventricular end-systolic volume; NYHA = New York Heart Association; TMS = QRS-T morphology screening.
![]()
Inter-group comparison of the CRT response rate
In our study, 36 patients responded to CRT, for an overall response rate of 65.5%. There were 31 responders in the passing group and 5 in the non-passing group, and this difference was statistically significant (31/39 [79.5%] vs. 5/16 [31.3%]; p<0.001). A total of 10 patients super-responded to CRT, for an overall super-response rate of 18.2%. There were nine super-responders in the passing group and only one in the non-passing group, accounting for a statistically significant difference (9/39 [23.1%] vs. 1/16 [6.3%]; p=0.020; Table 3). Among the patients who passed the TMS, the proportion of responders who qualified in three, two, or one vector were 100% (5/5), 86.7% (13/15), and 68.4% (13/19), respectively. Our study demonstrated that the response rate to CRT was significantly higher among patients who qualified in all three vectors than in those who qualified in only one vector (p=0.004). There were no significant differences among the remaining subgroups. Among patients who passed the TMS, the proportion of super-responders who qualified in 3, 2, or 1 vector was 80% (4/5), 20% (3/15), and 10.5% (2/19), respectively. The super-response rate was significantly higher in patients who qualified in all three vectors than in the other two subgroups (3 vs. 2 vectors, p=0.018; 3 vs. 1 vector, p=0.003; Figure 1).

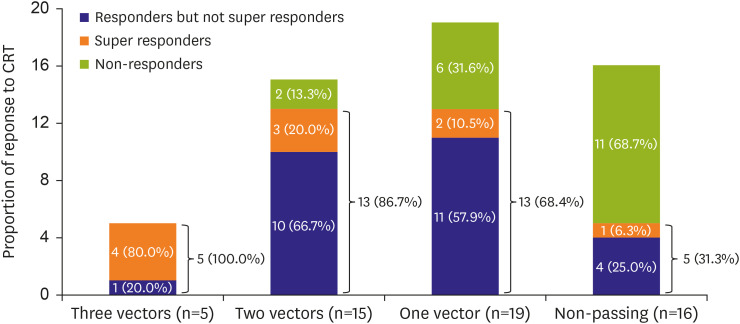
Table 3
Association between TMS pass rate and response to CRT during biventricular pacing mode
| Outcome | Passing (n=39) | Non-passing (n=16) | Total (n=55) | p value |
|---|---|---|---|---|
| Response | 31 (79.5) | 5 (31.3) | 36 (65.5) | 0.001 |
| Super response | 9 (23.1) | 1 (6.3) | 10 (18.2) | 0.020 |
Data are presented as numbers (%).
CRT = cardiac resynchronization therapy; TMS = QRS-T morphology screening.
![]()
Predictors of response to CRT
The multivariate logistic regression analysis indicated that a smaller LAD (odds ratio [OR], 0.851; 95% confidence interval [CI], 0.735–0.984; p=0.030), larger ΔQRS_Index (OR, 1.092; 95% CI, 1.022–1.167; p=0.009) and passing of TMS during the biventricular pacing mode (non-passing vs. 1 vector and vs. 2 and 3 vectors were OR, 8.067; 95% CI, 1.337–48.676; p=0.023 and OR, 17.643; 95% CI, 2.364–131.649; p=0.005, respectively) were independent predictors of response to CRT (Table 4).
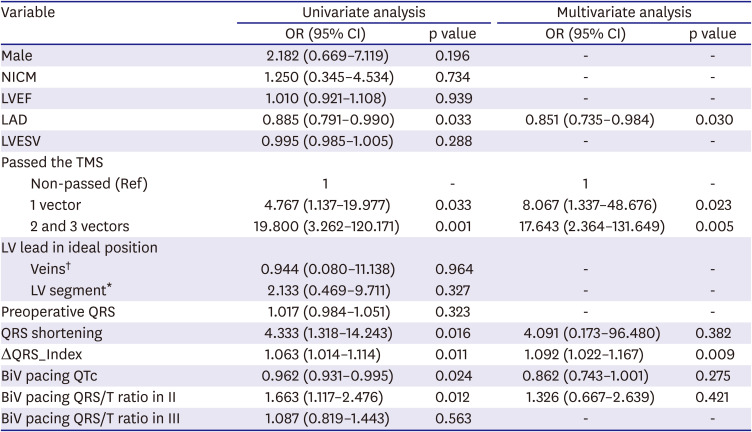
Table 4
Factors predicting response to CRT
Only variables with p<0.10 in the univariate analyses were included in the multivariate model.
BiV = biventricular; CI = confidence interval; CRT = cardiac resynchronization therapy; HR = hazard ratio; LAD = left atrial diameter; LVEF = left ventricular ejection fraction; LVESV = left ventricular end-systolic volume; NICM = non-ischemic cardiomyopathy; TMS = QRS-T morphology screening.
*The LV lead is in the LV non-apical segments. †The LV lead is in the lateral or posterolateral branches of the coronary sinus.
![]()
DISCUSSION
Response and super-response to CRT are vital objectives for CRT device implantation. The majority of previous studies have focused on predicting the efficacy of CRT using baseline clinical characteristics before implantation.12)13) The preoperative QRS duration, LBBB, small left atrium (LA) or LV, and mild mitral regurgitation are regarded as independent predictors of response and super-response to CRT.14)15)16) Among these factors, the duration and morphology of the QRS complex are the most important indicators; numerous guidelines for the treatment of chronic heart failure and CRT implantation highlight the importance of preoperative QRS duration as an indication for CRT implantation.
However, few studies have focused on the postoperative QRS morphology as a predictor of response to CRT. A small-sample retrospective study published in 2016 showed that the ECG axis change in the CRT responder group was more prominent than that of the non-responder group, which indicated that ECG axis change could be used to predict CRT response.17) Another study revealed that if the ECG JT correction interval (JTc, the interval from the J point to the end of the T wave) was ≥358.50 ms and the Tp-e correction interval (Tp-ec, interval from the T wave peak to the intersection of the tangent of the T wave descending maximum slope and the equipotential line) was ≥116.47 ms, the risks of CRT-D treatment increased significantly. These findings were associated with malignant arrhythmia and poor prognosis. Recently, Hiraiwa et al.18) tried to use the Selvester QRS score, which reflects myocardial fibrosis assessed by collagen volume fraction, to predict future cardiac events in patients with non-ischemic dilated cardiomyopathy on CRT. Another randomized, controlled study from our group19) found that the postoperative TpTe interval (the interval between the T wave peak or trough and the T wave end) after CRT device implantation had a predictive value for ventricular arrhythmia. These studies indicated that QRS and T wave duration and R wave amplitude are associated with the post-CRT outcomes.
S-ICD algorithms must be full-fledged to ensure an accurate representation of the patient's activities in daily life. The TMS shape screening template is mainly used for ECG evaluation before implantation to assess the patient's suitability for S-ICD implantation. Patients who pass the screening are considered to be non-susceptible to TWO and suitable for S-ICD implantation. In our study, 39 (70.9%) patients passed the screening during the biventricular pacing mode. Although the pass rate of TMS in previous studies was generally higher, reaching 85.2–92.6%,20) considering the worse cardiac function of patients with wide QRS morphology in our study, the TMS pass rate during biventricular pacing was still within an acceptable range.
According to the baseline characteristics, the proportion of patients with hypertension in the passing group was lower than those of the non-passing group, suggesting that patients with hypertension did not successfully pass the TMS. The total proportion of hypertension across all of the patients in this study was smaller than that of previous studies with ICD indication.3) A study (n=44) that assessed the prevalence of S-ICD's eligibility in patients after CRT implantation also observed a relatively low proportion of hypertension.21) However, our study showed no significant difference between the eligible and ineligible groups. We speculate that the study population selection and small sample size might contribute to this difference. Previous studies have found that increased blood pressure is associated with abnormalities on the ECG mainly driven by LV hypertrophy and due to chronic pressure overload.22) The prevalence of ST/T changes and prolonged QTc were generally higher in hypertensive patients than in normotensive individuals. These features might make it difficult for hypertensive patients to pass the TMS. These features tend to be more pronounced in patients with LBBB, which also make it difficult for these patients to pass the TMS.
The TMS was used to select individuals with ECG results that satisfied the requirements of the S-ICD sensing algorithm criteria. The sensing algorithm of the S-ICD depends on the surface ECG morphology, including the R-wave amplitude, T-wave amplitude, R/T ratio, QRS duration, and QT interval.23) Therefore, the TMS can be regarded as a complex parameter of ECG. Previous studies have evaluated the effectiveness of QRS duration and QRS morphology on predicting patient response to CRT. One of the studies divided the patients into three groups for strict LBBB, conventional LBBB and non-LBBB. Strict LBBB predicted significant reduction of QRS duration and LVEF.24) The increasing QRS duration was confirmed to be significantly associated with reduction of LVESV, as well as with an increase in LVEF, in both the LBBB and non-LBBB groups. Antonius et al.25) found that QRS duration and morphology failed to predict CRT response in patients beyond a class I indication for CRT. However, the QRS area alone has shown an independent association with CRT outcomes. The QRS area took both the QRS duration and QRS morphology into consideration. TMS results correlated with the QRS area; because both QRS duration and the amplitude of QRS and T waves satisfied the template, QRS area can defined as passing the TMS. In general, leads I, II, and III of the TMS are equivalent to leads I, II, and III of the surface ECG. The amplitude of the QRS complexes, the QRS/T wave amplitude ratio, and the wave width consistency were screened. The best range for R wave sensing was found to be 0.25−3.5 mV, with a simultaneous QRS /T wave amplitude ratio of more than 2.5. In our study, univariate analysis showed that the BiV pacing QTc and BiV pacing QRS/T ratio in lead II are associated with CRT response, but multivariate analysis did not show this effect. These results indicated that QRS duration or morphology alone might not predict the outcome of CRT. Accordingly, TMS had a strict limit on both the shape and duration of the patient's QRS-T complexes and considered the different positions and vectors simultaneously. Therefore, it seemed more convenient and reasonable to evaluate the change of the QRS-T complexes and predict CRT response using the TMS screening template. The basic heart rhythm for all 55 patients in this group was LBBB with a baseline QRS width up to 167.7±17.2 ms. Under these conditions, all of the patients failed the TMS, which was consistent with previously reported results.5)26) During the biventricular pacing mode, the QRS complexes tended to be narrow (121.4±19.2 ms), the ECG vector axis changed and even reversed, and the QRS/T amplitude ratio increased, which made it easier to pass the TMS. Fontaine et al.27) found that CRT response rate was highest when the LV lead was delivered to the lateral and posterior walls. With this placement, the original large and abnormal R waves in lead I of the LBBB transformed into ‘QS’ or ‘QR’ complexes, and the QS complexes in lead III transformed into R waves, with the amplitude and duration of QRS complexes decreasing at the same time. Ip et al.28) reported that up to 80% of patients had decreased QRS duration and increased QRS/T amplitude ratio after CRT, while only 46% of patients had similar changes during right ventricular pacing (ECG patterns are similar to LBBB patterns). Passing the TMS under the biventricular pacing mode indicates that there was a noticeable reduction in the duration of the QRS-T complexes, which implied significant improvement of the biventricular systolic synchrony. Modified biventricular systolic synchrony can reduce the heterogeneity of ventricular repolarization, improve repolarization dispersion, accelerate reversal of ventricular remodeling, reduce the size of an enlarged LV, increase LVEF, and distinctly improve the patient's heart function. Therefore, patients who passed the TMS were more likely to respond, and even super-respond, to CRT. Therefore, S-ICD preimplantation screening might be an alternative measurement to detect CRT response.
In addition, the multivariate analysis in our study showed that LA dimension was an independent predictor of CRT response. The LA has multiple functions. It conveys the blood from the pulmonary veins to the LV during early diastole, and contracts to augment LV filling in late diastole. The LA is exposed to the pressure of LV filling; thus, the chronic increased stiffness or noncompliance of the LV would lead to structural change in the LA.29) Structural change in the LA may correlate with atrial fibrosis and dysfunction. These factors contribute to adverse outcomes. This study's results correspond with those of a previous study that LA size and function independently correlate with CRT response.29)
This study demonstrated that symptom improvement (NYHA class) was a significant intra-group, but not a significant inter-group. The variation of symptom improvement was greater in the non-passing group. Furthermore, the NYHA class before CRT showed no significance between the passing and non-passing groups. The estimation of NYHA class was based on the patient's subjectivity as well. These factors may have led to the result of no significant inter-group difference in symptom improvement.
Our study has several potential limitations. This was a single-center retrospective study with a small sample size. The patient follow-up time was short; thus, we could not evaluate the long-term efficacy and prognosis of CRT. In addition, the effects of antiarrhythmic drugs on the ST-T segment and the Q-T interval were not considered, although the proportion of antiarrhythmic drug use was low among the enrolled patients. Large-scale clinical trials are needed in order to validate our results.
In conclusion, our study indicated that patients on CRT who passed the TMS during biventricular pacing mode were more likely to respond and even super-respond to CRT. Therefore, TMS, as a composite tool that simplified the evaluation of QRS duration and morphology, may be useful in predicting the need for further advances in heart failure therapy.
 XML Download