Journal List > Korean J Sports Med > v.38(3) > 1145188

객관적으로 측정된 좌식행동과 심혈관질환 위험요인의 비교

Abstract

Purpose

The purpose of this study was to examine the relationship between sedentary behavior measured by accelerometer and cardiovascular disease risk factors from Korea National Health and Nutrition Examination Survey 2014–2015.

Methods

The participants included in this study volunteered to wear accelerometer (n=1,407). Ordinal logistic regression was used to examine the relationship between sedentary time or sedentary breaks and cardiovascular disease risk factors. Odds ratios and 95% confidence intervals were calculated for the relationship. Covariates were sex, age, educational status, alcohol, smoking, socioeconomic status, body mass index, calorie intake, physical activity, and accelerometer wear time.

Results

The group with the most sedentary time had significantly greater odds of having dyslipidemia (odds ratio, 2.47; 95% confidence interval, 1.54–3.94) compared to the least. There were no other significant relationships between sedentary behavior (sedentary time, sedentary break) and risk factors.

Conclusion

The only significant relationship found in this study was that between sedentary time and dyslipidemia.

서 론

심혈관 질환은 2018년 기준 한국인의 두 번째 사망원인으로서 10만명당 122.7명이 해당질환으로 사망하였다1. 심혈관 질환 위험요인으로는 특정 나이, 가족력, 흡연, 좌식활동, 비만, 고혈압, 이상지질혈증, 당뇨가 있다2. 좌식행동(sedentary behavior)은 중고강도 신체활동과 더불어 심혈관질환 위험에 유의한 영향을 끼친다고 보고되고 있다3,4.
2003년부터 2006년까지 미국 국민건강영양조사(National Health and Nutrition Examination Survey [NHANES])에서 가속도계를 이용해 좌식행동을 측정하였다. Healy 등5은 해당자료를 분석하여 좌식시간 및 좌식정지(sedentary break) 횟수와 심혈관질환 생체지표 사이의 연관성을 연구하였다. 그 결과, 많은 좌식시간은 큰 허리둘레, 낮은 고밀도 지단백 콜레스테롤(high-density lipoprotein cholesterol [HDL-C]), 높은 중성지방(triglyceride [TG])과 관련이 있었고, 적은 좌식정지 횟수는 큰 허리둘레와 관련이 있었다.
Park 등6은 2013년 한국 국민건강영양조사(Korea National Health and Nutrition Examination Survey [KNHANES])에서 설문지로 측정한 성인들의 좌식시간과 심혈관질환 생체지표 사이의 연관성을 연구하였다. 그 결과 많은 좌식시간은 높은 이완기 혈압(diastolic blood pressure [DBP])과 낮은 HDL-C와 관련이 있었다.
좌식행동은 연구목적과 연구자의 상황에 따라 설문지 또는 가속도계와 같은 기계를 이용하여 측정될 수 있다. 설문지로 측정하는 경우 TV 시청과 같은 좌식형태와 집이나 직장과 같이 좌식행동이 일어나는 상황에 대한 정보를 확인할 수 있다. 반면 가속도계는 인체움직임을 객관적으로 측정할 수 있으며 사람의 개입에 의한 오류가 적은 측정도구이다. 또한 정보를 지속적으로 저장할 수 있기 때문에 설문지에 비해 다양한 분석이 가능하다.
KNHANES에서는 2014년과 2015년 조사 참여자들 중 희망하는 사람들만 모집하는 편의표집 방법을 통해 가속도계로 신체활동을 측정하였고, 2019년에 원자료를 공개하였다. 현재까지 한국 성인의 가속도계로 측정된 좌식행동과 심혈관질환 위험요인 사이의 관계를 살펴본 연구는 매우 부족하다. 또한 아직까지 국내의 KNHANES 가속도계 자료를 이용하여 좌식행동과 심혈관질환 위험요인 사이의 관계를 살펴본 연구는 없었다. 따라서 본 연구의 목적은 KNHANES에서 가속도계로 측정된 한국 성인의 좌식행동과 심혈관질환 위험요인과의 관계를 비교하는 것이다.

연구 방법

KNHANES는 인구주택총조사 자료를 표본 추출틀로 한 2단계 층화집락표본추출 확률표본조사이며 본 연구는 제6기 2, 3차년도(2014–2015년)에 조사된 연구대상자들 중 가속도계를 착용한 사람들의 자료만 활용되었다.
연구대상자는 이동검진차량에서 기본검진조사 및 건강설문조사를 실시하였고, 이후 가속도계 착용에 동의한 사람들은 1주일간 가속도계(ActiGraph GT3X+, Pensacola, FL, USA)를 왼쪽(또는 오른쪽) 허리에 착용하였다7. 연구대상자는 취침, 샤워 및 수영을 제외하고 가속도계를 착용하도록 안내 받았으며 가속도계 요약주기(epoch)는 1분으로 설정되었다. KNHANES에서 제공되는 원자료는 가속도계의 단축 데이터이며 본 연구에서 원자료를 분석하기 위해 Lee 등8이 제시한 권고사항을 적용하였다.
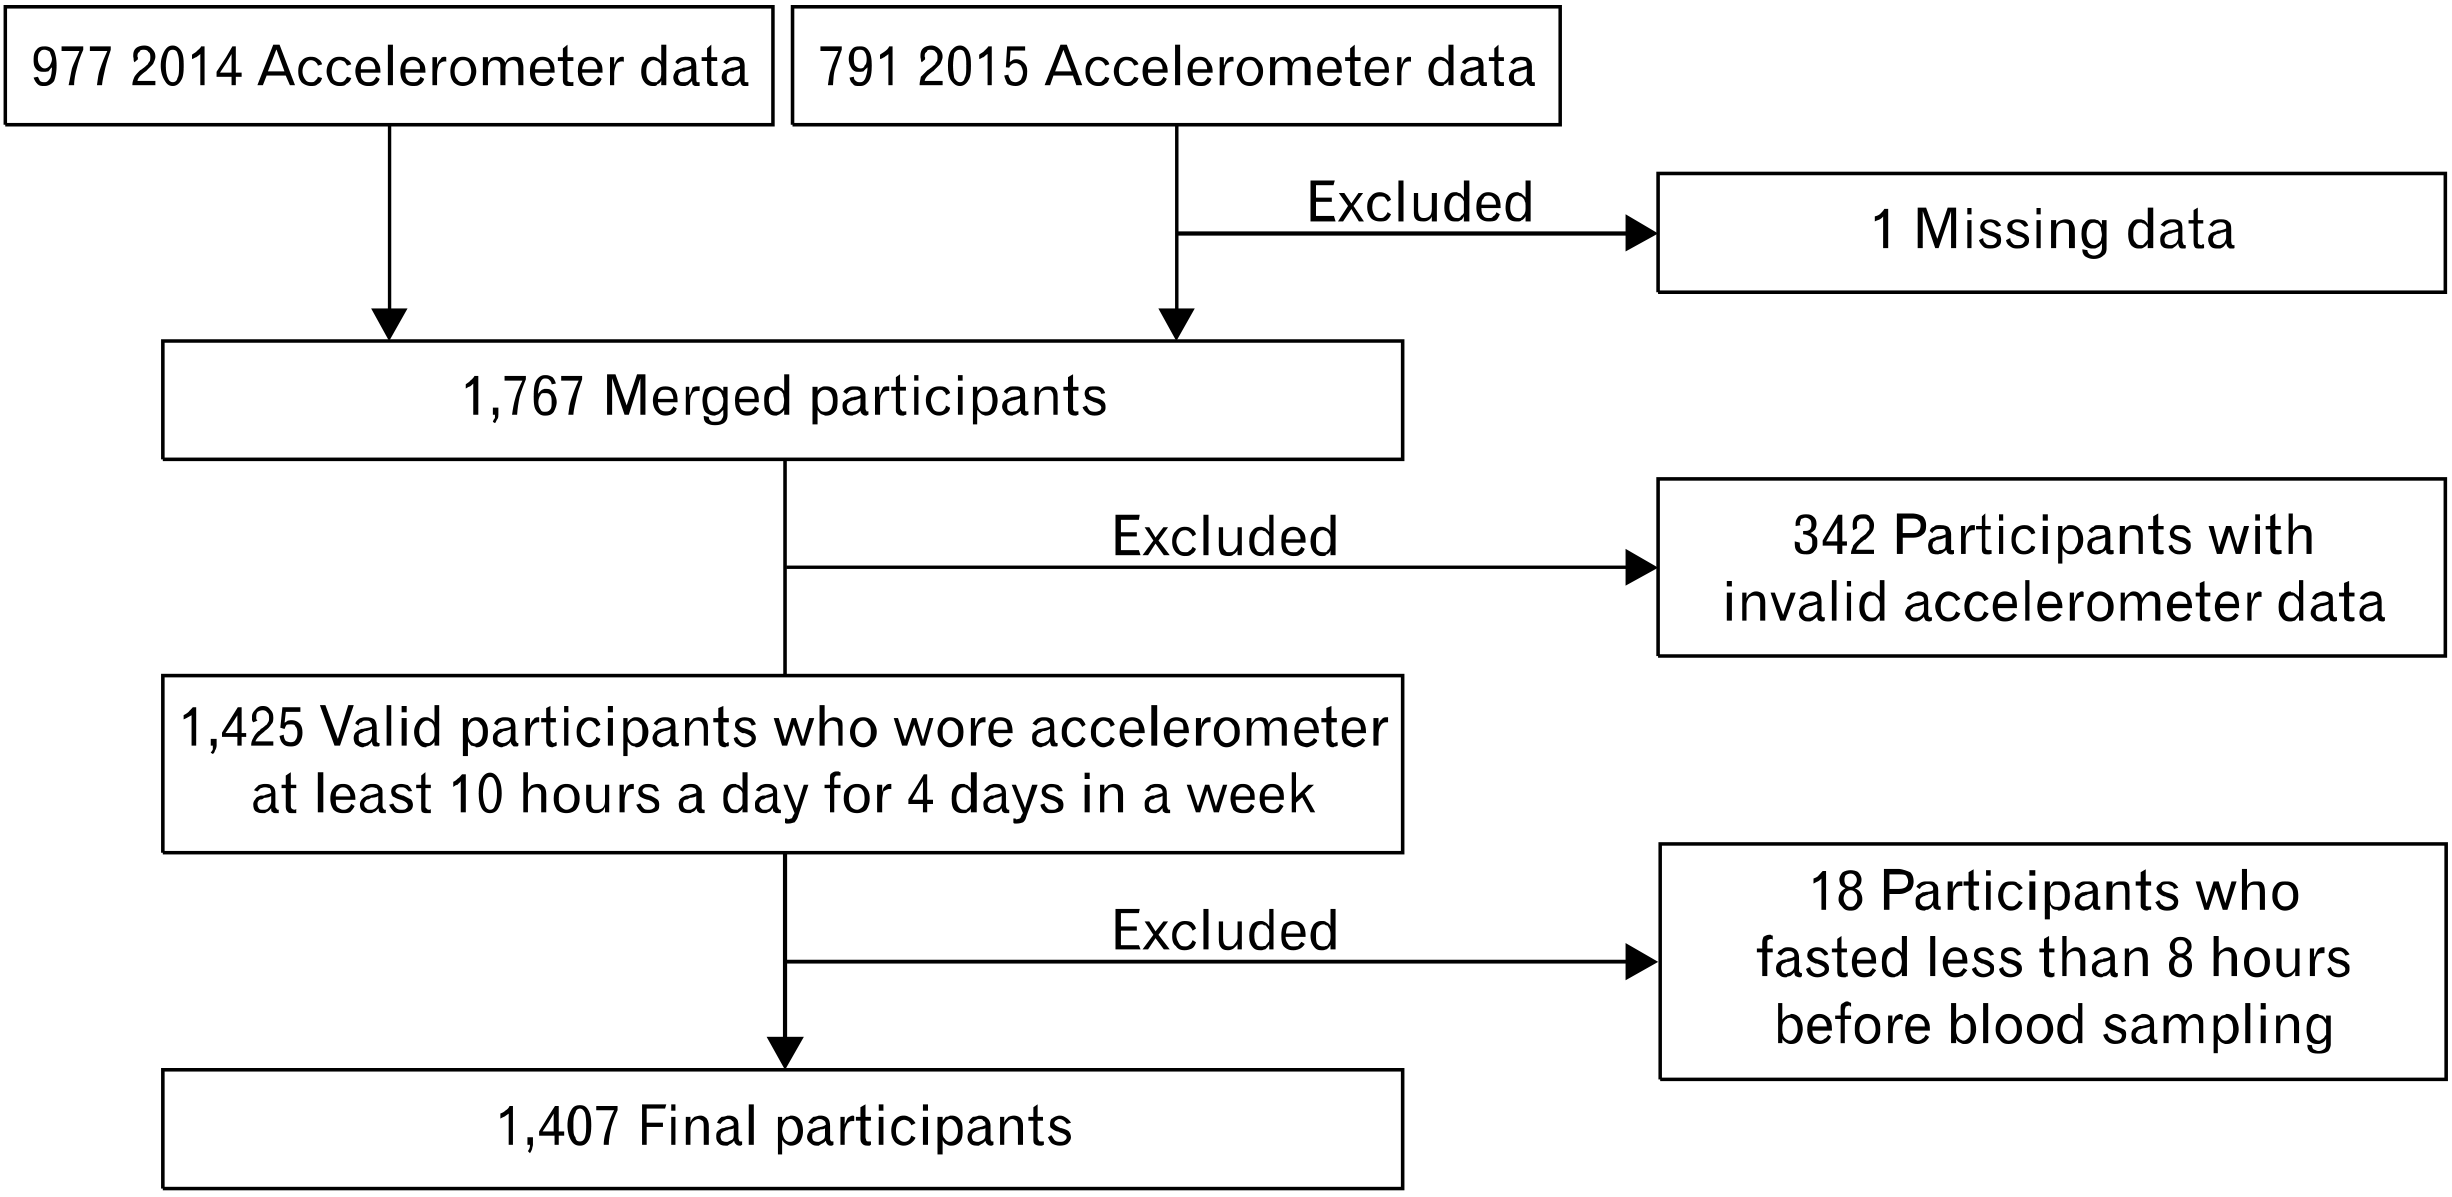
가속도계 비착용시간 기준은 Troiano 등9이 제시한대로 counts per minute (CPM)가 0인 상태로 60분 이상 지속된 경우(단, CPM 100 미만 2분까지의 데이터도 비착용시간으로 간주됨)로 하였다. 최초 1,767명의 원자료에서 신체활동 데이터의 신뢰성을 위해 하루 최소 착용시간 10시간 이상인 날들이 1주일간 최소 4일이상 되는 인원(n=1,425)만 선정하였다10-12. 심혈관질환 위험요인의 신뢰성을 위해서 혈액채취 전 공복시간이 8시간 미만이었던 대상(n=18)을 제외한 사람들을 최종 연구 대상자(n=1,407)로 선정하였다. 이와 같은 최종 연구 대상자 선정과정은 Fig. 1에 flow diagram으로 제시하였다. 본 연구에서 분석된 자료는 질병관리본부 연구윤리심의위원회의 승인13을 통해 조사되었으며 2차자료 분석을 위해 교신저자 소속대학 생명윤리위원회의 심의면제 승인을 받았다(IRB No. E1912/002-013).

1. 변수 설명

1) 좌식행동

본 연구에서의 좌식행동은 좌식시간 및 좌식정지 횟수 두가지 변수로 정의되었다. 좌식시간은 가속도계 착용 간 100 CPM 미만으로 측정된 시간을 모두 합한 것을 의미하고, 이것을 하루평균 분(minute)으로 계산하여 나타냈다5. 한편, 좌식정지 횟수는 가속도계 착용 간 100 CPM 미만의 좌식상태에서 활동적인 상태(100 CPM 이상)로 전환되는 상황이 하루 평균 몇 회 일어났는지 의미한다14. 본 연구에서 이러한 좌식행동은 결과의 의미해석이 용이하도록 5분위수(quintile)로 나누어 서열척도화 되었다.

2) 공변인(covariates)

좌식행동과 심혈관질환 위험요인 사이의 관계를 비교하는데 있어서 혼동변인으로 작용할 수 있는 10가지 요인(성별, 나이, 교육수준, 음주, 흡연, 경제수준, body mass index, 칼로리섭취량, 신체활동, 가속도계 착용시간)들은 선행연구5를 참고하여 공변인으로 선정하였다. 교육수준, 음주, 흡연, 경제수준의 세부정의는 KNHANES 원시자료 이용지침서13Table 1에 명시되어 있다. 칼로리섭취량은 KNHANES 식품섭취조사(24시간 회상자료)를 통해 산출된 1일 에너지 섭취량(kcal)을 의미하며, 신체활동은 Troiano 기준9을 적용한 중고강도(중강도 CPM 2,020 이상, 고강도 CPM 5,999 이상) 시간(분)을 의미한다.

3) 심혈관질환 위험요인

심혈관질환 생체지표는 Table 2에 제시된 것과 같이 수축기 혈압(systolic blood pressure [SBP]), DBP, 공복혈당(glucose [GLU]), 당화혈색소(glycated hemoglobin [HbA1c]), TG, 총 콜레스테롤(total cholesterol [TC]), 저밀도 지단백콜레스테롤(low- density lipoprotein cholesterol [LDL-C]), HDL-C 총 8가지 이다. LDL-C는 Friedewald 등15의 간접계산법에 의해 산출되었으며 산출값의 타당성을 위해서 TG가 400을 초과한 인원들은 TG관련 분석에서 제외되었다. 또한 혈압, 고지혈증, 당뇨병 약을 복용하는 사람들도 관련 위험요인 분석에서 제외되었다.
총 8가지 생체지표를 참고로 심혈관질환 위험요인을 고혈압(SBP, DBP), 당뇨(GLU, HbA1c), 이상지질혈증(TG, TC, LDL-C, HDL-C)으로 분류하였다. 고혈압은 대한고혈압학회 2018년 진료지침16에 따라 정상(SBP<120 mm Hg & DBP<80 mm Hg), 주의혈압(120 mm Hg≤SBP<130 mm Hg & DBP<80 mm Hg), 고혈압전단계(130 mm Hg≤SBP<140 mm Hg 또는 80 mm Hg≤DBP<90 mm Hg), 고혈압(140 mm Hg≤SBP 또는 90 mm Hg≤DBP) 네 그룹으로 나누었다. 당뇨는 보건복지부 및 대한의학회17 기준에 따라 정상(GLU<100 mg/dL & HbA1c<5.7%), 당뇨 전 단계(100 mg/dL≤GLU≤125 mg/dL 또는 5.7%≤HbA1c≤6.4%), 당뇨(126 mg/dL≤GLU 또는 6.5%≤HbA1c) 세 그룹으로 나누었고, 이상지질혈증은 보건복지부 및 대한의학회18 기준에 따라 정상(TG<150 mg/dL, TC<200 mg/dL, LDL-C<130 mg/dL, 40 mg/dL≤HDL-C 모두 충족), 이상지질혈증(150 mg/dL≤TG, 200 mg/dL≤TC, 130 mg/dL≤LDL-C, HDL-C<40 mg/dL 중 한 가지만 충족) 두 그룹으로 나누었다.

2. 통계적 방법

연속변인은 평균과 표준오차, 비연속변인은 빈도수와 그룹 내 비율(%)을 통해 자료 형태를 제시하였다. 좌식행동과 심혈관질환 위험요인 사이의 관계는 순서형 로지스틱 회귀분석(ordinal logistic regression)을 통해 모든 공변인이 보정된(adjusted) 모델을 분석하였다. 좌식행동에서는 좌식시간이 가장 낮은 그룹, 좌식정지 횟수가 가장 높은 그룹을 각각 참조(reference) 그룹으로 하였다. 심혈관질환은 고혈압, 당뇨, 이상지질혈증 모두 정상 그룹을 참조그룹으로 하였다. 로지스틱 회귀분석 결과는 승산비(odds ratio [OR])와 95% 신뢰구간(confidence interval [CI])을 제시하여 관계의 유의성을 비교하였다. 또한 좌식행동이 증가하거나 감소함에 따라 심혈관질환 위험요인의 위험정도가 달라지는지 비교하기 위해 P for trend를 분석하였다. 분석과정에 포함된 변인들의 결측 및 분석 제외기준에 해당되는 사례들은 분석대상에서 제외하였다. 가속도계 원자료 처리는 SAS ver. 9.4 (SAS Institute, Cary, NC, USA), 통계분석은 STATA ver.16.0 (StataCorp., College Station, TX, USA)을 이용하였으며 모든 분석에서 유의수준은 p<0.05로 설정하였다.

결 과

공변인에 대한 기술분석은 Table 1에 제시하였다. 심혈관질환 생체지표와 좌식시간 및 좌식정지 횟수에 대한 평균 및 표준오차는 Table 2에 제시하였다. 심혈관질환 생체지표의 평균을 비교했을 때 전반적으로 여성이 남성보다 건강했으며 좌식시간은 여성(499.1분)이 남성(502.9분)에 비해 적었고, 좌식정지 횟수는 여성(95.5회)이 남성(89.6회)에 비해 많았다.
좌식시간 및 좌식정지 횟수와 심혈관질환 위험요인 관계에 대한 로지스틱 회귀분석 결과는 각각 Tables 3과 4에 제시하였다. 각 Table 결과값은 좌식행동 참조그룹에 비해 다른 그룹에 속하는 경우에, 심혈관질환 정상그룹에 비해 위험그룹에 속하게 될 경우가 몇배 되는지를 의미한다.
Table 3에서 좌식시간이 가장 많은 그룹이 가장 적은 그룹에 비해 이상지질혈증 위험이 약 2.5배(95% CI, 1.54–3.94) 높았을 뿐 아니라 2–4번째로 좌식시간이 많은 그룹에서도 이상지질혈증 위험이 유의하게 높았다(OR, 1.8–2.0). 또한, p for trend 분석에서도 좌식시간이 많은 그룹일수록 이상지질혈증 위험이 유의하게 높아지는 경향(p<0.001)을 보였다. 하지만 좌식시간과 고혈압 및 당뇨 사이에서의 유의한 관계는 나타나지 않았다.
좌식정지 횟수는(Table 4) 어떠한 심혈관질환 위험요인과도 유의한 관계를 보이지 않았다. 단, 좌식정지 횟수가 네번째로 많은 그룹이 가장 많은 그룹에 비해 고혈압 위험이 약 0.6배(95% CI, 0.40–0.86) 낮게 나타났다.

고 찰

본 연구에서는 좌식시간이 많은 그룹일수록 심혈관질환 위험요인 중 이상지질혈증의 위험이 유의하게 높아지는 경향을 보였고 고혈압 및 당뇨와는 유의한 관계를 나타내지 않았다. 선행연구 결과와 다르게 좌식정지 횟수와 관련해서는 어떠한 심혈관질환 위험요인과도 유의한 관계가 나타나지 않았다. Table 4에서 좌식정지 횟수와 고혈압과 유의한 관계가 나타났지만 이것은 본 연구 대상자들이 편의 모집되었기 때문에 사회적 또는 생리학적 특성이 편향되었을 가능성이 있다고 본다. 또한 분석에 포함된 공변인이 연구마다 서로 다르고 같은 공변인이더라도 조작적 정의가 다를 수 있는 것도 이유가 될 것이다.
전향적(prospective) 연구들만 수집한 메타분석 연구19에서는 TV 시청시간이 많을수록 심혈관질환 위험이 높아진다고 보고하였다(relative risk, 1.15; 95% CI, 1.06–1.23). 해당 메타분석 연구에 포함된 논문들은 모두 설문지로 TV 시청시간을 측정하였다. TV 시청시간은 설문지와 가속도계가 서로 비슷하게 측정하지만3,20,21 직장에서의 좌식행동과 같은 경우에는 설문지가 가속도계보다 낮게 측정되는 경향이 있다3,22. 한편, 가속도계 측정은 피험자의 기억력에 의존하지 않아도 되며, 설문의 자의적 해석으로 인한 피험자 개입 오류가 적은 편이다. 무엇보다 좌식정지 횟수와 같은 좌식행동은 가속도계와 같은 장비를 통해서만 확인 할 수 있는 것처럼 가속도계 측정결과는 연구자에게 좀 더 많은 정보를 줄 수 있다.
2003년부터 2006년까지 미국 NHANES에서는 가속도계로 좌식행동 및 신체활동을 측정하였다. 이 가속도계 자료를 이용하여 좌식행동(좌식시간, 좌식정지 횟수)과 심혈관질환 관계를 조사한 Healy 등5은 많은 좌식시간과 낮은 HDL-C가 서로 관련 있다고 보고하였다.
Brocklebank 등23은 18세 이상 성인의 좌식행동과 좌식정지 횟수를 심혈관질환 생체지표와 비교한 체계적 문헌고찰 연구를 실시하였다. 해당 논문에서는 가속도계로 측정한 좌식행동 관련 연구들만 종합적으로 분석하였으며, 대부분의 연구에서 높은 좌식행동 및 낮은 좌식정지 횟수가 낮은 HDL-C, 높은 TG와 관련 있다고 보고하였다. 하지만 다른 심혈관질환 생체지표인 GLU, TC, LDL-C와는 유의한 관련이 없었다. 이러한 선행연구들의 결과는 많은 좌식시간과 이상지질혈증 위험 사이에 유의한 관계를 보인 본 연구결과와 유사하다.
한편, 설문지로 좌식시간을 측정한 국내연구에서도 좌식시간과 HDL-C 사이에서 유의한 관계가 있다고 보고하였다6. 뿐만 아니라 많은 좌식시간은 높은 DBP와도 유의한 관계를 보였는데 이유는 명확하지 않다고 하였다6. 설문지로 측정한 좌식행동과 HDL-C와의 유의한 관계는 다른 연구들24,25에서도 일관되게 나타났다. 본 연구 데이터를 활용하여 각 이상지질혈증 결정요인들(TC, TG, HDL-C, LDL-C)과 좌식행동을 비교하였을 때에도 좌식시간이 가장 낮은 그룹에 비해 더 높은 그룹들에서 오직 HDL-C 위험 그룹(40 미만)에 속할 경우만 유의하게 높았다.
위와 같은 결과로 비추어 보았을 때 측정도구와 관계없이 좌식행동과 HDL-C 사이에 유의한 관계가 있다는 것을 알 수 있으며, Brocklebank 등23의 연구를 통해서 좌식행동이 TG와도 유의한 관계가 있음을 확인할 수 있다. 해당 관계의 이유를 언급한 선행연구들3,5,26-28에서는 명확하지 않지만 다음 설명과 같은 생리학적 기전 때문일 것이라고 반복적으로 설명하고 있다. 먼저, 좌식행동은 생리학적으로 근골격 수축이 자주 일어나지 않는 상태이며, 이러한 상태는 혈장 TG와 경구포도당 부하(oral glucose load)의 제거, 지단백질지방 분해효소 활동 및 포도당 자극 인슐린 분비를 줄어들게 한다5,26. 또한 좌식행동이 순환계통에 미치는 직접적인 효과들로 인해 심혈관질환 위험에 영향을 줄 수 있는데, Carter 등3은 좌식 행동이 ankle-brachial index27, 동맥경직28, 경동맥 내중막 두께29에 부정적인 영향을 줄 수 있으며 이러한 기전으로 혈관 기능 및 구조에 손상이 일어날 수 있다고 보고하였다.
본 연구에서 좌식시간이 이상지질혈증과 유의한 관계가 있음을 보이긴 하였지만 몇 가지 제한점이 있다. 먼저, 가속도계를 허리에 착용하였기 때문에 다양한 자세를 인식하지 못하여 발생하는 문제가 있다. 예를 들어, 서있는 상태가 앉아 있는 상태로 잘못 분류되어 좌식행동이 과대 추정되었을 가능성이 크다. 그리고 단면 연구이므로 좌식행동과 심혈관질환 사이의 인과관계를 밝히기에는 제한적이다. 마지막으로 앞서 이야기 하였듯이 미국 NHANES와 달리 연구대상자가 편의 모집되었기 때문에, 한국인의 대표성이 없는 편향된 피험자 특성이 반영되었을 수 있다.
그러나, 1,000명 이상 되는 비교적 많은 한국인들의 좌식행동을 가속도계로 측정하여 심혈관질환과 비교한 연구는 확인한 바로 본 연구가 처음이라는 것에 의미가 있다. 또한 의사 및 연구자들을 비롯한 건강관련전문가들에게 좌식생활 중재의 기초 자료로써 활용될 수 있을 것이다.
공중 보건 관점에서는 건강을 위한 좌식행동을 어느 정도로 제한하는 것이 좋은 것인가에 대한 결론이 필요하다. 실질적으로 정확한 수치를 사람들에게 제공할 필요가 있기 때문이다. 하지만 아직까지 신체활동 권고사항과 같은 구체적인 기준이 좌식생활과 관련해서는 제시되지 않고 있다. 가장 최근 발간된 미국 신체활동 가이드라인30에서는 좌식행동과 건강의 위험성은 중고강도 신체활동에 의존적이기 때문에 좌식행동 기준을 명확히 제시하는것이 어렵다고 하였다. 즉, 좌식행동이 많지만 중고강도 신체활동도 많은 사람은 그렇지 않은 사람에 비해 좌식행동과 관련된 모든 원인에 대한 사망률의 위험이 상대적으로 낮다. 따라서 앞으로는 중고강도 신체활동과 좌식행동을 동시에 고려하여 건강과 비교하는 종단연구가 많이 축적될 필요가 있을 것이다. 그러한 연구를 통해 신체활동과 좌식행동 전체를 종합적으로 고려한 권고사항이 개발될 수 있을 것이다.

Notes

Conflict of Interest

No potential conflict of interest relevant to this article was reported.

Author Contributions

Conceptualization: YK. Writing–original draft: HS. Writing–review & editing: JL, JM.

REFERENCES

1. Statistics Korea. 2018 Annual report on the causes of death statistics [Internet]. Statistics Korea;Daejeon: Available from: http://kosis.kr/publication/publicationThema. do?pubcode=YD. cited 2020 Jul 1.
2. American College of Sports Medicine. 2013. ACSM's guidelines for exercise testing and prescription. Lippincott Williams & Wilkins;Indianapolis (IN):
3. Carter S, Hartman Y, Holder S, Thijssen DH, Hopkins ND. 2017; Sedentary behavior and cardiovascular disease risk: mediating mechanisms. Exerc Sport Sci Rev. 45:80–6. DOI: 10.1249/JES.0000000000000106. PMID: 28118158.
crossref
4. Healy GN, Dunstan DW, Salmon J, Shaw JE, Zimmet PZ, Owen N. 2008; Television time and continuous metabolic risk in physically active adults. Med Sci Sports Exerc. 40:639–45. DOI: 10.1249/MSS.0b013e3181607421. PMID: 18317383.
crossref
5. Healy GN, Matthews CE, Dunstan DW, Winkler EA, Owen N. 2011; Sedentary time and cardio-metabolic biomarkers in US adults: NHANES 2003-06. Eur Heart J. 32:590–7. DOI: 10.1093/eurheartj/ehq451. PMID: 21224291. PMCID: PMC3634159.
crossref
6. Park JH, Joh HK, Lee GS, et al. 2018; Association between sedentary time and cardiovascular risk factors in Korean adults. Korean J Fam Med. 39:29–36. DOI: 10.4082/kjfm.2018.39.1.29. PMID: 29383209. PMCID: PMC5788843.
crossref
7. Korea Centers for Disease Control and Prevention. KNHANES regulation for using of accelerometer raw data Ⅵ (2014-2015) [Internet]. Korea Centers for Disease Control and Prevention;Cheongju: Available from: https://knhanes.cdc.go.kr/knhanes/sub03/sub03_02_02.do. cited 2020 Jul 1.
8. Lee H, Lee M, Choi J, Oh K, Kim Y, Kim S. 2018; KNHANES actigraph raw data processing. Korean J Meas Eval Phys Educ Sport Sci. 20:83–94. DOI: 10.35159/kjss.2018.10.27.5.83.
9. Troiano RP, Berrigan D, Dodd KW, Masse LC, Tilert T, McDowell M. 2008; Physical activity in the United States measured by accelerometer. Med Sci Sports Exerc. 40:181–8. DOI: 10.1249/mss.0b013e31815a51b3. PMID: 18091006.
crossref
10. Atienza AA, Moser RP, Perna F, et al. 2011; Self-reported and objectively measured activity related to biomarkers using NHANES. Med Sci Sports Exerc. 43:815–21. DOI: 10.1249/MSS.0b013e3181fdfc32. PMID: 20962693.
crossref
11. Tucker JM, Welk GJ, Beyler NK, Kim Y. 2016; Associations between physical activity and metabolic syndrome: comparison between self-report and accelerometry. Am J Health Promot. 30:155–62. DOI: 10.4278/ajhp.121127-QUAN-576. PMID: 25806568.
crossref
12. Lee M. 2016. A study of physical activity assessment analytic guidelines of Korean National Health and Nutrition Examination Survey. Korea Centers for Disease Control and Prevention;Cheongju:
13. Korea Centers for Disease Control and Prevention. KNHANES regulation for using of raw data 6th (2013-2015) [Internet]. Korea Centers for Disease Control and Prevention;Cheongju: Available from: https://knhanes.cdc.go.kr/knhanes/sub03/sub03_06_02.do. cited 2020 Jul 1.
14. Healy GN, Dunstan DW, Salmon J, et al. 2008; Breaks in sedentary time: beneficial associations with metabolic risk. Diabetes Care. 31:661–6. DOI: 10.2337/dc07-2046. PMID: 18252901.
crossref
15. Friedewald WT, Levy RI, Fredrickson DS. 1972; Estimation of the concentration of low-density lipoprotein cholesterol in plasma, without use of the preparative ultracentrifuge. Clin Chem. 18:499–502. DOI: 10.1093/clinchem/18.6.499. PMID: 4337382.
crossref
16. The Korean Society of Hypertension. 2018 Hypertension consultation guide 2018 [Internet]. The Korean Society of Hypertension;Seoul: Available from: http://www.koreanhypertension.org/reference/guide?.mode=read&idno=4246. cited 2018.
17. Korea Centers for Disease Control and Prevention, Korean Academy of Medical Sciences. Standard of diabetes [Internet]. Korea Centers for Disease Control and Prevention, Korean Academy of Medical Sciences;Seoul: Available from: health.cdc.go.kr/health/HealthInfoArea/ HealthInfo/View.do?idx=2160&page=1&sortType=viewcount&dept=&category_code=&category=1&searchField=titleAndSummary&searchWord=%EB%8B%B9%EB%87%A8&dateSelect=1&fromDate=&toDate=. cited 2020 Jul 1.
18. Korea Centers for Disease Control and Prevention, Korean Academy of Medical Sciences. Standard of dyslipidemia [Internet]. Korea Centers for Disease Control and Prevention, Korean Academy of Medical Sciences;Seoul: Available from: health.cdc.go.kr/health/HealthInfoArea/ HealthInfo/View.do?idx=160&page=1&sortType=viewcount&dept=&category_code=&category=1&searchField=title&searchWord=%EC%9D%B4%EC%83%81%EC%A7%80%EC%A7%88&dateSelect=1&fromDate=&toDate=#tagID2. cited 2020 Jul 1.
19. Ford ES, Caspersen CJ. 2012; Sedentary behaviour and cardiovascular disease: a review of prospective studies. Int J Epidemiol. 41:1338–53. DOI: 10.1093/ije/dys078. PMID: 22634869. PMCID: PMC4582407.
crossref
20. Clark BK, Sugiyama T, Healy GN, Salmon J, Dunstan DW, Owen N. 2009; Validity and reliability of measures of television viewing time and other non-occupational sedentary behaviour of adults: a review. Obes Rev. 10:7–16. DOI: 10.1111/j.1467-789X.2008.00508.x. PMID: 18631161.
crossref
21. Clark BK, Healy GN, Winkler EA, et al. 2011; Relationship of television time with accelerometer-derived sedentary time: NHANES. Med Sci Sports Exerc. 43:822–8. DOI: 10.1249/MSS.0b013e3182019510. PMID: 20980928.
22. Thorp AA, Healy GN, Winkler E, et al. 2012; Prolonged sedentary time and physical activity in workplace and non-work contexts: a cross-sectional study of office, customer service and call centre employees. Int J Behav Nutr Phys Act. 9:128. DOI: 10.1186/1479-5868-9-128. PMID: 23101767. PMCID: PMC3546308.
crossref
23. Brocklebank LA, Falconer CL, Page AS, Perry R, Cooper AR. 2015; Accelerometer-measured sedentary time and cardiometabolic biomarkers: a systematic review. Prev Med. 76:92–102. DOI: 10.1016/j.ypmed.2015.04.013. PMID: 25913420.
crossref
24. Leon-Latre M, Moreno-Franco B, Andres-Esteban EM, et al. 2014; Sedentary lifestyle and its relation to cardiovascular risk factors, insulin resistance and inflammatory profile. Rev Esp Cardiol (Engl Ed). 67:449–55. DOI: 10.1016/j.rec.2013.10.015. PMID: 24863593.
25. Altenburg TM, Lakerveld J, Bot SD, Nijpels G, Chinapaw MJ. 2014; The prospective relationship between sedentary time and cardiometabolic health in adults at increased cardiometabolic risk: the Hoorn Prevention Study. Int J Behav Nutr Phys Act. 11:90. DOI: 10.1186/s12966-014-0090-3. PMID: 25027974. PMCID: PMC4132212.
crossref
26. Hamilton MT, Hamilton DG, Zderic TW. 2007; Role of low energy expenditure and sitting in obesity, metabolic syndrome, type 2 diabetes, and cardiovascular disease. Diabetes. 56:2655–67. DOI: 10.2337/db07-0882. PMID: 17827399.
crossref
27. Parsons TJ, Sartini C, Ellins EA, et al. 2016; Objectively measured physical activity and sedentary behaviour and ankle brachial index: cross-sectional and longitudinal associations in older men. Atherosclerosis. 247:28–34. DOI: 10.1016/j.atherosclerosis.2016.01.038. PMID: 26854973. PMCID: PMC4819952.
crossref
28. Huynh QL, Blizzard CL, Sharman JE, Magnussen CG, Dwyer T, Venn AJ. 2014; The cross-sectional association of sitting time with carotid artery stiffness in young adults. BMJ Open. 4:e004384. DOI: 10.1136/bmjopen-2013-004384. PMID: 24604484. PMCID: PMC3948580.
crossref
29. Kozakova M, Palombo C, Morizzo C, et al. 2010; Effect of sedentary behaviour and vigorous physical activity on segment-specific carotid wall thickness and its progression in a healthy population. Eur Heart J. 31:1511–9. DOI: 10.1093/eurheartj/ehq092. PMID: 20400760.
crossref
30. U.S. Deparment of Health and Human Services. Physical activity guidelines for Americans 2018 [Internet]. U.S. Deparment of Health and Human Services;Washington (DC): Available from: https://health.gov/paguidelines/second- edition/pdf/Physical_Activity_Guidelines_2nd_edition.pdf. cited 2018.

Fig. 1
Flow diagram of participants excluded.
KJSM-38-143-f1.tif
Table 1
Descriptive of covariates
Variable Male Female


n (%) Mean±SE n (%) Mean±SE
Age (yr)
19−29 77 (15.1) 129 (14.4)
30−39 103 (20.2) 170 (18.9)
40−49 126 (24.8) 240 (26.7)
50−59 139 (27.3) 263 (29.3)
≥60 64 (12.6) 96 (10.7)
EDU
<Elementary school 35 (6.9) 82 (9.2)
<Middle school 45 (8.9) 94 (10.5)
<High school 200 (39.4) 362 (40.6)
>Undergraduate 228 (44.9) 353 (39.6)
Alcohol*
No 143 (28.3) 495 (55.2)
Yes 362 (71.7) 402 (44.8)
Smoking
No 324 (69.1) 864 (96.3)
Yes 133 (30.9) 33 (3.7)
Income
Low 27 (5.3) 70 (7.8)
Mid–low 125 (24.6) 229 (25.6)
Mid–high 169 (33.2) 305 (34.0)
High 188 (36.9) 292 (32.6)
Body mass index (kg/m2) 509 24.6±0.14 897 23.2±0.11
Calorie intake (kcal/day) 480 2,583.1±46.89 869 1,849.4±25.48
MVPA (min/wk) 509 244±8.27 898 191±4.95
Wear time (hr/day) 509 14.1±0.07 898 14.0±0.05

SE: standard error, EDU: educational status, MVPA: moderate to vigorous physical activity.

*No (never drunk or less than one glass a month), yes (more than one glass a month); No (never smoked or past smoker), yes (current smoker).

Table 2
Descriptive of CVD biomarkers and sedentary behavior
Variable Male Female


n Mean±SE n Mean±SE
CVD biomarker
SBP (mm Hg) 505 118.5±0.61 895 112.2±0.50
DBP (mm Hg) 505 78.6±0.45 895 72.9±0.31
GLU (mg/dL) 497 100.6±1.01 874 95.8±0.71
HbA1c (%) 496 5.7±0.04 872 5.6±0.02
TG (mg/dL) 496 154.6±5.36 874 108.0±2.76
TC (mg/dL) 496 190.9±1.56 874 189.7±1.16
LDL-C (mg/dL) 496 112.5±1.48 874 113.0±1.03
HDL-C (mg/dL) 496 47.5±0.51 874 55.1±0.42
Sedentary behavior
Time (min/day) 509 502.9±5.06 898 499.1±3.23
Break (n/day) 509 89.6±0.85 898 95.5±0.56

CVD: cardiovascular disease, SE: standard error, SBP: systolic blood pressure, DBP: diastolic blood pressure, GLU: glucose, HbA1c: glycated hemoglobin, TG: triglyceride, TC: total cholesterol, LDL-C: low-density lipoprotein cholesterol, HDL-C: high-density lipoprotein cholesterol.

Table 3
Logistic regression of sedentary time on CVD risk groups
CVD risk Quintiles of sedentary time (min−max) p for trend

Lowest 2nd 3rd 4th Highest
(144.9−419.3) (419.8−451.2) (476.7−529.6) (529.9−581.6) (581.7−959.2)
HTN Reference 1.42 1.12 1.23 1.16 0.760
(0.99−2.01) (0.77−1.63) (0.84−1.82) (0.75−1.79)
DM Reference 1.03 0.95 0.82 1.06 0.785
(0.71−1.49) (0.64−1.39) (0.54−1.24) (0.68−1.67)
DLP Reference 1.80* 1.99* 2.03* 2.47* <0.000
(1.22−2.65) (1.33−2.97) (1.33−3.08) (1.54−3.94)

Covariates: sex, age, educational status, alcohol drinking, smoking, economic status, BMI, calorie intake, physical activity, accelerometer wear time.

CVD: cardiovascular disease, HTN: hypertension, DM: diabetes mellitus, DLP: dyslipidemia.

*Statistically significant.

Table 4
Logistic regression of sedentary break on CVD risk groups
CVD risk Quintiles of sedentary break (min–max) p for trend

Highest (108.2−152.6) 4th (98.0−108.2) 3rd (88.0−98.0) 2nd (77.7−88.0) Lowest (41.0−77.7)
HTN Reference 0.59* 0.87 0.85 0.74 0.730
(0.40−0.86) (0.60−1.27) (0.57−1.27) (0.48−1.15)
DM Reference 1.26 1.41 1.24 0.97 0.857
(0.86−1.85) (0.95−2.11) (0.81−1.90) (0.61−1.55)
DLP Reference 1.25 1.14 1.13 1.03 0.888
(0.85−1.85) (0.76−1.71) (0.73−1.73) (0.65−1.64)

Covariates: sex, age, educational status, alcohol drinking, smoking, economic status, body mass index, calorie intake, physical activity, accelerometer wear time.

CVD: cardiovascular disease, HTN: hypertension, DM: diabetes mellitus, DLP: dyslipidemia.

*Statistically significant.

TOOLS
Similar articles