Journal List > Nutr Res Pract > v.14(4) > 1145130

Jo, Oh, Singh, Park, and Shin: Impact of dietary risk factors on cardiometabolic and cancer mortality burden among Korean adults: results from nationally representative repeated cross-sectional surveys 1998–2016

Abstract

BACKGROUND/OBJECTIVES

Dietary factors are important contributors to cardiometabolic and cancer mortality. We examined the secular trends of nine dietary factors (fruits, vegetables, whole grains, nuts and seeds, milk, red meat, processed meat, sugar-sweetened beverages, and calcium) and the associated burdens of cardiometabolic and cancer mortality in Korea using representative cross-sectional survey data from 1998 to 2016.

SUBJECTS/METHODS

Using dietary data from Korean adults aged ≥ 25 years in the Korea National Health and Nutrition Examination Survey (KNHANES), we characterized secular trends in intake levels. We performed comparative risk assessment to estimate the population attributable fraction and the number of cardiometabolic and cancer deaths attributable to each dietary factor.

RESULTS

A total of 231,148 cardiometabolic and cancer deaths were attributable to nine dietary risk factors in Korea from 1998 to 2016. Suboptimal intakes of fruits and whole grains were the leading contributors. Although the intakes of fruits, vegetables, and whole grains moderately improved over time, the intake levels in 2016 (192.1 g/d, 225.6 g/d, and 10.9 g/d, respectively) remained far below the optimal levels. Deaths attributable to the low intakes of nuts and seeds (4.5 g/d), calcium (440.5 mg/d), and milk (37.1 g/d) and the high intakes of red meat (54.7 g/d), processed meat (4.7 g/d), and sugar-sweetened beverages (33.0 g/d) increased since 1998. Compared with older age groups (≥ 45 years), more unfavorable changes in dietary patterns were observed in the younger population aged 25–44 years, including more sharply increased intakes of processed meat.

CONCLUSIONS

We observed improvement in the intakes of fruits, vegetables, and whole grains and unfavorable changes in the intakes of processed meat and sugar-sweetened beverages over the past few decades. Our data suggest that to reduce the chronic disease burden in Korea, more effective nutritional policies and interventions are needed to target these dietary risk factors.

INTRODUCTION

Chronic diseases, including cardiometabolic disease (cardiovascular disease and diabetes mellitus) and cancer, are major causes of morbidity and mortality worldwide [1]. It is estimated that 25.4 million deaths, equivalent to 46% of all-cause mortality, in the world population occur annually due to cardiometabolic disease and cancer [2]. Over the past several decades, the prevalence of cardiometabolic disease and cancer has increased in all parts of the world, including countries with traditionally low prevalence, partially due to economic development and westernized lifestyles. Some countries, including Korea, have experienced extremely rapid economic development and dramatic shift in lifestyles. In these countries, the distribution and associated burden of diseases have also shifted from communicable to noncommunicable diseases. For example, in Korea, cardiometabolic disease and cancer contributed to 149,924 deaths (53% of all deaths) in 2016 [3], an increase of 25% since 1998.
Among the risk factors for cardiometabolic diseases and cancer, dietary factors, such as suboptimal intakes of fruits, vegetables, nuts and seeds, and whole grains, have been reported to substantially contribute to the burden of cardiometabolic disease and cancer [45]. A previous global burden of diseases (GBD) Study reported that eight of the top 20 risk factors for lost global disability-adjusted life-years (DALYs) were dietary factors [6]. Other studies [78910], using the comparative risk assessment (CRA) method, have also highlighted the impact of dietary risk factors on mortality from chronic disease by quantifying the country- and regional-specific disease burdens attributable to individual dietary factors. CRA is a useful tool for estimating the disease burden attributable to specific factors and synthesizing evidence that informs policy priorities [11]. However, most CRA studies to date have been conducted in European populations [12], and there is limited information from Asian populations, which have undergone substantial changes in dietary patterns over the past decades. A recent study from China [13] reported moderate improvements in consumption of refined grains, fruits, and nuts and seeds and unfavorable changes in consumption of processed meat and sugar-sweetened beverages from 1982 to 2012, suggesting a shift in nutrition intervention and policy priorities for chronic disease prevention over time in China. We previously reported the associations between six dietary factors (fruits, vegetables, whole grains, processed meat, red meat, and sodium) and the burden of cardiometabolic disease mortality from 1998 to 2011 in Korea [14]. In that study, high intake of sodium and low intakes of fruits and whole grains were found to be responsible for the highest number of deaths from cardiometabolic diseases during the study period [14]. Extending earlier studies [1415], the present study examined the impact of nine dietary risk factors (fruits, vegetables, whole grains, processed meat, red meat, nuts and seeds, milk, sugar-sweetened beverages, and calcium), individually and collectively, on the burden of cardiometabolic disease and cancer mortality among Korean adults using nationally representative, repeated cross-sectional survey data from 1998 to 2016. This study differs from the previous reports [1415] by extending the CRA analysis to more comprehensively examine the secular trends of nine dietary factors over a longer period. We also quantified the mortality from cancer, as well as cardiometabolic diseases, attributable to nine selected dietary factors to provide evidence to inform nutritional policy priorities and identify the principal drivers of the burden.

SUBJECTS AND METHODS

We performed a population-level CRA analysis to evaluate the contribution of nine dietary risk factors to the burden of cardiometabolic disease and cancer mortality among Korean adults aged 25 years and older. Detailed descriptions of the CRA methodology have been presented previously [11]. For each of the individual dietary risk factors, we estimated the number and proportion of cardiometabolic and cancer deaths that would have been avoided during the period of analysis if the observed distribution of intake levels had been changed to a hypothetical alternative distribution, called the theoretical minimum-risk exposure distribution (TMRED).

Data sources

For this analysis, we obtained the following information: the intake levels of nine dietary risk factors from the Korea National Health and Nutrition Examination Survey (KNHANES) 1998, 2001, 2007–2016; the TMREDs of dietary factors from previous GBD studies [16]; estimates of the relative risk (RR) for the dietary risk factors and disease relationships from previous meta-analyses [1718]; and the number of disease-specific deaths from the Korean Statistical Information Service (KOSIS), as detailed below.

Intake levels of dietary risk factors

We selected the following nine dietary factors (eight food groups and one nutrient) with probable or convincing evidence for their relationships with cardiovascular disease, diabetes mellitus, and cancer: low intakes of fruits, vegetables, whole grains, nuts and seeds, milk, and calcium and high intakes of unprocessed meat, red meat, processed meat, and sugar-sweetened beverages. We obtained information on the intake levels of the nine dietary factors from KNHANES. The details of KNHANES are described elsewhere [19]. Briefly, KNHANES is a nationally representative cross-sectional survey conducted by the Korea Centers for Disease Control and Prevention and the Ministry of Health and Welfare in 1998, 2001, 2005, and annually since 2007. All subjects included in the survey were selected using a stratified multistage clustered probability sampling design based on geographic area. All surveys collected comparable data using similar designs and sampling methods. Dietary information was assessed by single-day 24-hour recall and semiquantitative food frequency questionnaire (FFQ) (using a 63-item questionnaire before 2012 and a 112-item questionnaire since 2012), which were quantified using the Korea Food Composition Table. To examine temporal trends in dietary intakes across years, we used all KNHANES data collected to date (1998–2016) except the third KNHANES data (2005) which included extreme outliers. Because the same FFQ was not consistently used across the study period and the assessment was limited to population aged < 65 years, we used data from 24-hour recall in our primary analysis. Further, 24-hour recall may be better than the FFQ at estimating absolute intake levels of a large population. We used FFQ data only in the sensitivity analysis. We limited our analysis to participants who completed the nutrition survey. We excluded data from participants with implausible intake values of total energy (< 500 kcal or > 5,000 kcal per day) and of individual dietary factors (intake levels ± 3 standard deviation from the mean). We also excluded data from participants who reported consuming rice less than once per day, as this was considered implausible for Korean adults. The Institutional Review Board of the Korea Center for Disease Control and Prevention reviewed and approved the data of KNHANES (2007-02CON-04-P, 2008-04EXP-01-C, 2009-01COM-03-2C, 2010-02CON-21-C, 2011-02CON-06-C, 2012-01EXP-01-2C, 2013-07CON-03-4C, and 2013-12EXP-03-5C).

Counterfactual distribution of dietary risk factors

The TMRED values for each dietary factor were defined as the recommended intake levels at which they would yield the greatest beneficial effects or be associated with the lowest level of harm based on previous CRA studies (Table 1) [16].
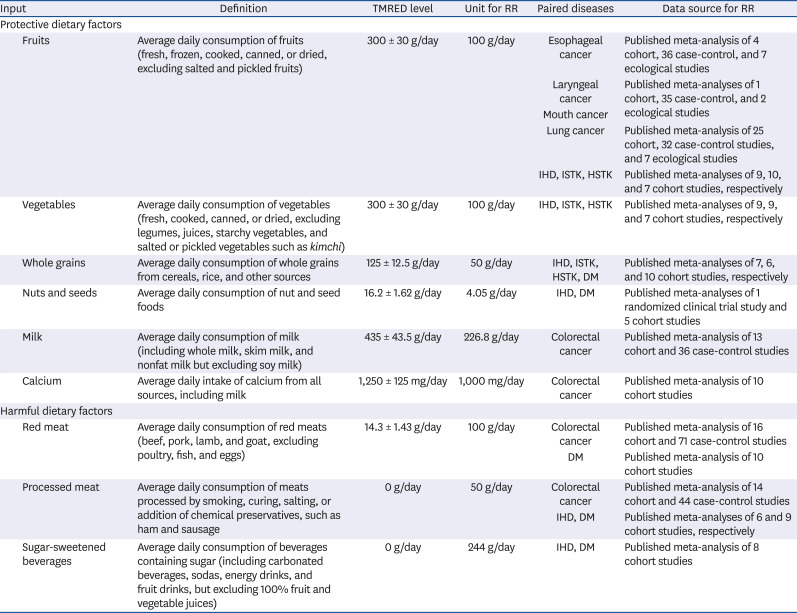
Table 1

Data sources and descriptions of dietary factors, optimal intake levels, and associations with paired diseases

nrp-14-384-i001
Input Definition TMRED level Unit for RR Paired diseases Data source for RR
Protective dietary factors
Fruits Average daily consumption of fruits (fresh, frozen, cooked, canned, or dried, excluding salted and pickled fruits) 300 ± 30 g/day 100 g/day Esophageal cancer Published meta-analysis of 4 cohort, 36 case-control, and 7 ecological studies
Laryngeal cancer Published meta-analyses of 1 cohort, 35 case-control, and 2 ecological studies
Mouth cancer
Lung cancer Published meta-analysis of 25 cohort, 32 case-control studies, and 7 ecological studies
IHD, ISTK, HSTK Published meta-analyses of 9, 10, and 7 cohort studies, respectively
Vegetables Average daily consumption of vegetables (fresh, cooked, canned, or dried, excluding legumes, juices, starchy vegetables, and salted or pickled vegetables such as kimchi) 300 ± 30 g/day 100 g/day IHD, ISTK, HSTK Published meta-analyses of 9, 9, and 7 cohort studies, respectively
Whole grains Average daily consumption of whole grains from cereals, rice, and other sources 125 ± 12.5 g/day 50 g/day IHD, ISTK, HSTK, DM Published meta-analyses of 7, 6, and 10 cohort studies, respectively
Nuts and seeds Average daily consumption of nut and seed foods 16.2 ± 1.62 g/day 4.05 g/day IHD, DM Published meta-analyses of 1 randomized clinical trial study and 5 cohort studies
Milk Average daily consumption of milk (including whole milk, skim milk, and nonfat milk but excluding soy milk) 435 ± 43.5 g/day 226.8 g/day Colorectal cancer Published meta-analysis of 13 cohort and 36 case-control studies
Calcium Average daily intake of calcium from all sources, including milk 1,250 ± 125 mg/day 1,000 mg/day Colorectal cancer Published meta-analysis of 10 cohort studies
Harmful dietary factors
Red meat Average daily consumption of red meats (beef, pork, lamb, and goat, excluding poultry, fish, and eggs) 14.3 ± 1.43 g/day 100 g/day Colorectal cancer Published meta-analysis of 16 cohort and 71 case-control studies
DM Published meta-analysis of 10 cohort studies
Processed meat Average daily consumption of meats processed by smoking, curing, salting, or addition of chemical preservatives, such as ham and sausage 0 g/day 50 g/day Colorectal cancer Published meta-analysis of 14 cohort and 44 case-control studies
IHD, DM Published meta-analyses of 6 and 9 cohort studies, respectively
Sugar-sweetened beverages Average daily consumption of beverages containing sugar (including carbonated beverages, sodas, energy drinks, and fruit drinks, but excluding 100% fruit and vegetable juices) 0 g/day 244 g/day IHD, DM Published meta-analysis of 8 cohort studies
TMRED, theoretical minimum-risk exposure distribution; RR, relative risk; IHD, ischemic heart disease; ISTK, ischemic stroke; HSTK, hemorrhagic stroke; DM, diabetes mellitus.

Relationships between risk factors and disease

The disease outcomes included in this study were ischemic heart disease (IHD), ischemic stroke (ISTK), hemorrhagic stroke (HSTK), diabetes mellitus, and cancers (including gastrointestinal and respiratory tract cancer, mouth cancer, esophageal cancer, stomach cancer, colorectal cancer, laryngeal cancer, and lung cancer) that are known to be related to diet. The RR estimates were obtained from published systematic reviews, meta-analyses of randomized controlled trials, and observational studies [182021]. Details of the data sources are provided in Table 1.

Disease-specific deaths

Cause-specific mortality counts were extracted from the KOSIS, which provides official statistics on mortality from 236 causes for both sex in 5-year age groups for each year. The causes of mortality were coded according to the International Classification of Disease (ICD), 10th revision. In the present study, we limited the analysis to data on deaths from diabetes mellitus (E10–E14), IHD (I20–I25), ISTK (I63 and I67), HSTK (I60–I62), mouth cancer (C00–C14), esophageal cancer (C15), stomach cancer (C16), colorectal cancer (C18), laryngeal cancer (C32), and lung cancer (C34).

Statistical analyses

To evaluate secular trends in consumption levels of dietary factors, we calculated the mean and standard deviation of the consumption of each dietary factor according to sex, age, and year after applying sampling weights and adjusting for total energy intake using the residual method. Assuming that the effect size estimates (RRs) for each risk factor reflect causal relationships with cardiometabolic and cancer mortality in the study population, we also estimated the expected proportional reductions in mortality in the population by calculating the population attributable fraction (PAF) for each dietary risk factor using the following equation:
PAF=x=0mRRxPxdxx=0mRRxPxdxx=0mRRxPxdxnrp-14-384-e001.jpg
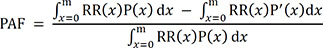
where x is the level of exposure, m is the maximum exposure level, P(x) represents the observed age- and sex-specific population distribution of the exposure, P′(x) is the counterfactual or optimal distribution of the exposure, and RR(x) is the age- and sex-specific RR of the mortality or incidence at exposure level x. The PAF for the combined dietary factors was derived from each PAF using the following equation [13]: combinedPAF=1r=1R(1PAFr), where r is each individual dietary factor and R is the number of dietary factors. To estimate the number of disease-specific deaths attributable to risk factors, PAFs computed as above were multiplied by the number of disease-specific deaths. All analyses were conducted separately by sex and age groups (25–34, 35–44, 45–54, 55–64, 65–74, and ≥ 75 years) from 1998 to 2016. We then aggregated the age- and sex-specific values to estimate the total number of deaths attributable to dietary risk factors. To assess the uncertainty for the attributable deaths, we applied a Monte Carlo simulation to each risk factor. We iterated this simulation procedure 1000 times for each risk factor and finally generated 1,000 mortality estimates for each sex and age group. We then derived the mean and 95% uncertainty intervals (UIs) bounded by the 2.5th and 97.5th percentiles of the 1000 iteration values. To assess the trend of temporal changes across the years, Cuzick's nonparametric trend test was used [22]. All statistical analyses were performed with STATA, version 13.0 (StataCorp, College Station, TX, USA) and R software, version 3.5.1 (http://www.R-project.org).

Sensitivity analysis

Recognizing the differences in the intake levels of dietary factors assessed by two dietary assessment methods (FFQ and 24-hour recall), we performed sensitivity analyses that repeated the CRA analysis using the data from semiquantitative FFQs from 2012 to 2016, which included 112 items in which the subjects were asked to report how often they consumed each food item during the past 12 months on a nine-point scale (3 times per day, twice per day, once per day, 5 or 6 times per week, 2 to 4 times per week, once per week, 2 or 3 times per month, once per month, less than once per year, or almost never). The responses were converted into daily consumption amounts by multiplying by the serving sizes provided by the Korea Rural Development Administration (KRDA) guideline [23]. Because FFQs were conducted only in participants aged < 65 years, we compared the two survey methods among participants aged 25 to 64 years. To increase the comparability, we restricted the comparisons to food items that were assessed by both methods.

RESULTS

Secular trends in intake levels of dietary risk factors across years

As shown in Table 2, the intake levels of all dietary factors evaluated increased from 1998 to 2016, except for calcium. In particular, among protective dietary factors, the level of dietary intake increased by 165% for nuts and seeds (4.5 vs. 1.7 g/d) and 91% for whole grains (10.9 vs. 5.7 g/d). However, the intakes of these items remained far below the TMREDs (16.2 g/d for nuts and seeds and 125 g/d for whole grains). The intake level of fruits slightly decreased from 1998 to 2008 (140.0 vs. 164.2 g/d) but increased after 2008 (192.1 vs. 140.0 g/d). Among harmful dietary factors, the intake levels of processed meat and sugar-sweetened beverages increased the most during the same time period. Overall, there were no sex-specific differences in the distribution of dietary intakes. When we compared intakes by age group, more unfavorable changes were generally observed in the youngest age group (25–44 years) than in the older age groups (45–64 and ≥ 65 years). The intakes of protective factors such as fruits, vegetables, and calcium decreased in the youngest age group and increased in other age groups. Processed meat intake increased more dramatically in the youngest age group than in older age groups.
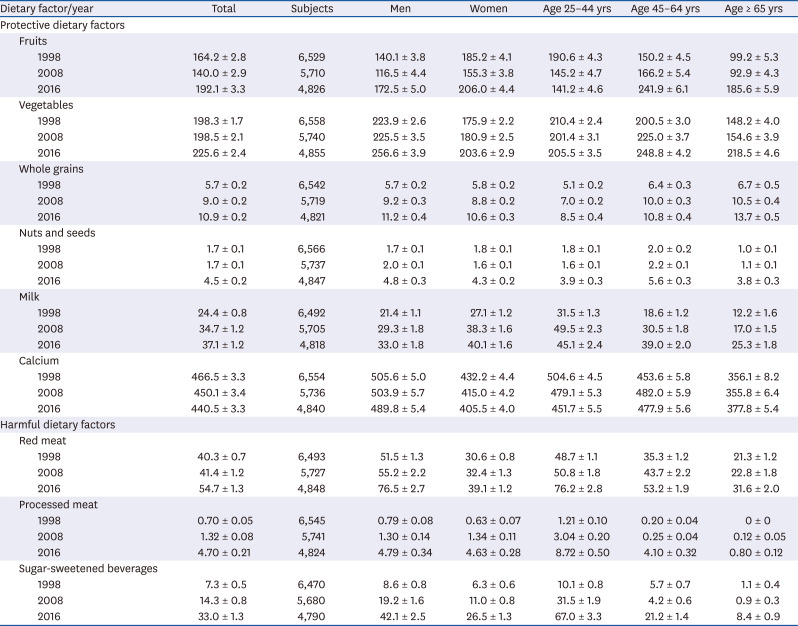
Table 2

Mean and standard error of intake levels of nine individual dietary factors according to sex and age in 1998, 2008, and 2016

nrp-14-384-i002
Dietary factor/year Total Subjects Men Women Age 25–44 yrs Age 45–64 yrs Age ≥ 65 yrs
Protective dietary factors
Fruits
1998 164.2 ± 2.8 6,529 140.1 ± 3.8 185.2 ± 4.1 190.6 ± 4.3 150.2 ± 4.5 99.2 ± 5.3
2008 140.0 ± 2.9 5,710 116.5 ± 4.4 155.3 ± 3.8 145.2 ± 4.7 166.2 ± 5.4 92.9 ± 4.3
2016 192.1 ± 3.3 4,826 172.5 ± 5.0 206.0 ± 4.4 141.2 ± 4.6 241.9 ± 6.1 185.6 ± 5.9
Vegetables
1998 198.3 ± 1.7 6,558 223.9 ± 2.6 175.9 ± 2.2 210.4 ± 2.4 200.5 ± 3.0 148.2 ± 4.0
2008 198.5 ± 2.1 5,740 225.5 ± 3.5 180.9 ± 2.5 201.4 ± 3.1 225.0 ± 3.7 154.6 ± 3.9
2016 225.6 ± 2.4 4,855 256.6 ± 3.9 203.6 ± 2.9 205.5 ± 3.5 248.8 ± 4.2 218.5 ± 4.6
Whole grains
1998 5.7 ± 0.2 6,542 5.7 ± 0.2 5.8 ± 0.2 5.1 ± 0.2 6.4 ± 0.3 6.7 ± 0.5
2008 9.0 ± 0.2 5,719 9.2 ± 0.3 8.8 ± 0.2 7.0 ± 0.2 10.0 ± 0.3 10.5 ± 0.4
2016 10.9 ± 0.2 4,821 11.2 ± 0.4 10.6 ± 0.3 8.5 ± 0.4 10.8 ± 0.4 13.7 ± 0.5
Nuts and seeds
1998 1.7 ± 0.1 6,566 1.7 ± 0.1 1.8 ± 0.1 1.8 ± 0.1 2.0 ± 0.2 1.0 ± 0.1
2008 1.7 ± 0.1 5,737 2.0 ± 0.1 1.6 ± 0.1 1.6 ± 0.1 2.2 ± 0.1 1.1 ± 0.1
2016 4.5 ± 0.2 4,847 4.8 ± 0.3 4.3 ± 0.2 3.9 ± 0.3 5.6 ± 0.3 3.8 ± 0.3
Milk
1998 24.4 ± 0.8 6,492 21.4 ± 1.1 27.1 ± 1.2 31.5 ± 1.3 18.6 ± 1.2 12.2 ± 1.6
2008 34.7 ± 1.2 5,705 29.3 ± 1.8 38.3 ± 1.6 49.5 ± 2.3 30.5 ± 1.8 17.0 ± 1.5
2016 37.1 ± 1.2 4,818 33.0 ± 1.8 40.1 ± 1.6 45.1 ± 2.4 39.0 ± 2.0 25.3 ± 1.8
Calcium
1998 466.5 ± 3.3 6,554 505.6 ± 5.0 432.2 ± 4.4 504.6 ± 4.5 453.6 ± 5.8 356.1 ± 8.2
2008 450.1 ± 3.4 5,736 503.9 ± 5.7 415.0 ± 4.2 479.1 ± 5.3 482.0 ± 5.9 355.8 ± 6.4
2016 440.5 ± 3.3 4,840 489.8 ± 5.4 405.5 ± 4.0 451.7 ± 5.5 477.9 ± 5.6 377.8 ± 5.4
Harmful dietary factors
Red meat
1998 40.3 ± 0.7 6,493 51.5 ± 1.3 30.6 ± 0.8 48.7 ± 1.1 35.3 ± 1.2 21.3 ± 1.2
2008 41.4 ± 1.2 5,727 55.2 ± 2.2 32.4 ± 1.3 50.8 ± 1.8 43.7 ± 2.2 22.8 ± 1.8
2016 54.7 ± 1.3 4,848 76.5 ± 2.7 39.1 ± 1.2 76.2 ± 2.8 53.2 ± 1.9 31.6 ± 2.0
Processed meat
1998 0.70 ± 0.05 6,545 0.79 ± 0.08 0.63 ± 0.07 1.21 ± 0.10 0.20 ± 0.04 0 ± 0
2008 1.32 ± 0.08 5,741 1.30 ± 0.14 1.34 ± 0.11 3.04 ± 0.20 0.25 ± 0.04 0.12 ± 0.05
2016 4.70 ± 0.21 4,824 4.79 ± 0.34 4.63 ± 0.28 8.72 ± 0.50 4.10 ± 0.32 0.80 ± 0.12
Sugar-sweetened beverages
1998 7.3 ± 0.5 6,470 8.6 ± 0.8 6.3 ± 0.6 10.1 ± 0.8 5.7 ± 0.7 1.1 ± 0.4
2008 14.3 ± 0.8 5,680 19.2 ± 1.6 11.0 ± 0.8 31.5 ± 1.9 4.2 ± 0.6 0.9 ± 0.3
2016 33.0 ± 1.3 4,790 42.1 ± 2.5 26.5 ± 1.3 67.0 ± 3.3 21.2 ± 1.4 8.4 ± 0.9
Values for mean intake levels and corresponding standard errors were combined across sex and/or age groups.

Secular trends in cardiometabolic and cancer mortality by age, sex, and year (data not shown)

The number of deaths related to chronic disease (for a total of 738,209 deaths from 1998 to 2016: 435,219 in men and 302,990 in women), including IHD (156,457 deaths: 83,660 in men and 72,797 in women), stroke (186,521 deaths: 96,511 in men and 90,010 in women), diabetes mellitus (126,920 deaths: 63,927 in men and 62,993 in women), and cancer (268,311 deaths: 191,121 in men and 77,190 in women), increased by 34% (16,309 deaths) from 1998 to 2016. A substantial increase in IHD mortality (14,646 vs. 7,601 deaths) was the major cause of an exceptionally high rate of nonaccidental deaths during the study period. Women had a much greater proportional increase in IHD mortality than men (115% vs. 77%). The total number of nonaccidental deaths declined among adults aged < 65 years (14,583 vs. 19,114 deaths) and increased among those aged ≥ 65 years (49,728 vs. 28,888 deaths).

Population attributable fractions and absolute attributable deaths according to dietary factors by year

During the period of analysis, low intakes of fruits and whole grains consistently ranked as the top dietary contributors to the cardiometabolic and cancer mortality burden in Korea (Fig. 1). Although the contribution of fruit intake was reduced after 2008 (P for trend = 0.003), suboptimal intake of fruits remained the largest contributor in 2016, accounting for 7,067 attributable cardiometabolic disease and cancer deaths (95% UI = 6,180.2–7,940.4) in total. Fruit intake was followed by intakes of whole grains and vegetables, which accounted for 4,372 (95% UI = 3,456.2–5,284.9) and 2,338 deaths attributable to cardiometabolic disease and cancer (95% UI = 1,875.6–2,821.5), respectively. Whereas deaths attributable to suboptimal intakes of fruits, whole grains, and vegetables showed overall decreasing trends, deaths attributable to other factors (nuts and seeds, calcium, milk, red meat, processed meat, and sugar-sweetened beverages) increased during the study period. The PAFs generally showed similar patterns for the number of deaths related to dietary risks, except for calcium and milk intakes. During the period of analysis, calcium and milk intakes showed little change in PAFs, but the number of deaths attributable to low calcium and milk intakes increased. The total numbers of deaths attributable to an overall suboptimal diet were 17,849, 20,904, and 17,557 in 1998, 2008, and 2016, representing PAFs of 37%, 34%, and 27%, respectively.
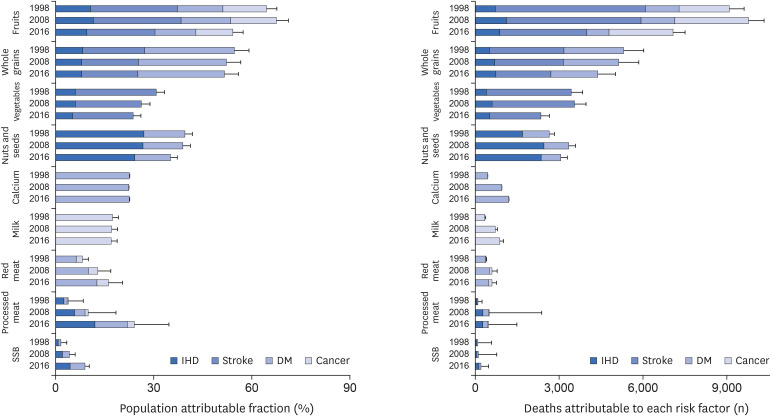
Fig. 1

Population attributable fractions and attributable cardiometabolic and cancer deaths by individual dietary risk factors in 1998, 2008, and 2016.

The error bars represent the standard deviations of the number of deaths from each risk factor. The error bar for the standard deviation of the estimate derived from the low intake of calcium is not visible.
IHD, ischemic heart disease; DM, diabetes mellitus; SSB, sugar-sweetened beverages.
nrp-14-384-g001

Stratification by sex, age, and disease

Although the absolute and proportional cardiometabolic and cancer mortality associated with individual dietary factors did not differ between men and women, the patterns varied by age group (Fig. 2, Supplementary Table 1). For all individual dietary factors and for all diseases, younger populations tended to have greater PAFs associated with suboptimal consumption (Fig. 2). For processed meat and sugar-sweetened beverages, the PAF gaps among the age groups gradually widened over the years. In particular, the PAFs for processed meat intake associated with IHD, diabetes mellitus, and colorectal cancer in the youngest age group (25–34 years) rapidly increased from 13.0% in 1998 to 43.8% in 2016 (P for trend = 0.002) and were much higher than those for older age groups.
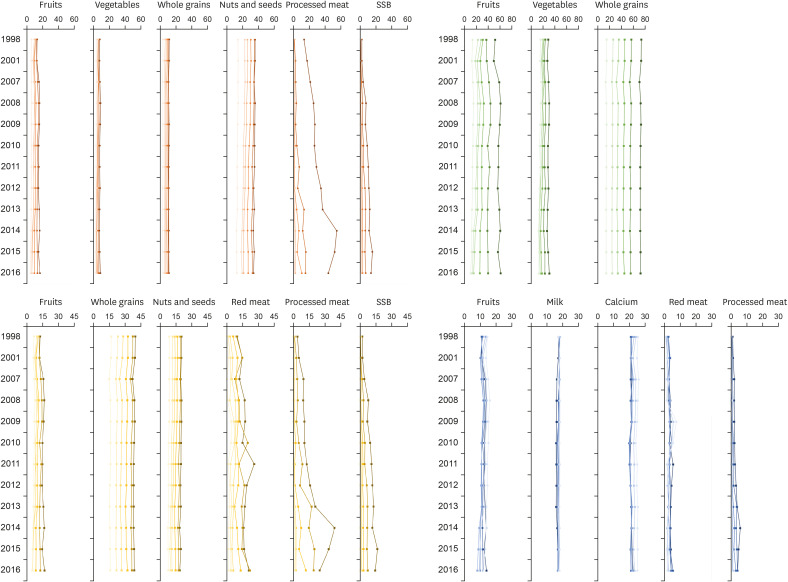
Fig. 2

Population attributable fractions of the individual risk factors across years stratified by age group.

The estimated population attributable fractions of each risk factor to its related diseases were divided into six groups by age: 25–34 years, 35–44 years, 45–54 years, 55–64 years, 65–74 years, and 75 years and older. Darker colors indicate younger age groups. Orange lines indicate ischemic heart disease, green lines stroke, yellow lines diabetes mellitus, and blue lines cancer.
SSB, sugar-sweetened beverages.
nrp-14-384-g002
However, because the baseline number of deaths is higher in the older age groups, the absolute number of attributable deaths was greater in the older age groups (Supplementary Table 1). Among the population aged 25 to 44 years, the number of attributable deaths increased for fruit intake and decreased for intakes of milk and red meat over the years. However, in the older age groups, changes in the opposite direction were observed. Further, the number of deaths from low intakes of whole grains and nuts and seeds increased only in the population aged ≥ 65 years.

Comparison of two dietary assessment methods

For whole grains and milk, we observed similar results from the two dietary assessment methods (24-hour recall and FFQ) (Fig. 3). For vegetables, nuts and seeds, processed meat, and sugar-sweetened beverages, we observed similar results when comparisons were made with restriction to food items presented in both methods. However, for red meat intake in all years and fruit intake in recent years, the results from 24-hour recall data were markedly different from those from the FFQ. Compared with the results from the FFQ, PAFs and attributable deaths estimated from 24-hour recall data tended to be lower for protective dietary factors but higher for harmful dietary factors.
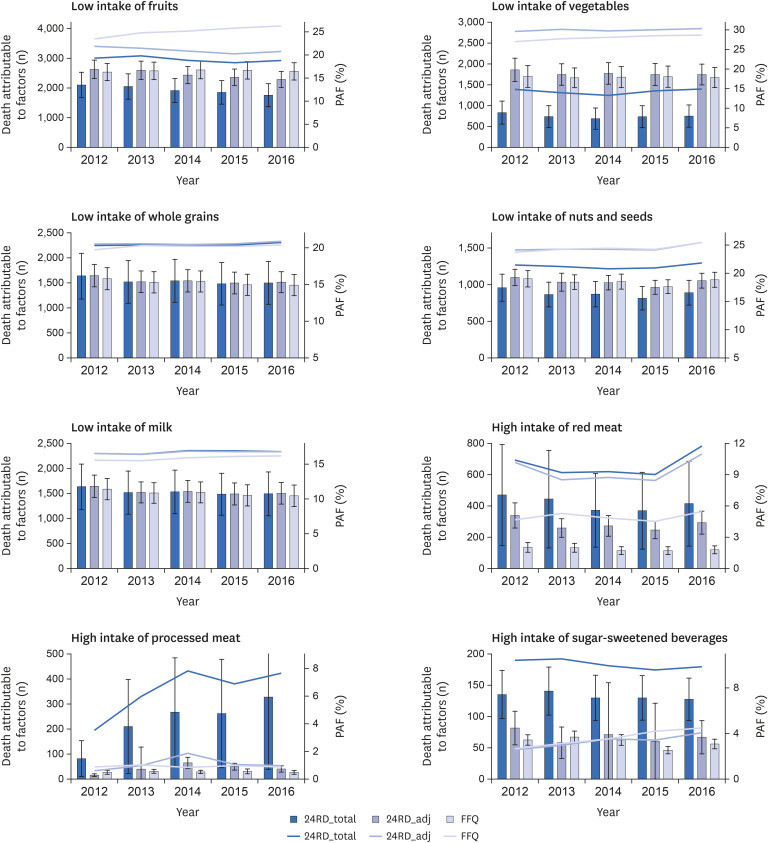
Fig. 3

Comparison of population attributable fraction and total disease burden due to each risk factor by year.

24RD_total indicates that the 24-hour recall data included all food items used for the analyses. 24RD_adj indicates that the 24-hour recall data included only food items that were also included in the FFQ for the analyses. Error bars represent standard deviations. Bar graphs represent the number of deaths attributable to each factor. Line graphs represent the PAF for each factor.
FFQ, food frequency questionnaire; PAF, population attributable fraction.
nrp-14-384-g003

DISCUSSION

This study examined the nutrition transition and the associated burdens of cardiometabolic diseases (cardiovascular diseases and diabetes mellitus) and cancer mortality in Korea from 1998 to 2016 using the CRA framework. The study reported important findings. First, among the nine dietary risk factors evaluated, the leading contributors to high cardiometabolic and cancer mortality were low intakes of fruits and whole grains. Despite recent improvements in intake levels of fruits and whole grains, deaths attributable to these factors remained high, as the intake levels remained far below the optimal levels. Second, deaths attributable to low intakes of nuts and seeds, calcium, and milk and high intakes of red meat, processed meat, and sugar-sweetened beverages continuously increased since 1998. Finally, the total number of deaths from chronic diseases attributable to all dietary factors combined was 231,148 (49,430 IHD deaths, 87,060 stroke deaths, 46,291 diabetes mellitus deaths, and 48,367 cancer deaths), accounting for nearly 31% of chronic disease mortality during the study period. Our data suggest that these dietary risk factors may be important targets for chronic disease prevention in Korea.
Consistent with previous findings [121415], our data showed that low consumption of fruits and whole grains made the greatest contribution to cardiometabolic and cancer mortality in Korea from 1998 to 2016. A prior GBD study identified a diet low in fruits and whole grains as the world’s leading contributor to all-cause mortality in 2015 [21]. This finding is also consistent with earlier CRA studies conducted in Koreans using diet information obtained from the FFQ in the KNHANES in 1998 to 2011 and from 2012 to 2013 [1415]. These studies have shown that, among the dietary factors evaluated, suboptimal intakes of fruits and whole grains consistently ranked as the top contributors to cardiometabolic deaths during the study period [1415]. In the present study, we used the same national survey data (KNHANES) but examined the longer-term nutritional transition using 24-hour recall data from the first KNHANES (1998) to the latest KNHANES (2016). Further, our analysis included people aged ≥ 65 years to evaluate the nutritional transition in a broader age spectrum, whereas previous studies were limited to people aged 25 to 65 years. Consequently, the intake patterns for several dietary factors were somewhat different from those in earlier studies. For example, in previous studies [1415], the intakes of fruits, vegetables, and whole grains were in continuous decline from 2005 to 2013, whereas the current study showed an upward trend starting in 2008, indicating recent improvements in the consumption levels of these food groups in the population. Despite these differences, the ranking of dietary factors remains the same across the studies. The overall moderate improvements in the intakes of fruits, vegetables, and whole grains observed in the present study may possibly be explained by increased knowledge and awareness of nutrition in the population through nationwide nutritional education (e.g., Green Food Education Program), policies (e.g., nutrition fact labeling), and campaigns (e.g., Dietary Life Practice Campaign) focusing on fruit and vegetable intakes over the past few decades [914]. However, as the current levels of dietary intake still remain far below the optimal levels, it is important to develop and promote more effective nutritional strategies to achieve further reduction in disease burdens. Moreover, the contributions of relatively lower-ranked dietary factors, including calcium, milk, meat (unprocessed and processed), and sugar-sweetened beverages, to the disease burden were on a continuous upward trend, indicating emerging nutrition problems that need to be highlighted in future prevention efforts.
In the current study, the PAFs for each diet–disease pair varied extensively according to age group, with generally higher PAFs in the younger age groups. Specifically, younger populations had much higher and more rapidly increasing PAFs from intakes of processed meat and sugar-sweetened beverages, which could be largely explained by the much higher intakes of these food groups in younger populations than in older populations. Further, improvements in dietary patterns (increased intakes of fruits and vegetables) were mainly observed in the older age groups (≥ 44 years), and more unfavorable changes (a sharp increase in processed meat intake) were observed in the younger age group (25–44 years). Our findings suggest possible birth cohort effects, as well as a period effect, that may have influenced dietary intakes over time. Younger populations are more likely to have been exposed to processed meat and sugar-sweetened beverages at a younger age, the critical period for formation of taste and food preferences, and thereby could have more easily adopted a Western diet throughout their lives [11]. Along with changing family structure (an increase in one-member or small-sized families), eating out has become more frequent in Korea [24], especially among younger populations, resulting in greater exposure to diets high in processed meat and sugar-sweetened beverages. Countries like Korea that have undergone dramatic economic development and social change are likely to experience large generational differences (e.g., the birth cohort effect) in lifestyle and disease patterns. Our results indicate that the nutritional transition and dietary patterns vary by age and thus highlight the need for different nutritional strategies for different age groups.
In sensitivity analyses, we observed that the CRA results were slightly different according to dietary assessment methods, whereas other information (e.g., RRs, TMRED, and mortality) stayed the same. This discrepancy in results can be explained by different numbers of food items included in the two methods (FFQ vs. one-day 24-hour recall). The KNHANES FFQ is designed to capture an individual’s habitual intake during the past 12 months using 112 food items and a nine-level frequency scale, whereas the 24-hour recall is designed as an open-ended survey assessing the actual amount of food intake during the past 24 hours. Hence, the estimated intakes of each dietary factor assessed by 24-hour recall were consistently higher than those assessed by the FFQ. The discrepancy between the two methods was particularly high for red meat, indicating the possibility of underestimation of red meat consumption when using the FFQ. In other words, the FFQ may be missing important food items that could largely contribute to the disease burden.
Several limitations of this study should be considered in interpretation of the findings. First, we used a single-day 24-hour recall to assess intake levels of individual dietary factors. This method may not to be able to capture day-to-day variations and long-term average diets, and thus the results may not represent the usual intake of individuals. Second, measurement errors in our dietary data are also possible due to inaccurate reporting of portion size, since the method relies on memory. However, the 24-hour recall may provide adequate estimates of absolute intake levels and group means in a large population. Third, our analysis assumed that the RR for each dietary factor reflects the causal relationships with cardiometabolic and cancer mortality in our study population. Because these RRs were derived from meta-analyses that primarily included people of European descent, it is not certain that the same RRs would describe the relationships in Koreans. As Asians are believed to have different body composition and cardiometabolic profiles than their Western counterparts, further investigations are needed to confirm the diet–disease relationships in Asians and whether the TMREDs used in this study are appropriate optimal levels for this population. Despite the limitations, this study has important strengths. Using nationally representative data, we comprehensively investigated nutritional transitions and associated disease burdens in Korea over the past 19 years. We separately examined the trends in different sex and age groups to identify effective target groups for nutritional interventions and policies. Further, as there are very few data from Asian countries on this subject, this study provides important evidence to inform dietary intervention and policy priorities in Asia.
In conclusion, 231,148 cardiometabolic and cancer deaths were attributable to dietary risk factors in Korea from 1998 to 2016. Among the nine dietary factors evaluated, suboptimal intakes of fruits and whole grains were the leading causes of chronic disease burden. Our data suggest that to reduce the chronic disease burden in Korea, more effective nutritional policies and interventions are needed to target these dietary risk factors.

Notes

Funding: This research was supported by the Basic Science Research Program of the National Research Foundation (NRF) (NRF-2019R1F1A1063744, NRF-2019S1A3A2099973) and by the Bio & Medical Technology Development Program (NRF-2012M3A9C4048761) of the NRF funded by the Ministry of Science and ICT. This research was also carried out with the support of “Cooperative Research Program for Agriculture Science and Technology Development (Project No. PJ01470902)” Rural Development Administration, Republic of Korea.

Conflict of Interest: The authors declare no potential conflicts of interests.

Author Contributions:

  • Conceptualization: Shin MJ.

  • Data curation: Park D.

  • Formal analysis: Jo G, Oh H, Park D.

  • Methodology: Singh GM, Shin MJ.

  • Supervision: Shin MJ.

  • Writing - original draft: Jo G, Oh H, Shin MJ.

  • Writing - review & editing: Jo G, Oh H, Shin MJ.

References

1. Mc Namara K, Alzubaidi H, Jackson JK. Cardiovascular disease as a leading cause of death: how are pharmacists getting involved? Integr Pharm Res Pract. 2019; 8:1–11. PMID: 30788283.
2. Naghavi M, Abajobir AA, Abbafati C, Abbas KM, Abd-Allah F, Abera SF, Aboyans V, Adetokunboh O, Afshin A, Agrawal A, Ahmadi A, Ahmed MB, Aichour AN, Aichour MT, Aichour I, Aiyar S, Alahdab F, Al-Aly Z, Alam K, Alam N, Alam T, Alene KA, Al-Eyadhy A, Ali SD, Alizadeh-Navaei R, Alkaabi JM, Alkerwi A, Alla F, Allebeck P, Allen C, Al-Raddadi R, Alsharif U, Altirkawi KA, Alvis-Guzman N, Amare AT, Amini E, Ammar W, Amoako YA, Anber N, Andersen HH, Andrei CL, Androudi S, Ansari H, Antonio CA, Anwari P, Ärnlöv J, Arora M, Artaman A, Aryal KK, Asayesh H, Asgedom SW, Atey TM, Avila-Burgos L, Avokpaho EF, Awasthi A, Babalola TK, Bacha U, Balakrishnan K, Barac A, Barboza MA, Barker-Collo SL, Barquera S, Barregard L, Barrero LH, Baune BT, Bedi N, Beghi E, Béjot Y, Bekele BB, Bell ML, Bennett JR, Bensenor IM, Berhane A, Bernabé E, Betsu BD, Beuran M, Bhatt S, Biadgilign S, Bienhoff K, Bikbov B, Bisanzio D, Bourne RR, Breitborde NJ, Bulto LN, Bumgarner BR, Butt ZA, Cahuana-Hurtado L, Cameron E, Campuzano JC, Car J, Cárdenas R, Carrero JJ, Carter A, Casey DC, Castañeda-Orjuela CA, Catalá-López F, Charlson FJ, Chibueze CE, Chimed-Ochir O, Chisumpa VH, Chitheer AA, Christopher DJ, Ciobanu LG, Cirillo M, Cohen AJ, Colombara D, Cooper C, Cowie BC, Criqui MH, Dandona L, Dandona R, Dargan PI, das Neves J, Davitoiu DV, Davletov K, de Courten B, Defo BK, Degenhardt L, Deiparine S, Deribe K, Deribew A, Dey S, Dicker D, Ding EL, Djalalinia S, Do HP, Doku DT, Douwes-Schultz D, Driscoll TR, Dubey M, Duncan BB, Echko M, El-Khatib ZZ, Ellingsen CL, Enayati A, Ermakov SP, Erskine HE, Eskandarieh S, Esteghamati A, Estep K, Farinha CS, Faro A, Farzadfar F, Feigin VL, Fereshtehnejad SM, Fernandes JC, Ferrari AJ, Feyissa TR, Filip I, Finegold S, Fischer F, Fitzmaurice C, Flaxman AD, Foigt N, Frank T, Fraser M, Fullman N, Fürst T, Furtado JM, Gakidou E, Garcia-Basteiro AL, Gebre T, Gebregergs GB, Gebrehiwot TT, Gebremichael DY, Geleijnse JM, Genova-Maleras R, Gesesew HA, Gething PW, Gillum RF, Giref AZ, Giroud M, Giussani G, Godwin WW, Gold AL, Goldberg EM, Gona PN, Gopalani SV, Gouda HN, Goulart AC, Griswold M, Gupta R, Gupta T, Gupta V, Gupta PC, Haagsma JA, Hafezi-Nejad N, Hailu AD, Hailu GB, Hamadeh RR, Hambisa MT, Hamidi S, Hammami M, Hancock J, Handal AJ, Hankey GJ, Hao Y, Harb HL, Hareri HA, Hassanvand MS, Havmoeller R, Hay SI, He F, Hedayati MT, Henry NJ, Heredia-Pi IB, Herteliu C, Hoek HW, Horino M, Horita N, Hosgood HD, Hostiuc S, Hotez PJ, Hoy DG, Huynh C, Iburg KM, Ikeda C, Ileanu BV, Irenso AA, Irvine CM, Islam SM, Jacobsen KH, Jahanmehr N, Jakovljevic MB, Javanbakht M, Jayaraman SP, Jeemon P, Jha V, John D, Johnson CO, Johnson SC, Jonas JB, Jürisson M, Kabir Z, Kadel R, Kahsay A, Kamal R, Karch A, Karimi SM, Karimkhani C, Kasaeian A, Kassaw NA, Kassebaum NJ, Katikireddi SV, Kawakami N, Keiyoro PN, Kemmer L, Kesavachandran CN, Khader YS, Khan EA, Khang YH, Khoja AT, Khosravi MH, Khosravi A, Khubchandani J, Kiadaliri AA, Kieling C, Kievlan D, Kim YJ, Kim D, Kimokoti RW, Kinfu Y, Kissoon N, Kivimaki M, Knudsen AK, Kopec JA, Kosen S, Koul PA, Koyanagi A, Kulikoff XR, Kumar GA, Kumar P, Kutz M, Kyu HH, Lal DK, Lalloo R, Lambert TL, Lan Q, Lansingh VC, Larsson A, Lee PH, Leigh J, Leung J, Levi M, Li Y, Li Kappe D, Liang X, Liben ML, Lim SS, Liu PY, Liu A, Liu Y, Lodha R, Logroscino G, Lorkowski S, Lotufo PA, Lozano R, Lucas TC, Ma S, Macarayan ER, Maddison ER, Magdy Abd El Razek M, Majdan M, Majdzadeh R, Majeed A, Malekzadeh R, Malhotra R, Malta DC, Manguerra H, Manyazewal T, Mapoma CC, Marczak LB, Markos D, Martinez-Raga J, Martins-Melo FR, Martopullo I, McAlinden C, McGaughey M, McGrath JJ, Mehata S, Meier T, Meles KG, Memiah P, Memish ZA, Mengesha MM, Mengistu DT, Menota BG, Mensah GA, Meretoja TJ, Meretoja A, Millear A, Miller TR, Minnig S, Mirarefin M, Mirrakhimov EM, Misganaw A, Mishra SR, Mohamed IA, Mohammad KA, Mohammadi A, Mohammed S, Mokdad AH, Mola GL, Mollenkopf SK, Molokhia M, Monasta L, Montañez JC, Montico M, Mooney MD, Moradi-Lakeh M, Moraga P, Morawska L, Morozoff C, Morrison SD, Mountjoy-Venning C, Mruts KB, Muller K, Murthy GV, Musa KI, Nachega JB, Naheed A, Naldi L, Nangia V, Nascimento BR, Nasher JT, Natarajan G, Negoi I, Ngunjiri JW, Nguyen CT, Nguyen QL, Nguyen TH, Nguyen G, Nguyen M, Nichols E, Ningrum DN, Nong VM, Noubiap JJ, Ogbo FA, Oh IH, Okoro A, Olagunju AT, Olsen HE, Olusanya BO, Olusanya JO, Ong K, Opio JN, Oren E, Ortiz A, Osman M, Ota E, Pa M, Pacella RE, Pakhale S, Pana A, Panda BK, Panda-Jonas S, Papachristou C, Park EK, Patten SB, Patton GC, Paudel D, Paulson K, Pereira DM, Perez-Ruiz F, Perico N, Pervaiz A, Petzold M, Phillips MR, Pigott DM, Pinho C, Plass D, Pletcher MA, Polinder S, Postma MJ, Pourmalek F, Purcell C, Qorbani M, Quintanilla BP, Radfar A, Rafay A, Rahimi-Movaghar V, Rahman MH, Rahman M, Rai RK, Ranabhat CL, Rankin Z, Rao PC, Rath GK, Rawaf S, Ray SE, Rehm J, Reiner RC, Reitsma MB, Remuzzi G, Rezaei S, Rezai MS, Rokni MB, Ronfani L, Roshandel G, Roth GA, Rothenbacher D, Ruhago GM, Sa R, Saadat S, Sachdev PS, Sadat N, Safdarian M, Safi S, Safiri S, Sagar R, Sahathevan R, Salama J, Salamati P, Salomon JA, Samy AM, Sanabria JR, Sanchez-Niño MD, Santomauro D, Santos IS, Santric Milicevic MM, Sartorius B, Satpathy M, Schmidt MI, Schneider IJ, Schulhofer-Wohl S, Schutte AE, Schwebel DC, Schwendicke F, Sepanlou SG, Servan-Mori EE, Shackelford KA, Shahraz S, Shaikh MA, Shamsipour M, Shamsizadeh M, Sharma J, Sharma R, She J, Sheikhbahaei S, Shey M, Shi P, Shields C, Shigematsu M, Shiri R, Shirude S, Shiue I, Shoman H, Shrime MG, Sigfusdottir ID, Silpakit N, Silva JP, Singh JA, Singh A, Skiadaresi E, Sligar A, Smith DL, Smith A, Smith M, Sobaih BH, Soneji S, Sorensen RJ, Soriano JB, Sreeramareddy CT, Srinivasan V, Stanaway JD, Stathopoulou V, Steel N, Stein DJ, Steiner C, Steinke S, Stokes MA, Strong M, Strub B, Subart M, Sufiyan MB, Sunguya BF, Sur PJ, Swaminathan S, Sykes BL, Tabarés-Seisdedos R, Tadakamadla SK, Takahashi K, Takala JS, Talongwa RT, Tarawneh MR, Tavakkoli M, Taveira N, Tegegne TK, Tehrani-Banihashemi A, Temsah MH, Terkawi AS, Thakur JS, Thamsuwan O, Thankappan KR, Thomas KE, Thompson AH, Thomson AJ, Thrift AG, Tobe-Gai R, Topor-Madry R, Torre A, Tortajada M, Towbin JA, Tran BX, Troeger C, Truelsen T, Tsoi D, Tuzcu EM, Tyrovolas S, Ukwaja KN, Undurraga EA, Updike R, Uthman OA, Uzochukwu BS, van Boven JF, Vasankari T, Venketasubramanian N, Violante FS, Vlassov VV, Vollset SE, Vos T, Wakayo T, Wallin MT, Wang YP, Weiderpass E, Weintraub RG, Weiss DJ, Werdecker A, Westerman R, Whetter B, Whiteford HA, Wijeratne T, Wiysonge CS, Woldeyes BG, Wolfe CD, Woodbrook R, Workicho A, Xavier D, Xiao Q, Xu G, Yaghoubi M, Yakob B, Yano Y, Yaseri M, Yimam HH, Yonemoto N, Yoon SJ, Yotebieng M, Younis MZ, Zaidi Z, Zaki ME, Zegeye EA, Zenebe ZM, Zerfu TA, Zhang AL, Zhang X, Zipkin B, Zodpey S, Lopez AD, Murray CJ. GBD 2016 Causes of Death Collaborators. Global, regional, and national age-sex specific mortality for 264 causes of death, 1980-2016: a systematic analysis for the global burden of disease study 2016. Lancet. 2017; 390:1151–1210. PMID: 28919116.
3. Statistics Korea. Causes of Death Statistics in 2017. Daejeon: Statistics Korea;2015.
4. Norat T, Chan D, Lau R, Aune D, Vieira R. The Associations between Food, Nutrition and Physical Activity and the Risk of Colorectal Cancer. London: World Cancer Research Fund/American Insitute for Cancer Research;2010.
5. Ruel G, Shi Z, Zhen S, Zuo H, Kröger E, Sirois C, Lévesque JF, Taylor AW. Association between nutrition and the evolution of multimorbidity: the importance of fruits and vegetables and whole grain products. Clin Nutr. 2014; 33:513–520. PMID: 23931982.
crossref
6. Lim SS, Vos T, Flaxman AD, Danaei G, Shibuya K, Adair-Rohani H, Amann M, Anderson HR, Andrews KG, Aryee M, Atkinson C, Bacchus LJ, Bahalim AN, Balakrishnan K, Balmes J, Barker-Collo S, Baxter A, Bell ML, Blore JD, Blyth F, Bonner C, Borges G, Bourne R, Boussinesq M, Brauer M, Brooks P, Bruce NG, Brunekreef B, Bryan-Hancock C, Bucello C, Buchbinder R, Bull F, Burnett RT, Byers TE, Calabria B, Carapetis J, Carnahan E, Chafe Z, Charlson F, Chen H, Chen JS, Cheng AT, Child JC, Cohen A, Colson KE, Cowie BC, Darby S, Darling S, Davis A, Degenhardt L, Dentener F, Des Jarlais DC, Devries K, Dherani M, Ding EL, Dorsey ER, Driscoll T, Edmond K, Ali SE, Engell RE, Erwin PJ, Fahimi S, Falder G, Farzadfar F, Ferrari A, Finucane MM, Flaxman S, Fowkes FG, Freedman G, Freeman MK, Gakidou E, Ghosh S, Giovannucci E, Gmel G, Graham K, Grainger R, Grant B, Gunnell D, Gutierrez HR, Hall W, Hoek HW, Hogan A, Hosgood HD 3rd, Hoy D, Hu H, Hubbell BJ, Hutchings SJ, Ibeanusi SE, Jacklyn GL, Jasrasaria R, Jonas JB, Kan H, Kanis JA, Kassebaum N, Kawakami N, Khang YH, Khatibzadeh S, Khoo JP, Kok C, Laden F, Lalloo R, Lan Q, Lathlean T, Leasher JL, Leigh J, Li Y, Lin JK, Lipshultz SE, London S, Lozano R, Lu Y, Mak J, Malekzadeh R, Mallinger L, Marcenes W, March L, Marks R, Martin R, McGale P, McGrath J, Mehta S, Mensah GA, Merriman TR, Micha R, Michaud C, Mishra V, Mohd Hanafiah K, Mokdad AA, Morawska L, Mozaffarian D, Murphy T, Naghavi M, Neal B, Nelson PK, Nolla JM, Norman R, Olives C, Omer SB, Orchard J, Osborne R, Ostro B, Page A, Pandey KD, Parry CD, Passmore E, Patra J, Pearce N, Pelizzari PM, Petzold M, Phillips MR, Pope D, Pope CA 3rd, Powles J, Rao M, Razavi H, Rehfuess EA, Rehm JT, Ritz B, Rivara FP, Roberts T, Robinson C, Rodriguez-Portales JA, Romieu I, Room R, Rosenfeld LC, Roy A, Rushton L, Salomon JA, Sampson U, Sanchez-Riera L, Sanman E, Sapkota A, Seedat S, Shi P, Shield K, Shivakoti R, Singh GM, Sleet DA, Smith E, Smith KR, Stapelberg NJ, Steenland K, Stöckl H, Stovner LJ, Straif K, Straney L, Thurston GD, Tran JH, Van Dingenen R, van Donkelaar A, Veerman JL, Vijayakumar L, Weintraub R, Weissman MM, White RA, Whiteford H, Wiersma ST, Wilkinson JD, Williams HC, Williams W, Wilson N, Woolf AD, Yip P, Zielinski JM, Lopez AD, Murray CJ, Ezzati M, AlMazroa MA, Memish ZA. A comparative risk assessment of burden of disease and injury attributable to 67 risk factors and risk factor clusters in 21 regions, 1990–2010: a systematic analysis for the global burden of disease study 2010. Lancet. 2012; 380:2224–2260. PMID: 23245609.
crossref
7. Begg SJ, Vos T, Barker B, Stanley L, Lopez AD. Burden of disease and injury in Australia in the new millennium: measuring health loss from diseases, injuries and risk factors. Med J Aust. 2008; 188:36–40. PMID: 18205562.
crossref
8. Danaei G, Ding EL, Mozaffarian D, Taylor B, Rehm J, Murray CJ, Ezzati M. The preventable causes of death in the United States: comparative risk assessment of dietary, lifestyle, and metabolic risk factors. PLoS Med. 2009; 6:e1000058. PMID: 19399161.
crossref
9. Farzadfar F, Danaei G, Namdaritabar H, Rajaratnam JK, Marcus JR, Khosravi A, Alikhani S, Murray CJ, Ezzati M. National and subnational mortality effects of metabolic risk factors and smoking in Iran: a comparative risk assessment. Popul Health Metr. 2011; 9:55. PMID: 21989074.
crossref
10. Afshin A, Micha R, Khatibzadeh S, Fahimi S, Shi P, Powles J, Singh G, Yakoob MY, Abdollahi M, Al-Hooti S, Farzadfar F, Houshiar-Rad A, Hwalla N, Koksal E, Musaiger A, Pekcan G, Sibai AM, Zaghloul S, Danaei G, Ezzati M, Mozaffarian D. 2010 Global Burden of Diseases, Injuries, and Risk Factors Study: NUTRItrition and ChrOnic Diseases Expert Group (NUTRICODE), and Metabolic Risk Factors of ChrOnic Diseases Collaborating Group. The impact of dietary habits and metabolic risk factors on cardiovascular and diabetes mortality in countries of the Middle East and North Africa in 2010: a comparative risk assessment analysis. BMJ Open. 2015; 5:e006385.
crossref
11. Murray CJ, Ezzati M, Lopez AD, Rodgers A, Vander Hoorn S. Comparative quantification of health risks conceptual framework and methodological issues. Popul Health Metr. 2003; 1:1. PMID: 12780936.
crossref
12. Meier T, Gräfe K, Senn F, Sur P, Stangl GI, Dawczynski C, März W, Kleber ME, Lorkowski S. Cardiovascular mortality attributable to dietary risk factors in 51 countries in the WHO European Region from 1990 to 2016: a systematic analysis of the global burden of disease study. Eur J Epidemiol. 2019; 34:37–55. PMID: 30547256.
crossref
13. He Y, Li Y, Yang X, Hemler EC, Fang Y, Zhao L, Zhang J, Yang Z, Wang Z, He L, Sun J, Wang DD, Wang J, Piao J, Liang X, Ding G, Hu FB. The dietary transition and its association with cardiometabolic mortality among Chinese adults, 1982–2012: a cross-sectional population-based study. Lancet Diabetes Endocrinol. 2019; 7:540–548. PMID: 31085143.
crossref
14. Cho Y, Cudhea F, Park JH, Lee JT, Mozaffarian D, Singh G, Shin MJ. Estimating change in cardiovascular disease and diabetes burdens due to dietary and metabolic factors in Korea 1998–2011: a comparative risk assessment analysis. BMJ Open. 2016; 6:e013283.
crossref
15. Cho Y, Cudhea F, Park JH, Mozaffarian D, Singh G, Shin MJ. Burdens of cardiometabolic diseases attributable to dietary and metabolic risks in Korean adults 2012–2013. Yonsei Med J. 2017; 58:540–551. PMID: 28332359.
crossref
16. Micha R, Shulkin ML, Peñalvo JL, Khatibzadeh S, Singh GM, Rao M, Fahimi S, Powles J, Mozaffarian D. Etiologic effects and optimal intakes of foods and nutrients for risk of cardiovascular diseases and diabetes: systematic reviews and meta-analyses from the Nutrition and Chronic Diseases Expert Group (NutriCoDE). PLoS One. 2017; 12:e0175149. PMID: 28448503.
crossref
17. Feigin VL, Roth GA, Naghavi M, Parmar P, Krishnamurthi R, Chugh S, Mensah GA, Norrving B, Shiue I, Ng M, Estep K, Cercy K, Murray CJ, Forouzanfar MH. Global Burden of Diseases, Injuries and Risk Factors Study 2013 and Stroke Experts Writing Group. Global burden of stroke and risk factors in 188 countries, during 1990–2013: a systematic analysis for the global burden of disease study 2013. Lancet Neurol. 2016; 15:913–924. PMID: 27291521.
crossref
18. Shulkin ML, Micha R, Rao M, Singh GM, Mozaffarian D. Major dietary risk factors for cardiometabolic disease: current evidence for causal effects and effect sizes from the global burden of diseases (GBD) 2015 study. Circulation. 2016; 133:AP279.
19. Kim Y. The Korea National Health and Nutrition Examination Survey (KNHANES): current status and challenges. Epidemiol Health. 2014; 36:e2014002. PMID: 24839580.
crossref
20. Singh GM, Danaei G, Farzadfar F, Stevens GA, Woodward M, Wormser D, Kaptoge S, Whitlock G, Qiao Q, Lewington S, Di Angelantonio E, Vander Hoorn S, Lawes CM, Ali MK, Mozaffarian D, Ezzati M. Global Burden of Metabolic Risk Factors of Chronic Diseases Collaborating Group. Asia-Pacific Cohort Studies Collaboration (APCSC). Diabetes Epidemiology: Collaborative analysis of Diagnostic criteria in Europe (DECODE). Emerging Risk Factor Collaboration (ERFC). Prospective Studies Collaboration (PSC). The age-specific quantitative effects of metabolic risk factors on cardiovascular diseases and diabetes: a pooled analysis. PLoS One. 2013; 8:e65174. PMID: 23935815.
crossref
21. Forouzanfar MH, Afshin A, Alexander LT, Anderson HR, Bhutta ZA, Biryukov S, Brauer M, Burnett R, Cercy K, Charlson FJ, Cohen AJ, Dandona L, Estep K, Ferrari AJ, Frostad JJ, Fullman N, Gething PW, Godwin WW, Griswold M, Hay SI, Kinfu Y, Kyu HH, Larson HJ, Liang X, Lim SS, Liu PY, Lopez AD, Lozano R, Marczak L, Mensah GA, Mokdad AH, Moradi-Lakeh M, Naghavi M, Neal B, Reitsma MB, Roth GA, Salomon JA, Sur PJ, Vos T, Wagner JA, Wang H, Zhao Y, Zhou M, Aasvang GM, Abajobir AA, Abate KH, Abbafati C, Abbas KM, Abd-Allah F, Abdulle AM, Abera SF, Abraham B, Abu-Raddad LJ, Abyu GY, Adebiyi AO, Adedeji IA, Ademi Z, Adou AK, Adsuar JC, Agardh EE, Agarwal A, Agrawal A, Kiadaliri AA, Ajala ON, Akinyemiju TF, Al-Aly Z, Alam K, Alam NK, Aldhahri SF, Aldridge RW, Alemu ZA, Ali R, Alkerwi A, Alla F, Allebeck P, Alsharif U, Altirkawi KA, Martin EA, Alvis-Guzman N, Amare AT, Amberbir A, Amegah AK, Amini H, Ammar W, Amrock SM, Andersen HH, Anderson BO, Antonio CA, Anwari P, Ärnlöv J, Artaman A, Asayesh H, Asghar RJ, Assadi R, Atique S, Avokpaho EF, Awasthi A, Quintanilla BP, Azzopardi P, Bacha U, Badawi A, Bahit MC, Balakrishnan K, Barac A, Barber RM, Barker-Collo SL, Bärnighausen T, Barquera S, Barregard L, Barrero LH, Basu S, Batis C, Bazargan-Hejazi S, Beardsley J, Bedi N, Beghi E, Bell B, Bell ML, Bello AK, Bennett DA, Bensenor IM, Berhane A, Bernabé E, Betsu BD, Beyene AS, Bhala N, Bhansali A, Bhatt S, Biadgilign S, Bikbov B, Bisanzio D, Bjertness E, Blore JD, Borschmann R, Boufous S, Bourne RR, Brainin M, Brazinova A, Breitborde NJ, Brenner H, Broday DM, Brugha TS, Brunekreef B, Butt ZA, Cahill LE, Calabria B, Campos-Nonato IR, Cárdenas R, Carpenter DO, Carrero JJ, Casey DC, Castañeda-Orjuela CA, Rivas JC, Castro RE, Catalá-López F, Chang JC, Chiang PP, Chibalabala M, Chimed-Ochir O, Chisumpa VH, Chitheer AA, Choi JY, Christensen H, Christopher DJ, Ciobanu LG, Coates MM, Colquhoun SM, Manzano AG, Cooper LT, Cooperrider K, Cornaby L, Cortinovis M, Crump JA, Cuevas-Nasu L, Damasceno A, Dandona R, Darby SC, Dargan PI, das Neves J, Davis AC, Davletov K, de Castro EF, De la Cruz-Góngora V, De Leo D, Degenhardt L, Del Gobbo LC, del Pozo-Cruz B, Dellavalle RP, Deribew A, Jarlais DC, Dharmaratne SD, Dhillon PK, Diaz-Torné C, Dicker D, Ding EL, Dorsey ER, Doyle KE, Driscoll TR, Duan L, Dubey M, Duncan BB, Elyazar I, Endries AY, Ermakov SP, Erskine HE, Eshrati B, Esteghamati A, Fahimi S, Faraon EJ, Farid TA, Farinha CS, Faro A, Farvid MS, Farzadfar F, Feigin VL, Fereshtehnejad SM, Fernandes JG, Fischer F, Fitchett JR, Fleming T, Foigt N, Foreman K, Fowkes FG, Franklin RC, Fürst T, Futran ND, Gakidou E, Garcia-Basteiro AL, Gebrehiwot TT, Gebremedhin AT, Geleijnse JM, Gessner BD, Giref AZ, Giroud M, Gishu MD, Giussani G, Goenka S, Gomez-Cabrera MC, Gomez-Dantes H, Gona P, Goodridge A, Gopalani SV, Gotay CC, Goto A, Gouda HN, Gugnani HC, Guillemin F, Guo Y, Gupta R, Gupta R, Gutiérrez RA, Haagsma JA, Hafezi-Nejad N, Haile D, Hailu GB, Halasa YA, Hamadeh RR, Hamidi S, Handal AJ, Hankey GJ, Hao Y, Harb HL, Harikrishnan S, Haro JM, Hassanvand MS, Hassen TA, Havmoeller R, Heredia-Pi IB, Hernández-Llanes NF, Heydarpour P, Hoek HW, Hoffman HJ, Horino M, Horita N, Hosgood HD, Hoy DG, Hsairi M, Htet AS, Hu G, Huang JJ, Husseini A, Hutchings SJ, Huybrechts I, Iburg KM, Idrisov BT, Ileanu BV, Inoue M, Jacobs TA, Jacobsen KH, Jahanmehr N, Jakovljevic MB, Jansen HA, Jassal SK, Javanbakht M, Jayaraman SP, Jayatilleke AU, Jee SH, Jeemon P, Jha V, Jiang Y, Jibat T, Jin Y, Johnson CO, Jonas JB, Kabir Z, Kalkonde Y, Kamal R, Kan H, Karch A, Karema CK, Karimkhani C, Kasaeian A, Kaul A, Kawakami N, Kazi DS, Keiyoro PN, Kemmer L, Kemp AH, Kengne AP, Keren A, Kesavachandran CN, Khader YS, Khan AR, Khan EA, Khan G, Khang YH, Khatibzadeh S, Khera S, Khoja TA, Khubchandani J, Kieling C, Kim C, Kim D, Kimokoti RW, Kissoon N, Kivipelto M, Knibbs LD, Kokubo Y, Kopec JA, Koul PA, Koyanagi A, Kravchenko M, Kromhout H, Krueger H, Ku T, Defo BK, Kuchenbecker RS, Bicer BK, Kuipers EJ, Kumar GA, Kwan GF, Lal DK, Lalloo R, Lallukka T, Lan Q, Larsson A, Latif AA, Lawrynowicz AE, Leasher JL, Leigh J, Leung J, Levi M, Li X, Li Y, Liang J, Liu S, Lloyd BK, Logroscino G, Lotufo PA, Lunevicius R, MacIntyre M, Mahdavi M, Majdan M, Majeed A, Malekzadeh R, Malta DC, Manamo WA, Mapoma CC, Marcenes W, Martin RV, Martinez-Raga J, Masiye F, Matsushita K, Matzopoulos R, Mayosi BM, McGrath JJ, McKee M, Meaney PA, Medina C, Mehari A, Mejia-Rodriguez F, Mekonnen AB, Melaku YA, Memish ZA, Mendoza W, Mensink GB, Meretoja A, Meretoja TJ, Mesfin YM, Mhimbira FA, Millear A, Miller TR, Mills EJ, Mirarefin M, Misganaw A, Mock CN, Mohammadi A, Mohammed S, Mola GL, Monasta L, Hernandez JC, Montico M, Morawska L, Mori R, Mozaffarian D, Mueller UO, Mullany E, Mumford JE, Murthy GV, Nachega JB, Naheed A, Nangia V, Nassiri N, Newton JN, Ng M, Nguyen QL, Nisar MI, Pete PM, Norheim OF, Norman RE, Norrving B, Nyakarahuka L, Obermeyer CM, Ogbo FA, Oh IH, Oladimeji O, Olivares PR, Olsen H, Olusanya BO, Olusanya JO, Opio JN, Oren E, Orozco R, Ortiz A, Ota E, Pa M, Pana A, Park EK, Parry CD, Parsaeian M, Patel T, Caicedo AJ, Patil ST, Patten SB, Patton GC, Pearce N, Pereira DM, Perico N, Pesudovs K, Petzold M, Phillips MR, Piel FB, Pillay JD, Plass D, Polinder S, Pond CD, Pope CA, Pope D, Popova S, Poulton RG, Pourmalek F, Prasad NM, Qorbani M, Rabiee RH, Radfar A, Rafay A, Rahimi-Movaghar V, Rahman M, Rahman MH, Rahman SU, Rai RK, Rajsic S, Raju M, Ram U, Rana SM, Ranganathan K, Rao P, García CA, Refaat AH, Rehm CD, Rehm J, Reinig N, Remuzzi G, Resnikoff S, Ribeiro AL, Rivera JA, Roba HS, Rodriguez A, Rodriguez-Ramirez S, Rojas-Rueda D, Roman Y, Ronfani L, Roshandel G, Rothenbacher D, Roy A, Saleh MM, Sanabria JR, Sanchez-Riera L, Sanchez-Niño MD, Sánchez-Pimienta TG, Sandar L, Santomauro DF, Santos IS, Sarmiento-Suarez R, Sartorius B, Satpathy M, Savic M, Sawhney M, Schmidhuber J, Schmidt MI, Schneider IJ, Schöttker B, Schutte AE, Schwebel DC, Scott JG, Seedat S, Sepanlou SG, Servan-Mori EE, Shaddick G, Shaheen A, Shahraz S, Shaikh MA, Levy TS, Sharma R, She J, Sheikhbahaei S, Shen J, Sheth KN, Shi P, Shibuya K, Shigematsu M, Shin MJ, Shiri R, Shishani K, Shiue I, Shrime MG, Sigfusdottir ID, Silva DA, Silveira DG, Silverberg JI, Simard EP, Sindi S, Singh A, Singh JA, Singh PK, Slepak EL, Soljak M, Soneji S, Sorensen RJ, Sposato LA, Sreeramareddy CT, Stathopoulou V, Steckling N, Steel N, Stein DJ, Stein MB, Stöckl H, Stranges S, Stroumpoulis K, Sunguya BF, Swaminathan S, Sykes BL, Szoeke CE, Tabarés-Seisdedos R, Takahashi K, Talongwa RT, Tandon N, Tanne D, Tavakkoli M, Taye BW, Taylor HR, Tedla BA, Tefera WM, Tegegne TK, Tekle DY, Terkawi AS, Thakur JS, Thomas BA, Thomas ML, Thomson AJ, Thorne-Lyman AL, Thrift AG, Thurston GD, Tillmann T, Tobe-Gai R, Tobollik M, Topor-Madry R, Topouzis F, Towbin JA, Tran BX, Dimbuene ZT, Tsilimparis N, Tura AK, Tuzcu EM, Tyrovolas S, Ukwaja KN, Undurraga EA, Uneke CJ, Uthman OA, van Donkelaar A, van Os J, Varakin YY, Vasankari T, Veerman JL, Venketasubramanian N, Violante FS, Vollset SE, Wagner GR, Waller SG, Wang JL, Wang L, Wang Y, Weichenthal S, Weiderpass E, Weintraub RG, Werdecker A, Westerman R, Whiteford HA, Wijeratne T, Wiysonge CS, Wolfe CD, Won S, Woolf AD, Wubshet M, Xavier D, Xu G, Yadav AK, Yakob B, Yalew AZ, Yano Y, Yaseri M, Ye P, Yip P, Yonemoto N, Yoon SJ, Younis MZ, Yu C, Zaidi Z, Zaki ME, Zhu J, Zipkin B, Zodpey S, Zuhlke LJ, Murray CJ. GBD 2015 Risk Factors Collaborators. Global, regional, and national comparative risk assessment of 79 behavioural, environmental and occupational, and metabolic risks or clusters of risks, 1990–2015: a systematic analysis for the global burden of disease study 2015. Lancet. 2016; 388:1659–1724. PMID: 27733284.
22. Cuzick J. A Wilcoxon-type test for trend. Stat Med. 1985; 4:87–90. PMID: 3992076.
crossref
23. Rural Development Administration. Consumer Friendly Food Composition Table for Adults. Suwon: Rural Development Administration;2009.
24. Ministry of Health and Welfare, Korea Centers for Disease Control and Prevention. Korea Health Statistics 2017: Korea National Health and Nutrition Examination Survey (KNHANES VII-2). Cheongju: Korea Centers for Disease Control and Prevention;2018.

SUPPLEMENTARY MATERIAL

Supplementary Table 1

Deaths attributable to each dietary factor by sex and age across years
nrp-14-384-s001.xls
TOOLS
Similar articles