

 PDF
PDF Citation
 Print
Print


INTRODUCTION
During early childhood, eating behaviors are established and can have long-term effects on growth and health [12]. Being underweight or stunted are both associated with an increased mortality, morbidity, and impaired development of children [3]. In contrast, being overweight or obese has immediate physical and mental health implications for a child, and both are risk factors for cardiovascular disease and diabetes in adults [3]. Diet is an important factor of growth and development during childhood. Therefore, it is important to accurately assess the dietary intake among preschool children.
Early childhood is a life phase where the assessment of dietary intake is particularly challenging because of many unique respondent and observer considerations [45]. For this age group, one must consider low literacy skills, limited attention span, limited memory, limited knowledge of food and food preparation, rapidly changing food habits, and dietary reporting by surrogate respondents [46]. As a consequence of these challenges, studies developing dietary measurement tools for preschool children are very limited.
A food frequency questionnaire (FFQ) is commonly used as an assessment tool for collecting usual dietary intake. It generally consists of a list of food items, frequencies of consumption, and portion sizes as either single or multiple categories [78]. One of the most frequently used methods to develop a new FFQ is by applying a data-based approach, which selects not only the food list, but also the quantitation, which includes the nutrient content and the portion size for most of the foods and nutrients consumed by the target population [9]. FFQs developed for preschool children are very few compared to those for the adult population. However, several FFQs have been developed targeting preschool age children [510111213].
In the Korea National Health and Nutrition Examination Survey (KNHANES), a daily dietary intake assessed by 24-hour dietary recall (24HDR) is conducted for the population of one year of age or older. However, only the age group of 19 to 64 years is surveyed for the usual dietary intake by FFQ [14]. In other words, there is no comprehensive dietary assessment tool for estimating the usual dietary intake of preschool children in Korea. Therefore, the primary goal of this study was to design a food frequency questionnaire for a comprehensive assessment of dietary intake in Korean preschool children using the data-based approach.
Go to : 
SUBJECTS AND METHODS
Data source
We developed the FFQ based on the data from 2,766 preschool children aged between 1 and 5 years who had completed 24HDR in the 2009–2013 Korea National Health and Nutrition Examination Survey. The KNHANES is a nationally representative, cross-sectional survey and consists of the following three surveys: a health interview, a health examination, and a nutrition survey. Detailed information on the method and data of KNHANES is available [14]. The Korea Centers of Disease Control and Prevention Institutional Review Board approved the survey protocol (approval No. 2009-01CON-03-2C, 2010-02CON-21-C, 2011-02CON-06-C, 2012-01EXP-01-2C, and 2013-07CON-03-4C), and all guardians of the participants provided written informed consent.
Food list
The process of selecting dish items for the FFQ consisted of four steps as shown in Fig. 1 [79]. First, we tried to identify foods most predictive of between-person variability using cumulative r2 and nutritional contribution to total consumption for energy and 13 nutrients (protein, fat, carbohydrate, calcium, phosphorous, iron, sodium, potassium, vitamin A, thiamin, riboflavin, niacin, and vitamin C) [15]. We calculated the nutritional contribution based on the percent contribution of each food (“y1”) as
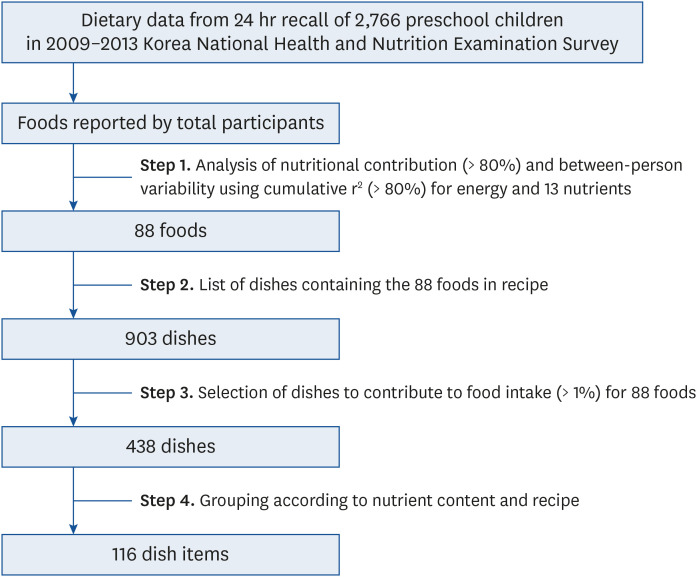

We excluded foods that accounted for less than 0.5% of total consumption in order to exclude foods consumed in large quantities by only a few participants [16]. To assess the between-person variation in nutrient intake, we carried out stepwise multiple regressions, and included the total nutrient intake from all foods as a dependent variable, and included nutrient intakes provided by each food as independent variables. We thus selected 88 foods that made over 80% of the total contribution to each nutrient and over 80% of accumulated r2 for each nutrient.
Second, we listed dishes containing any of 88 foods in the recipe and identified a total of 903 dishes. Third, we identified the percent contribution of each of the 903 dishes to the consumption of 88 foods. In this analysis, we selected 438 dishes contributing more than 1% of total consumption from the 903 dishes. Percent contributions of each dish (“y2”) in intake of each food were calculated as,

Finally, some of these 438 dishes were combined based on the nutrient profile and recipe into 116 items for the food list in the newly developed FFQ.
Frequency response section
Frequency questionnaire was designed to obtain the consumption frequency of each dish item for a month. Frequency response choices for dish items were categorized into nine groups with more allocation for more frequent intake: one non-consumption response, two monthly base responses, three weekly bases responses, and three daily bases responses.
Portion sizes
Reference portion size for each dish item was based on typical serving size as reflected in the distribution from the one-day 24HDR of 2,766 preschool children in the 2009–2013 KNHANES. For countable items such as strawberry, gram weight derived from the distribution was compared with the gram weight in the book [1718]. For mixed dishes, gram weight and volume were confirmed after cooking according to the derived recipe.
Development of a nutrient database
We developed the nutrient database for FFQ for preschool children according to the data-based approach [91119]. Nutrient content per 100 g of the 116 items in the FFQ was derived from the one-day 24HDR of the 2,766 preschool children aged between 1 and 5 years in the 2009–2013 KNHANES. We calculated the energy and nutrient intakes of KNHANES data based on the 8th edition of the Standard Food Composition Table from the Rural Development Administration by the KNHANES survey team [14]. Energy, macronutrients (protein, fat, and carbohydrate), five minerals (calcium, phosphorous, iron, sodium, and potassium), and five vitamins (vitamin A, thiamin, riboflavin, niacin, and vitamin C) content were contained in the nutrient database.
In order to examine how the developed FFQ assessed the dietary intake of preschool children, we calculated the percentage coverage of energy and 13 nutrients that can be assessed by the FFQ based on the nutrient database for preschool children FFQ. The percentage coverage of each nutrient (“y3”) was calculated as
y3 = Nutrient Intake Calculated from 116 Items in FFQ for Korean Preschool ChildrenTotal Nutrient Intake × 100
Data were analyzed using SAS 9.4 (SAS Institute, Inc., Cary, NC, USA).
Go to :
RESULTS
Food list
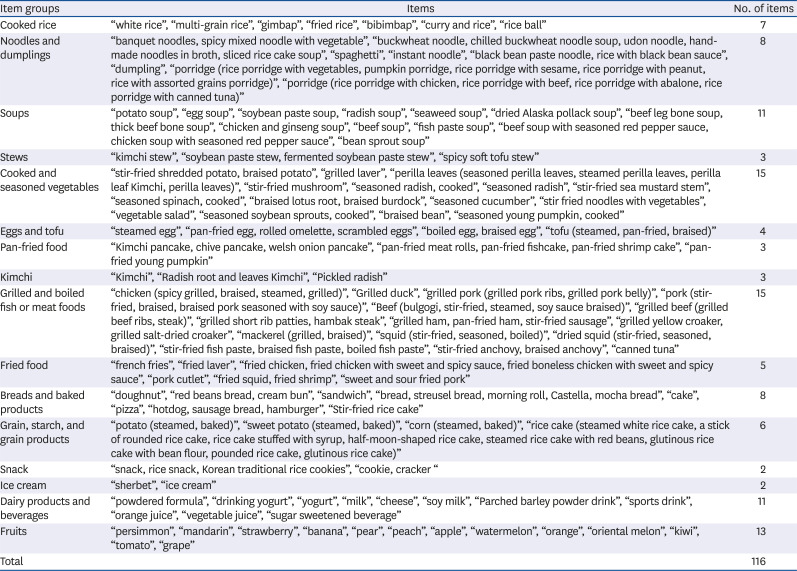
Fig. 2 shows the example of FFQ for the dietary evaluation of Korean preschool children. This FFQ examines the intake frequency and portion size for 116 items to assess the dietary intake of Korean preschool children. For calibration purpose, we added a question for the number of meals (i.e., Korean staple dishes such as rice or noodles) a day. Participants (i.e., primary caregivers) would be asked how often their children had consumed each dish item for the past month. Finally, 116 dish items were presented as shown in Table 1. Dish items of questionnaire consisted of 15 Korean staple dishes, including cooked rice and noodles, 14 soups and stews, 53 side dishes including cooked and seasoned vegetables, kimchi, grilled and boiled fish or meat foods, 8 breads and baked products, 13 dairy products and beverages, and 13 fruits.
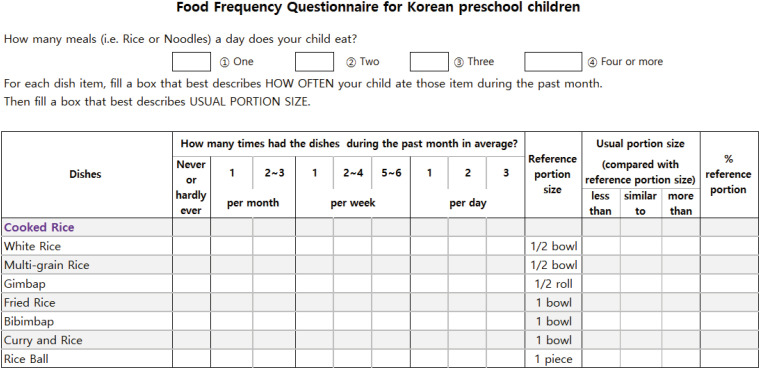 | Fig. 2Example of the food frequency questionnaire for Korean preschool children: dish items of cooked rice group.
|
Table 1
Number of items selected for the food frequency questionnaire for Korean preschool children
![]()
Frequency response section and portion sizes
Frequency response choices for dish items were “never or hardly ever,” “once a month,” “2 to 3 times a month,” “once a week,” “2 to 4 times a week,” “5 to 6 times a week,” “once a day,” “2 times a day,” and “3 times a day.” Reference portion size for each item was provided. For dish items such as “powdered formula”, “yogurt”, “milk”, “soy milk”, and “juice”, the reference portion size was determined as median value of consumed gram amount among preschool children aged 1–2 years. For other items, the reference portion size was determined as median value of preschool children aged 3–5 years. Countable items such as strawberry were given in natural units (e.g., 1, 2, and 3). Portion sizes of mixed dishes were given in specific amounts (e.g., 1 spoon, 1/3 cup, and 1 cup, etc.). In addition, we designed response choices for portion size as “less than”, “similar to”, or “more than” the reference portion size. If either “less” or “more” was selected, participants would be asked to record a percentage for the reference portion.
Nutrient database
Nutrient contents per 100 g were produced as a weighted mean value, multiplied by the intake proportion of the individual foods for each dish item. Table 2 presents examples of nutrient database. For example, energy content per 100 g of six individual foods belonging to “chicken (spicy grilled, braised, steamed, grilled)” item ranged from 111.7 kcal (“spicy braised chicken”) to 189 kcal (“grilled chicken drumsticks”). After adjusting the frequency weight of each individual food, energy content per 100 g of “chicken (braised, grilled)” item was 124.3 kcal.
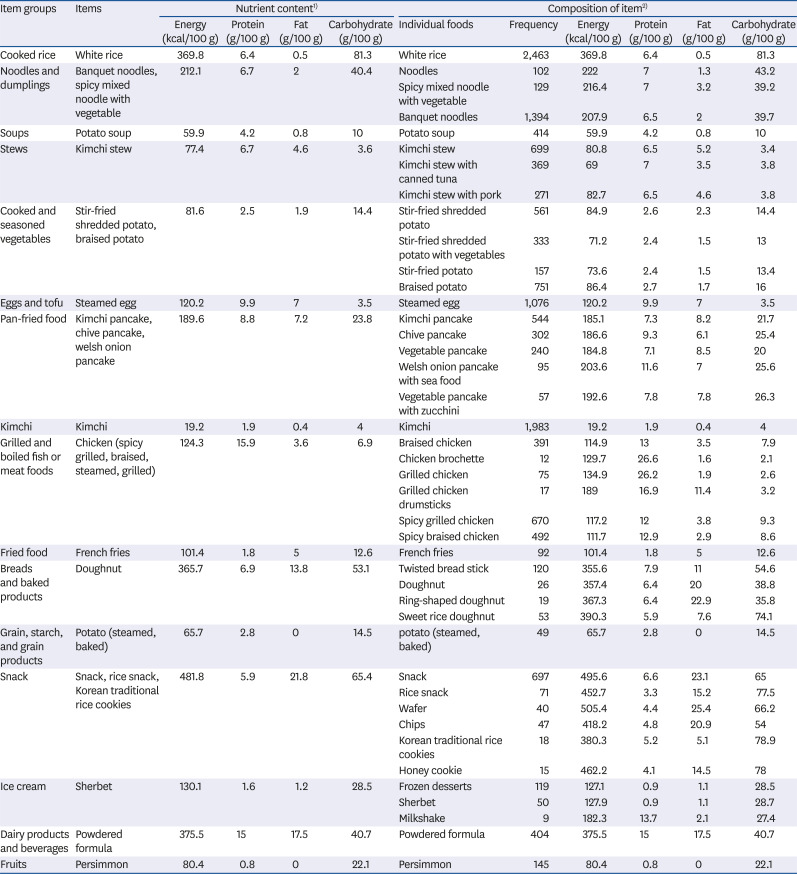
Table 2
Examples of nutrient database of food frequency questionnaire for preschool children: content of energy and macronutrients with composition of each item
1)Resulted from the nutrient composition and frequency weight of individual foods included in each item.
2)Frequencies and nutrient contents of individual food were obtained from dietary intake data of 2,766 preschool children aged between 1 and 5 years in the 2009–2013 Korea National Health and Nutrition Examination Survey.
![]()
Performance of questionnaire
Percentage coverage of energy from the selected 116 items was 89.2%; the percentage coverage of protein, fat, and carbohydrates was 88.4%, 88.2%, and 89.4%, respectively (Table 3). The percentage coverage for sodium (82.9%) was lowest, whereas those for calcium (91.4%) were highest of the minerals. In vitamins, the percentage coverage was lowest for vitamin A (87.6%) and highest for riboflavin (91.7%). The percentage coverage of the target nutrients was more than 80% in both age groups.
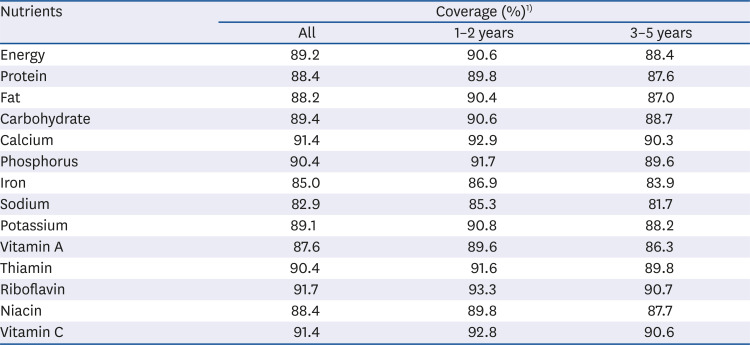
Table 3
Percentage coverage of energy and 13 nutrients from the selected 116 items in FFQ for Korean preschool children
FFQ, food frequency questionnaire.
1)Percentage coverage of each nutrient was calculated as: (Nutrient Intake Calculated from 116 Items in FFQ for Korean Preschool Children)/(Total Nutrient Intake)*100.
![]()
Go to :
DISCUSSION
Dietary intake during childhood is important for growth and health, but studies on dietary measurement tools for preschool children are limited. Our study developed an FFQ for Korean preschool children using a data-based approach. We identified dish items and portion sizes for each item of this newly developed FFQ by using the data from 2,766 preschool children aged between 1 and 5 years in the 2009–2013 KNHANES. We selected a total of 116 dish items and created nine frequency categories and three portion size response choices for each item. We compiled a nutrient composition database per 100 g for each dish item using the recipes from the 2,766 preschool children.
In order to develop a new FFQ for a group study, it is necessary to select a food list that reflects the diet of the target population. For example, in a previous study, to estimate habitual dietary intake among Japanese children, an FFQ was developed with 75 food items [11]. The food items were selected using a contribution analysis to include items that contribute greatly to energy and nutrient intake and used a multiple regressions analysis to consider the between-person variance in the nutrient intake based on the data from 586 children's dietary data [11]. In our study, we selected a list of foods using data-based method, and selected 116 items based on the dishes that contain foods resulting from the contribution analysis and variation analysis for energy and 13 nutrients using the target population dietary data. The FFQ can identify the food source that contributes to the specific nutrient intake and can also provide information on what type of dish is being consumed, including the food source, since we selected the dish items in two stages (food list selection, and dish item choices including the selected foods). For example, major food sources of iron intake among 1-5 years Korean preschool children were “white rice” and “egg.” “White rice” was mainly consumed as “cooked rice and multi-grain rice” and “egg” was mainly consumed as “fried egg, boiled egg, rolled omelet, steamed egg, and gimbap.” From this separate process of food list selection and dish item choices, extra coverage was accomplished, resulting in measuring intake of more than 87% of total consumption for most nutrients other than sodium.
Portion sizes either with multiple options or as a reference portion are necessary for calculating gram weights or nutrient intakes [20]. In a systematic review evaluating 17 studies of the FFQ validation for 12- to 36-month-old children, six studies used household measures/standard portion sizes to estimate the portion sizes, and three studies used portion sizes derived from the national nutrition survey data [5]. Our study designed the portion size with three options of “less than,” “similar to,” or “more than” the reference portion size, and in turn, we set reference portion size as a typical portion size based on the consumption distribution from the national survey data. Furthermore, a percentage of intakes compared to the reference portion size was asked if either “less” or “more” was selected. The strength of this design is its capacity to measure in detail the actual intake of participants whose eating behaviors are established during early childhood. In addition, this design is also consistent with previous research reporting correlation coefficients as being highest when subjects were able to describe their own portion size as compared with no portion size specified or portion size specified on the questionnaire [21].
Assigned recall interval of FFQ ranged from the previous seven days to the previous year for the 12- to 36-month-old children, and ranged from the previous month to the previous year for children 3 to 12 years old [51012222324]. In this study, we assigned the recall period of FFQ as the previous month. This short recall period is expected to have a good correlation with the dietary habits of the participants, but several repeated survey are needed to reflect long-term dietary habits.
To measure dietary intake using FFQs, a nutrient database is required for each food item in addition to the selected food list, portion size for each food item, and frequency of consumption for each food item. Compared with other open-ended dietary assessment methods, such as 24HDRs or food records, FFQs already had selected food items, and each item contains a variety of foods depending on the purpose of the study. Therefore, it is important to assign a nutrient value to each item to represent a composite value for the possible variants of the items queried [25]. To do this, we developed a nutrient composition database for each item of the FFQ for Korean preschool children using recipes from the national dietary survey data for the same target-age group.
Coverage rates of energy and all nutrients based on the selected dish items in the newly developed FFQ ranged from 82.9% (sodium) to 91.7% (riboflavin). Few studies are directly comparable. However, our coverage rates were similar to those from the FFQ for Japanese children aged 3–11 years [88.6% (vitamin C) to 97.8% (alpha-carotene)] [11]. In addition, the mean percentage coverage of nutrient intake was 82.4% by FFQ with 94 food items developed for Korean adults aged 30 years and older [26] and 92.3% by FFQ with 95 dish items developed for Korean adults aged 20 years and older [27].
In conclusion, this study is the first to develop a FFQ for preschool children using national data in Korea. The dietary intake of Korean preschool children can be assessed by this new data-based FFQ. In addition, the new instrument can be used to identify the nutritional needs of target groups for planning nutrition education and strategies to improve diet. Further studies are warranted to evaluate the performance of the instrument (e.g., reliability and validity).
Go to :
 XML Download