

 PDF
PDF Citation
 Print
Print


INTRODUCTION
Elderly persons (aged 65 years and older) accounted for over 14% of the total Korean population in 2017, thereby qualifying Korea officially as an “aging society.” It is predicted that in 2025, the country will become a “super-aging society,” in which the elderly population accounts for over 20% of the total population [1]. Increased longevity leads to increased incidences of cancers, metabolic diseases, and degenerative diseases, all of which cause physical and psychological problems, as well as social issues related to increased medical costs [2]. Therefore, it is essential for the elderly to maintain their health, particularly since health maintenance makes it possible for individuals to alleviate physical and psychological disorders caused by diseases and for the national government to reduce direct or indirect revenue losses.
The health status of the elderly was influenced by various factors, such as physical and environmental changes during senescence [345]. Reportedly, an older person's dietary intake affects their physical and psychological health [6], and some studies have reported that the level of food satisfaction in the elderly is significantly related to depression, loneliness, living satisfaction, and social support [7].
Many relevant studies have reported that the higher the diet quality, the lower the risks of metabolic diseases and mortality. Typical tools used for the evaluation of diet quality include the Diet Quality Index (DQI) [89], Healthy Eating Index (HEI) [10], and Healthy Diet Indicator (HDI) [1112]. Also available is a recently developed DQI for Koreans (DQI-K) that is based on that country's dietary reference intakes [13].
One of the physiological changes occurring in elderly persons is a reduction of muscular strength and/or a loss of muscle mass; a condition referred to as sarcopenia. The reason sarcopenia is a problem for the elderly is that they need a proper level of muscular strength to maintain their minimal customary physical functions [14]. In the Health, Aging and Body-Composition Study, subjects with a low level of muscular strength who were tracked and observed over a 6-month period had an increased mortality rate [15]. The most significant determinant of muscular strength is skeletal muscle mass. During aging, muscle mass can be reduced as a result of decreased physical activity, increased disease susceptibility, lowered body mass index (BMI), and many other factors; thereby, the prevalence of sarcopenia increases. Dietary intake is also known to be an influential factor. In a previous study on the relationship between sarcopenia and dietary intake, daily intake energy, and the amount of protein intake were shown to be the main factors affecting sarcopenia [16]. Moreover, diet quality was also reported to be an influential factor [1718]. An analytic study on elderly sarcopenia based on a National Health and Nutrition Examination Survey (NHANES) observed that the lower the diet quality, the higher the mortality rate [19]. In addition, a study related to sarcopenia and meal quality has been conducted to analyze the relationship between the HEI of elderly (over 60 years old) in Australia [20], and meal patterns, The Mediterranean Diet Score (MDS) and DQI-International (DQI-I) have been evaluated in a study of subjects over 65 years old in Hong Kong [18]. Unfortunately, there is little available research on the relationship between sarcopenia and diet quality in elderly Koreans. In the present study, the DQI-K, a tool for evaluating the quality of diet that reflects the Korean diet style, has been used to analyze the relationship between sarcopenia and diet quality of diet in elderly Koreans. To that end, the study used data obtained through the 2008-2011 Korea National Health and Nutrition Examination Survey (KNHANES).
SUBJECTS AND METHODS
Study subjects
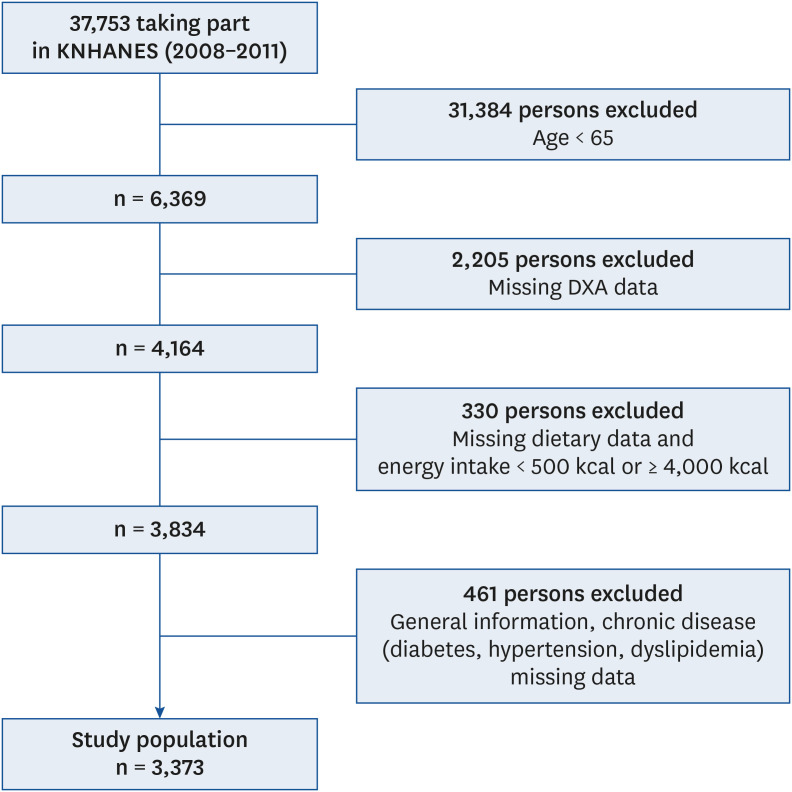
This study examined the 2008–2009 raw KNHANES data and the 2010–2011 raw KNHANES data. In those surveys, dual-energy X-ray absorptiometry (DXA) data were used to diagnose sarcopenia, but measurement of skeletal muscle mass using DXA was performed only in 2008 through 2011 in KNHANES. Among the 37,753 persons in those surveys, those aged less than 65 years (n = 31,384) and those without DXA data (n = 2,205) were excluded. In addition, subjects with unrealistic daily caloric intakes (less than 400 kcal or more than 4,000 kcal; n = 330), and those for whom there was no general information on height, weight, BMI, education status, marital status, food insecurity, or chronic disease (diabetes, hypertension, and dyslipidemia) status (n = 461) were excluded. Thus, a total of 3,373 persons were included in this study (Fig. 1). The study was conducted after being approved by the relevant Institutional Review Board of Wonkwang University (WKIRB-201902-SB-009).
Sarcopenia diagnosis
For sarcopenia diagnosis, the formula called for the division of the subject's appendicular skeletal muscle mass (ASM) by their weight (wt) and multiplying that result by 100 (ASM/wt × 100). Sarcopenia was present if the subject's result was less than one standard deviation (SD) below the sex-specific mean for a young reference group [2122]. The cutoff point for sarcopenia presence was at 30.30% of the reference group mean in men and 23.83% of that in women. The age range of the reference group (men: 1,950, women: 2,322) was 20–39 years, and that group excluded people with hypertension, hyperlipidemia, stroke, myocardial infarction, angina, arthritis, osteoarthritis, rheumatoid arthritis, tuberculosis, asthma, depression, atopic dermatitis, renal failure, diabetes, thyroid disorders, stomach cancer, liver cancer, colon cancer, breast cancer, cervical cancer, lung cancer, other cancers, hepatitis B, hepatitis C, and cirrhosis.
Evaluation of dietary intake
Dietary intake data were collected during KNHANES using the 24-hour recall method and the DQI-K [13]. The DQI-K includes eight diet-related components: 1) daily protein intake, 2) percent energy from fat, 3) percent energy from saturated fat, 4) daily cholesterol intake, 5) daily whole-grain intake, 6) daily fruit intake, 7) daily vegetable intake, and 8) daily sodium intake. The DQI-K scores fall with the range of 0–9, with 0–2 points given for daily protein intake levels and 0–1 point given for intake levels of each of the remaining seven components. If a subject's DQI-K was in the 0–4 range, diet quality was considered ‘good,’ but if it was in the 5–9 range, diet quality was judged ‘bad.’
Statistical analysis
The sample design for the data was based on the complex sample design method. In order to analyze sarcopenia factors and dietary intakes, cross-tabulation analysis and general linear modeling were performed. In order to analyze the relationship between diet quality and sarcopenia, diet-quality diagnosis (good vs. bad; nominal data) and diet-quality score (DQI-K score; continuous data) were set as independent variables, and sarcopenia diagnosis was set as the dependent variable. Multivariate logistic regression analyses were performed, including other variables. The continuous variables were age, BMI, and energy intake. The nominal variables were education (graduation from elementary school, graduation from middle school, or graduation from high school and higher), marriage (living with a spouse vs. separated, divorced or bereaved), smoking (current smoking vs. smoked or non-smoking), and muscle strength exercise (exercise vs. non-exercise). In consideration of the recent increase in the Korean population of people that are categorized as ‘super-aged,’ the study subjects were divided into 2 groups, namely those aged less than 75 years and those aged 75 and older.
The odds ratio (OR) and 95% confidence interval (CI) calculations for inter-group comparisons were based on raw or adjusted data. The variables used for logistic regression adjustment were age, BMI, energy consumption rate compared to 1,000 kcal, marriage status, education level, strength exercise, smoking status, and food insecurity. For statistical analyses, the SPSS program (version 23.0; IBM) was used. A P-value of less than 0.05 was considered to indicate statistical significance.
RESULTS
General characteristics according to sarcopenia in subjects
The general characteristics of the 3,373 study subjects are presented in Table 1. The average age of those without sarcopenia was 71.9 ± 0.1 years, while that of those with sarcopenia was 72.2 ± 0.1 years. There was no significant difference between the ages of the two groups. However, regarding BMI levels, those without sarcopenia had a mean BMI of 22.7 ± 0.1 kg/m2, and those with sarcopenia had a significantly higher BMI (25.5 ± 0.1 kg/m2; P < 0.001). Moreover, mean systolic blood pressure, diastolic blood pressure, muscle exercise status, and smoking status were all significantly different between the two groups. In both men and women, there were significant differences in body weight (P < 0.001), BMI (P < 0.001), and ASM (P < 0.001) between the sarcopenia and non-sarcopenia groups, but no significant differences in height (Supplementary Tables 1 and 2).
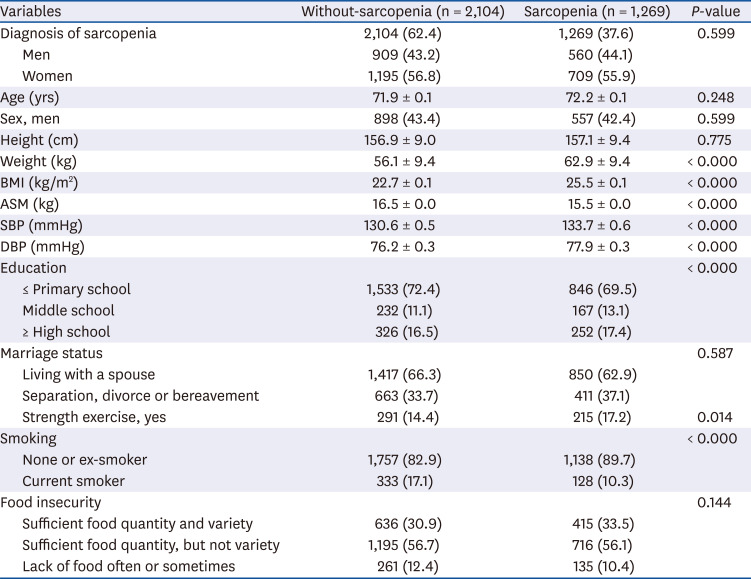
Table 1
General characteristics according to sarcopenia status in elderly Korean
Values are mean ± SE or number (%). A P-value is considered significant if below 0.05.
BMI, body mass index; ASM, appendicular skeletal muscle mass; SBP, systolic blood pressure; DBP, diastolic blood pressure.
![]()
Nutrients intake according to sarcopenia
A summary of the study subjects' nutrient intakes and diet qualities according to their sarcopenia status is presented in Table 2. Subjects without sarcopenia had significantly higher mean total energy, carbohydrate, protein, and vitamin A intakes than those for subjects with sarcopenia, but there were no significant differences among the remaining single-nutrient intake levels. Protein is considered the most important nutrient among the various dietary factors consumed by those with sarcopenia, and an individual's protein consumption should be dependent on the individual's weight. In this study, the subjects without sarcopenia consumed protein at an average of 0.94 ± 0.11 g/kg body weight while those with sarcopenia consumed a significantly lower level of protein (0.83 ± 0.13 g/kg body weight; P < 0.001).
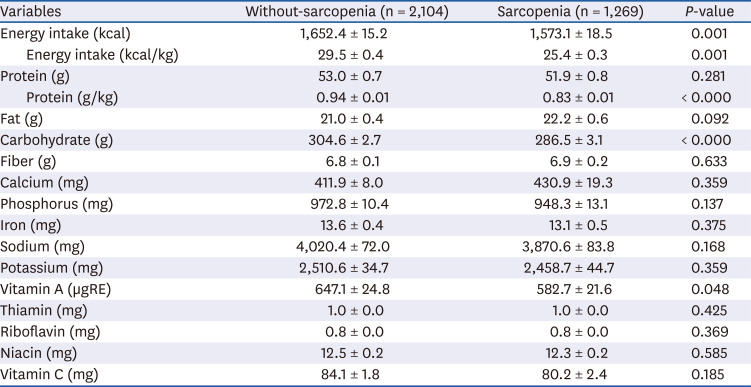
Table 2
Nutrients intake according to sarcopenia status
Values are mean ± SE. A P-value is considered significant below 0.05.
µgRE, microgram of retinol equivalent.
![]()
Components of DQI-K according to sarcopenia
A high DQI-K score is indicative of bad diet quality. The study subjects without sarcopenia had a mean DQI-K score of 3.33 ± 0.04, while the DQI-K score of those with sarcopenia was significantly higher (3.45 ± 0.04; P < 0.05). Regarding the results for each of the eight components of DQI-K, the whole-grain and vegetable intake scores in subjects with sarcopenia were significantly higher than those in subjects without sarcopenia (P < 0.05) (Table 3). Therefore, diet quality was deemed more deficient in the sarcopenia group than in the non-sarcopenia group. Moreover, among the study subjects aged 75 years and over, the total DQI-K score was significantly lower in overweight subjects with sarcopenia than in those without sarcopenia (Table 4). There was no similar difference among subjects aged less than 75 years.
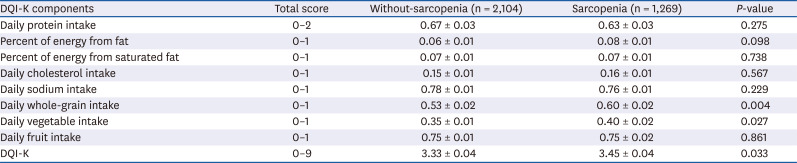
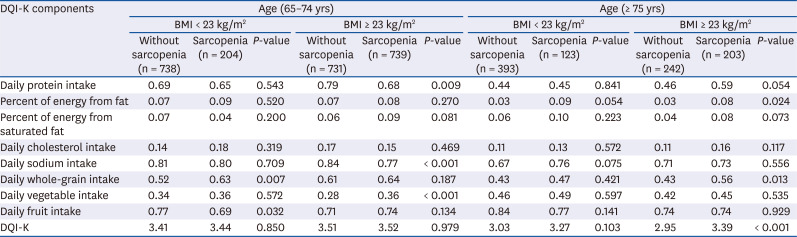
Table 3
Components of DQI-K according to sarcopenia status
Values are mean ± SE. A P-value is considered significant below 0.05.
DQI-K, Diet Quality Index for Korean.
![]()
Table 4
Components of DQI-K according to sarcopenia by age and overweight categories
Values are mean. A P-value is considered significant below 0.05.
DQI-K, Diet Quality Index for Korean; BMI, body mass index.
![]()
Relationship between sarcopenia and diet quality according to DQI-K
To analyze the relationship between diet quality and sarcopenia, logistic regression analysis was conducted, the results of which are presented in Table 5. The odds of sarcopenia presence significantly increased when the DQI-K score was high, the subjects were overweight, and they were aged 75 years and older (OR: 2.461, 95% CI: 1.114–5.440, P < 0.05). With a one-point increment in the DQI-K, the OR of sarcopenia in normal weight and overweight subjects aged 75 years and older significantly increased, 1.239 times (95% CI: 1.003–1.536, P < 0.05) and 1.303 times (95% CI: 1.057–1.606, P < 0.05), respectively. Furthermore, both men and women aged 75 and older had significantly higher ORs for the presence of sarcopenia when the DQI-K score was increased by one point (Supplementary Table 3).
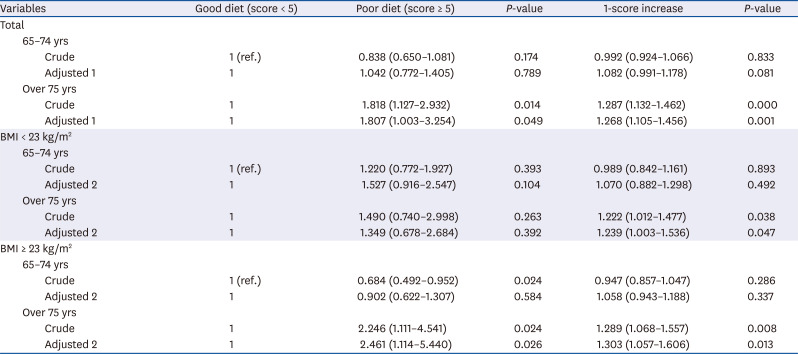
Table 5
Multiple logistic regression of sarcopenia and diet quality according to DQI-K by age and overweight categories
Logistic analysis were used to calculate the odds ratio and 95% confidence intervals. A P-value is considered significant below 0.05. Adjusted 1: age, sex, BMI, energy intake, marriages, education level, strength exercise, smoking status, food insecurity; Adjusted 2: age, sex, energy intake, marriages, education level, strength exercise, food insecurity.
DQI-K, Diet Quality Index for Korean; BMI, body mass index.
![]()
DISCUSSION
This study analyzed the 2008–2011 KNHANES data to assess the relationship between diet quality and sarcopenia in elderly Korean subjects. The data showed that sarcopenia prevalence among the assessed elderly Koreans was 37.2%. The results of the DQI-K analysis showed that, compared to the good diet-quality group, the bad diet-quality group had a higher OR of sarcopenia presence, and with a one-point increment in the DQI-K score, the OR of sarcopenia presence increased.
Sarcopenia can be defined in several ways, as its diagnostic criteria vary. Moreover, sarcopenia prevalence rates differ according to the specific criteria being used. In a study on sarcopenia diagnosis derived through the relationship between ASM divided to height and based on the 2008–2009 KNHANES, sarcopenia class 1 diagnosed based on the subject being less than 1 SD from the accounted for 18.6% of the total assessed subjects while sarcopenia class 2 mean diagnosed based on the subject being less than 2 SDs from the mean was 3.5% [23]. In the research by Chung et al. [24], who used the same KNHANES data and employed the same diagnostic method as the above-noted study, the sarcopenia prevalence rate for men was 42.0%, and that for women was 42.7%. This result was similar to that of the current study, in which men and women showed 38.1% and 37.2% sarcopenia prevalence, respectively. Therefore, as noted above, the sarcopenia prevalence rate will differ depending on the diagnostic calculation method used. The method employed in the present study was considered appropriate, given Newman et al.'s suggestion [25] that body-fat mass should be taken into consideration during sarcopenia diagnosis.
Several factors influence the presence of sarcopenia, including age, BMI, marriage and smoking status, and participation in physical activities; additionally, it has been reported that dietary intake is also an important factor [26]. Research has been done on the relationships between sarcopenia risk factors and dietary factors using the 2008–2009 KNHANES. According to this research, total energy intake, carbohydrate intake, protein intake, and fat intake are significantly high in older individuals without sarcopenia [27]. In this study, the sarcopenia and non-sarcopenia groups had significantly different education and smoking status. Although there was no significant difference in protein intake of those 2 groups, the sarcopenia group had a significantly lower protein intake per kilogram of body weight. According to the Korean Dietary Reference Intakes for Koreans (KDRI), the protein reference intake for adults and elderly persons is 0.91 g/kg/day. The subjects with sarcopenia in our study had a protein intake of 0.83 g/kg/day, significantly lower than that in those without sarcopenia and lower than the KDRI reference value. Reportedly, the muscle protein in the body undergoes increased catabolism during aging [28], and the protein intake of elderly subjects has shown a significant positive relationship with their fat-free mass [29]. For this reason, nutrition-management guidelines for elderly persons with sarcopenia emphasize increased protein intake in senescence. The research team of the Society for Sarcopenia, Cachexia, and Wasting Disease recommended increased energy intake, balanced protein intake (1–1.5 g/kg/day), and amino acid supplementation in their 2010 nutrition recommendation for sarcopenia management [30]. The European Society for Clinical Nutrition and Metabolism (ESPEN) has recommended that elderly persons without sarcopenia take in protein at a rate of 1.2–1.4 g/kg/day in order to prevent disease [31]. Recently, the Korean Geriatrics and Korean Nutrition societies recommended that elderly Koreans (aged 65 and older) should take in protein at a rate of 1.2 g/kg/day.
Since people consume several types of nutrients when eating a variety of foods during routine daily living, it is crucial to understand the relationships between nutrients and metabolism status. Compared to diets in other countries, the Korean diet has many side dishes and diverse cooking methods; thus, diet-quality evaluation is especially important in Korea. When evaluating the diet quality of elderly subjects, specific groups of people with various geriatric diseases and symptoms may be evaluated, and thereby, a particular disease or symptom may be shown to be associated with diet quality. Analytic research on the risk of hip fracture in four DQI-I groups among a large cohort of elderly Chinese urban dwellers showed that those who experienced hip fracture scored lower on the DQI-I (54 points) than those without hip fracture (60 points), with the group with high diet quality having a significantly reduced risk of hip fracture compared to the group with low diet quality [32]. In prospective research to examine the association of DQI-I with frailty in Chinese community-dwelling men and women aged ≥ 65 years, participants with a high DQI-I score had a low incidence of frailty. The authors suggest that high adherence to a good quality diet is associated with a low OR of developing frailty [33]. In research on the relationship between DQI of sarcopenia patients and their mortality rate, which used data from the 4th NHANES, the patients' DQI-I was 62.8 points, and the death hazard ratio was 0.53 (95% CI: 0.38–0.82) when their diet quality was good, even after adjusting for age, sex, BMI, living habits, and disease covariates [19].
Given the results of the above-noted studies, a poor diet quality seems to influence the older person's quality of life and various risk factors, such as fracture and frailty. In this study, we compared diet quality and sarcopenia in groups based on obesity and age. In elderly subjects aged 65–74 years, there were no different DQI-K scores for overweight subjects with or without sarcopenia and sarcopenic. However, it was shown that sarcopenic overweight elderly subjects aged 75 years and older consumed a lower quality diet than the non-sarcopenic overweight participants. Especially, overweight sarcopenic elderly persons had higher levels of all components of the DQI-K, with daily protein intake and daily whole grains intake being significantly high. Sarcopenic obesity is a high-risk elderly syndrome that is mainly observed in elderly populations at risk of synergistic complications related to sarcopenia and obesity. Previously, sarcopenic obesity has been associated with a relatively higher risk of incident disability, comorbidities, and mortality [34]. Thus, introducing dietary interventions to optimize health status, especially for sarcopenic obese elderly persons in Korea, should be considered.
In a DQI-I-based research study into diet quality and sarcopenia among elderly subjects in Hong Kong, the sarcopenia group had a significantly lower index of diet quality [18]. This result was similar to that of the present study, in which the higher the DQI-K, the greater the odds of sarcopenia presence. The items considered in the evaluation of diet quality included nutrient amounts, food intake, nutrient balance, and nutrition adequacy. The tools that have been used to evaluate diet quality in many related studies include the DQI, HEI, and HDI, which were developed by applying the US guidelines for dietary living, the US nutrition reference intakes, and the WHO guidelines for chronic disease prevention [89101112]. It has been reported that the DQI is related to the cardiovascular disorder prediction index [35], metabolic syndrome [36], and cancer mortality rate [37]. However, the DQI fails to reflect the dietary patterns of all countries or groups, and therefore, modified DQI models for specific countries and groups have been developed [3839]. In Korea, the DQI-K, a modified version of the DQI, was developed to reflect the specific nutrition reference intakes of Koreans. An increase in DQI-K has been correlated with an increase in mortality [13]. Therefore, it is necessary to evaluate diet quality according to specific groups or diseases in Korea. In the present study, elderly individuals with sarcopenia had significantly high DQI-K scores. On that basis, overall diet quality is considered to be a significant factor that can influence the development of sarcopenia. In particular, in Koreans aged 75 and older, a poor diet quality increased the odds of sarcopenia presence, even after adjusting for other factors that can influence the development of sarcopenia. Accordingly, in order to improve the diet quality of those aged 75 and older, it is necessary to develop detailed guidelines on what comprises a good diet and to establish a dietary living improvement policy suitable for the community of interest. Additionally, in previous research into the dietary patterns of those aged 85 years and older according to protein intake levels, the group whose protein intake was less than 1 g/kg/day showed no significant relationship between sarcopenia and dietary pattern, but in the group whose protein intake was at least 1 g/kg/day, the presence of sarcopenia was dependent on dietary pattern [40]. Given that result and the results of the present study, the association of diet quality and sarcopenia is considered to be influenced by the level of protein intake. In order to develop detailed guidelines for sarcopenia-appropriate nutrition management for the elderly, it will be necessary to complete further research into the diet quality of the Korean elderly according to protein intake.
This study had several limitations. This study analyzed the relationship between sarcopenia and diet quality in subjects aged 65 and older using 2008–2011 KNHANES data obtained via a cross-sectional design. Therefore, it will be necessary to conduct prospective research into this relationship by using domestic open tracking and observation data in order to reveal the causal relationship fully. As well, there is a need to conduct comparative research into the influence of the DQI-K and the factors that trigger sarcopenia. Another limitation of our study is that dietary data were obtained using the 24-hour recall method, which does not reflect the subjects' dietary habits fully. Nevertheless, this study is meaningful in that it made use of the DQI-K (developed to apply nutrition reference intakes of Koreans to the DQI, the validity of which had already been proved in many other countries), and, thereby, revealing that it was suitable for examining the relationship between diet quality and sarcopenia in elderly Koreans. Finally, another limitation is that muscle strength was not considered during the diagnosis of sarcopenia. Nevertheless, the strength of our research is that it shows that the DQI-K, which reflects the traditional Korean diet, can be used to examine the association of diet with sarcopenia in elderly persons. Thus, the DQI-K can provide basic data that is useful in the assessment of dietary education strategies against sarcopenia.
In all stages of a lifecycle, a balanced diet is essential. Elderly persons can have difficulty with maintaining a good quality diet due to a variety of personal, social, and environmental factors. The results of this study show that an appropriate and balanced dietary intake can help prevent sarcopenia in elderly persons. In particular, the results of this study will be useful fundamental data when formulating a dietary intervention plan that will prevent sarcopenia among Koreans aged 65 years and older.
 XML Download