

 PDF
PDF Citation
 Print
Print


INTRODUCTION
The liver has a vital role in metabolic transformations, including the synthesis, storage, degradation, and detoxification of substances necessary for survival, and it is susceptible to damage by various chemicals or exogenous substances. The leading causes of liver damage include infection, alcohol consumption, fatty liver due to obesity, and hepatotoxicity caused by drugs [12]. When hepatocytes are damaged, different cytokines and reactive oxygen species (ROS) are produced via interactions between hepatic stellate cells and Kupffer cells. As a result, the activated hepatic stellate cells produce extracellular matrix (ECM), and the liver is converted to a fibrotic state [3]. In general, hepatic fibrosis has no nodules and, typically, can be recovered if the cause of liver damage is removed; however, if the liver fibrosis process is repeated, it progresses to nodular cirrhosis [45]. Therefore, there is a need to develop liver damage protective or therapeutic agents with antioxidant and hepatic fibrosis suppressing mechanisms, and such agents can be derived from natural products.
D-galactosamine (GalN) is well known to show hepatotoxicity similar to that of human viral hepatitis and is widely used in animal models of liver damage [6]. Hepatotoxicity by GalN has been reported to be associated with ROS and oxidative stress, and it can cause inflammation of hepatic parenchymal cells and portal veins and cause hepatocellular necrosis due to metabolic disorders [67].
Korean ginseng (Panax ginseng C. A. Meyer) is a source of traditional medicines that have been used for thousands of years in East Asia, including Korea. Many researchers have demonstrated beneficial effects of ginseng, such as improving immunity, decreasing fatigue, memory impairment, and oxidative stress, and altering blood sugar and cholesterol levels [8910]. Ginsenoside is a representative, physiologically active substance of Korean ginseng. In Korean ginseng, it is known that acidic malonyl ginsenosides, in which the carboxyl group of malonic acid is ester-bonded to neutral ginsenoside, account for 35% to 60% of the total ginsenoside content [1112]. Malonyl ginsenoside has been noted for its efficacy in alleviating hyperglycemia, hyperlipemia, and insulin resistance in animal models of type 2 diabetes [13]. However, malonyl ginsenosides have been largely ignored in ginsenoside analysis because they are acidic, making them temperature sensitive, difficult to purify, and easily decomposed [1314]. A protective effect against carbon tetrachloride (CCl4)-induced liver damage from a ginseng mixture essence extracted with steam at 105°C was reported by Lu et al. [15]. Antioxidant effects of red ginseng extract and neutral ginsenoside produced by high-temperature treatment have been reported by many researchers [15161718]. In previous studies [14], we observed that the acid malonyl ginsenosides in ginseng are mostly converted to neutral ginsenosides by steaming at high temperatures. By extracting dried white ginseng at a low temperature, we prepared GS-KG9, a ginseng extract containing a high concentration of malonyl ginsenoside.
The purpose of this study was to evaluate the feasibility of using GS-KG9 as a functional food substance by determining its hepatoprotective effect in a GalN-induced liver injury animal model and assessing the antioxidant mechanism in the inhibitory effect on hepatic inflammation.
Go to : 
MATERIALS AND METHODS
Materials
Dulbecco's modified Eagle's medium (DMEM) and fetal bovine serum (FBS) were purchased from Gibco (Grand Island, NY, USA) and the penicillin-streptomycin mixture was obtained from Hyclone (Logan, UT, USA). Thiazolyl blue tetrazolium bromide, dimethyl sulfoxide (DMSO), silymarin, D-(+)-galactosamine hydrochloride, and 3-(4,5-dimethylthiazol-2-yl)-2,5-diphenyltetrazolium bromide (MTT) were obtained from Sigma (St, Louis, MO, USA). Hydrogen peroxide (H2O2) and glutathione peroxidase (GPX) assay kits were provided by Merck (Kenilworth, NJ, USA) and Oxford Biomedical Research (Rochester Hills, MI, USA), respectively. Catalase (CAT) was obtained from Cayman Chemical (Ann Arbor, MI, USA), and superoxide dismutase (SOD) was obtained from Dojindo (Kumamoto, Japan). All other chemicals were of analytical grade and were purchased from Sigma.
Preparation of GS-KG9
The Korean ginseng (Panax ginseng C. A. Meyer) used for the experiment was purchased from Wooshin Industrial Co., Ltd. (Geumsan, Korea). The ginseng specimen was deposited in the International Ginseng and Herb Research Institute (No. GS201503). The white ginseng was extracted twice using a low-temperature vacuum extractor at 40°C in a 70% alcohol solution, concentrated under reduced pressure, and lyophilized. The ginseng extract powder with a ginsenoside Rg1 and Rb1 combined content of 12 ± 2.4 mg/g was named GS-KG9.
HPLC analysis
Five hundred milligrams of GS-KG9 powder were melted in 50 mL of 70% methanol (MeOH) and filtered by a 0.45 µm membrane filter after extraction with ultrasonic waves for 15 min, and then analyzed by using high-performance liquid chromatography (HPLC). The HPLC system comprised an Agilent Technologies 1260 Infinity (Agilent Technologies, Santa Clara, CA, USA) with a photodiode array detector (PDA) and a Kinetex C18 column (250 mm × 4.6 mm, 5 µm, Kinetix, New York, NY, USA). The detection wavelength, flow rate, injection volume, and column oven temperature were set at 203 nm, 1.0 mL/min, 10 µL, and 30°C, respectively. The mobile phase consisted of purified water (A) and acetonitrile (B), and the gradient program used was: 0 min 20% B, 5 min 20% B, 20 min 23% B, 25 min 30% B, 45 min 40% B, 55 min 50% B, 65 min 50% B, 70 min 20% B, and 75 min 20% B.
Cell culture
The human hepatoma cell line HepG2 was obtained from the American Type Culture Collection (Manassas, VA, USA). The HepG2 cells were subcultured in DMEM-high glucose medium containing 10% (v/v) heat-inactivated FBS and 1% (v/v) penicillin-streptomycin at 3-day intervals in a 5% CO2, 37°C humidified incubator (Sanyo Electronic, Osaka, Japan).
Measurement of cell viability
Cell viability was determined using the MTT assay according to the manufacturer's instructions (Sigma-Aldrich, St Louis, MO, USA). HepG2 cells were dispensed in 96-well plates at a density of 5 × 10⁴ cells per well and stabilized in a 5% CO2, 37°C incubator for 24 h in DMEM. GS-KG9 was treated at concentrations of 0, 50, 100, 300, 500, 700, or 1,000 µg/mL, and the group not treated with the extract was set as the control group. After 24 h of culture, the medium was removed, and 100 µL of fresh medium was added, followed by stabilization for 30 min in a 5% CO2, 37°C incubator. After adding 50 µL of MTT solution (2 mg) and reacting for 5 h in a 5% CO2, 37°C incubator, the medium was removed, and 150 µL of DMSO was added, and the mixture reacted at room temperature for 20 min to dissolve the insoluble formazan crystals. Absorbance was measured with a multi-mode microplate reader (Molecular Devices, San Jose, CA, USA) at a wavelength of 540 nm.
Determination of ROS
Intracellular ROS levels were determined according to the manufacturer's instruction (Invitrogen, Carlsbad, CA, USA). Briefly, HepG2 cells were dispensed at 5 × 10⁴ cells per well in 96-well plates and pretreated with GS-KG9 at 0, 25, 50, 100 µg/mL. After incubation for 24 h, FBS-free medium was added to the wells for 30 min. Then 10 µM 2′,7′-Dichlorofluorescein diacetate (DCFH-DA) was added, and the subsequent reaction was carried out in a 37°C incubator for 30 min. After treatment with 30 µM GalN, the cells were washed three times with PBS. Fluorescence was monitored with a multi-mode microplate reader (Molecular Devices) at an excitation wavelength of 485 nm and an emission wavelength of 530 nm. The ROS generation percentage was calculated as follows: (A485/535 of treated cells/A485/535 of untreated cells) ×100.
Protein extraction and western blot analysis
The cells were cultured under standard conditions with or without GS-KG9. The cells were washed with cooled PBS and lysed with radioimmunoprecipitation assay buffer (RIPA, Thermo Sci, USA) containing 1% protease and a phosphatase inhibitor cocktail (Sigma-Aldrich). The cell lysates were centrifuged at 10,000 ×g for 60 min at 4°C to collect only the supernatant. Protein levels were measured using a Lowry protein assay Kit (BIO-RAD, Hercules, CA, USA). Standard protein samples were quantified using bovine serum albumin. Equal amounts of proteins were separated by 10% sodium dodecyl sulfate-polyacrylamide gel electrophoresis (SDS-PAGE), and the separated proteins were transferred onto a nitrocellulose membrane (Amersham, UK). The transferred protein membranes were blocked with 5% skim milk for 1 h, followed by incubation with specific primary antibodies, such as β-actin, nuclear factor erythroid-2-related factor 2 (Nrf2), and heme oxygenase-1 (HO-1), overnight at 4°C. Membranes were then washed four times with Tris Buffered Saline with Tween 20 (TBS-T) buffer for 5 min. Horseradish peroxidase (HRP)-conjugated anti-rabbit immunoglobulin G (Santa Cruz Biotechnology, Inc., Santa Cruz, CA, USA) was diluted 1:2,000 in blocking buffer and allowed to react at room temperature for 2 h. After washing four times with TBS-T (0.1% Tween) for 5 min, select enhanced chemiluminescence (ECL) western blotting detection reagents (GE Lifesciences, Buckinghamshire, UK) were mixed at a 1: 1 ratio. The blots were detected using ChemiDoc XRS™ with Image Lab software (Bio-Rad, Hercules, CA, USA).
Design of animal experiment
Five-week-old male Sprague-Dawley rats (180 ± 20 g, n = 60) were purchased from Raon Bio Inc (Yongin, Korea). The rats were fed standard rat chow and given water ad libitum in a temperature- (22 ± 2°C) and humidity- (50 ± 5%) controlled setting with a 12 h light/dark cycle. All experiments were carried out following the Guidelines for the Institutional Animal Care and Use Committee of International Ginseng & Herb Research Institute and approved by the same committee (2016-A01). All animals were acclimatized on a normal diet for 1 week. The rats were then randomly divided into six groups as follows (n = 10 per group): 1) normal group (0.9% NaCl); 2) GalN group (0.9% NaCl); 3) GalN + silymarin 25 mg/kg group; 4) GalN+GS-KG9 300 mg/kg group; 5) GalN+GS-KG9 500 mg/kg group; 6) GalN+GS-KG9 700 mg/kg group. All animals were orally administered the allocated treatment once a day for 2 weeks. Ga1N diluted in physiological saline was intraperitoneally administered at a concentration of 650 mg/kg, 2 h after the last dose of each treatment. On day 4 after the final GalN treatment, all animals were fasted overnight and sacrificed for further analysis (Fig. 1).
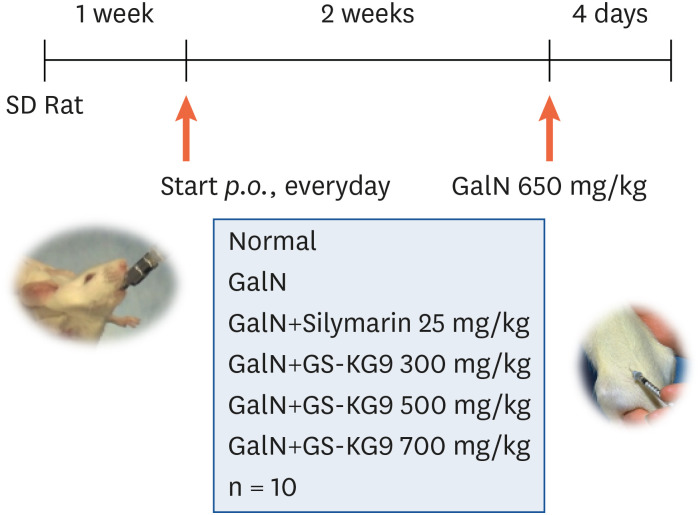 | Fig. 1Schematic diagram of the experimental protocol. Rats were acclimatized on a normal diet for 1 week and then they were divided into 6 groups of ten animals each. They were orally administered the allocated samples once a day for 2 weeks. Each rat was intraperitoneally administered D-galactosamine 650 mg/kg and then all animals were sacrificed for further analysis on day 4 after D-galactosamine treatment.
|
Body and liver weights and liver index
The body weight of the experimental animals was measured at 2-day intervals during the study period. After blood collection from the abdominal aorta of a sacrificed rat, the liver was collected and washed with physiological saline. Liver weight was measured after removal of washing solution with filter paper. The liver index was calculated using the formula:
Serum biochemical analysis
Blood samples collected from the abdominal aorta were incubated for 30 min at room temperature in serum-separating tubes (BD Vacutainer, Plymouth, UK). Serum was obtained by centrifugation at 1,500 ×g for 10 min. Serum alanine aminotransferase (ALT), aspartate aminotransferase (AST), alkaline phosphatase (ALP), and lactate dehydrogenase (LDH) levels were determined by using an automatic biochemical analyzer (DRI-CHEM 3000s; Fujifilm, Tokyo, Japan). All assays were conducted in duplicate using fresh serum.
Histopathological analysis
Liver samples collected from rats underwent histopathological analysis and antioxidant enzyme activity testing after liver weight measurement. Liver specimens excised from different lobes were fixed in 10% neutral buffered formaldehyde, washed, dehydrated in gradient ethanol, embedded in paraffin. Tissue sections were stained with hematoxylin & eosin (H&E, Sigma-Aldrich) to observe their general histological structure. To observe the degree of fibrosis of liver tissue, Masson's trichrome (MT; ScyTek Laboratories, Inc., West Logan, UT, USA) staining, a collagen fiber staining method, was performed. Immunohistochemical staining with α-smooth muscle action (α-SMA; Novus Biologicals, Centennial, CO, USA) and transforming growth factor-β1 (TGF-β1; Novus Biologicals) was performed to confirm liver fibrosis following cirrhosis. After dehydration and encapsulation, performed according to the general method, sections were observed by a pathologist at 100× magnification using an optical microscope. Histological indices of hepatic inflammation, necrosis, and fibrosis were quantified by an experiment-blinded veterinary pathologist at the Department of Oral Pathology, School of Dentistry, Jeonbuk National University, South Korea. Indices were based on numerical scoring of liver biopsy specimens with liver damage graded on a scale of 0–4 (0 = none, 1 = slight, 2 = mild, 3 = moderate, and 4 = remarkable).
Antioxidant enzyme activity measurement
Liver tissue was homogenized in 5 mL/g of cold buffer comprised of 50 mM Tris-HCl at pH 7.5 with protease inhibitor, 5 mM ethylenediaminetetraacetic acid (EDTA), and 1 mM 2-mercaptoethanol added. The supernatant was collected by centrifugation at 10,000 ×g for 15 min at 4°C and stored at −70°C. GPx activity was measured according to the method proposed by Oxford Biomedical Research. Briefly, GPx activity for each sample was calculated by dividing the change in absorbance at 340 nm by the nicotinamide adenine dinucleotide phosphate (NADPH) extinction coefficient of 6220 M−1 cm−1. SOD activity was measured according to the method proposed by Dojindo Molecular Technologies, Inc. The liver tissue was homogenized in sucrose buffer (0.25 M sucrose, 10 mM Tris, 1 mM EDTA; pH 7.4) with added protease inhibitor, and the supernatant was collected by centrifugation at 15,000 ×g for 30 min at 4°C. Briefly, the reaction mixture was buffered with 200 µL WST solution (2-(4-lodophenyl)-3-(4-nitrophenyl)-5-(2,4-disulfophenyl)-2H-tetrazolium, monosodium salt) and 20 µL of dilution buffer. After pre-incubation for 30 min, the reaction was initiated by adding 20 µL of tissue lysate and the enzyme working solution (15 µL enzyme solution with 2.5 mL dilution buffer). The absorbance of the reaction mixture was measured at 450 nm using the microplate reader. CAT activity was measured according to the method proposed by Cayman Chemical Company (Ann Arbor, MI, USA). The liver tissue was homogenized in 1.5 mL cold buffer (50 mM potassium phosphate and 1 mM EDTA, pH 7) and centrifuged at 10,000 ×g for 15 min at 4°C. The supernatant was used for the assay; briefly, 100 µL of diluted assay buffer and 30 µL of methanol were added, and the reaction was initiated by adding 20 µL of diluted H2O2. The plate was then covered and incubated at room temperature for 20 min. Thirty µL of diluted potassium hydroxide was added to terminate the reaction along with 30 µL of catalase Purpald as the chromogen. The plate was then incubated for 10 min at room temperature on a shaker before 10 µL of catalase potassium periodate were added to each well. Wells were covered with a plate cover and the plate incubated for 5 min at room temperature on a shaker. The formaldehyde produced from these reactions was measured at an absorbance of 540 nm. The time reaction of this color change was quantified as CAT activity in the sample compared to a standard curve.
Statistical analysis
Data are expressed as mean ± SE values. One-way analysis of variance followed by Dunnett's post hoc test (SPSS version 21) was applied to study the relationships between variables. P < 0.05 was considered to indicate statistical significance.
Go to :
RESULTS
Ginsenoside content of GS-KG9
The indicator components of Panax ginseng in Korea are the ginsenosides Rg1 and Rb1. The ginseng extract powder with a ginsenoside Rg1 and Rb1 combined content of 12 ± 2.4 mg/g was named GS-KG9. The ginsenoside Rg1 and Rb1 content of GS-KG9 used for this experiment were 3.65 mg/g and 9.03 mg/g, respectively.
Body weight gain and liver weight
The body weight gains, liver weights, and liver indices for the various experimental groups are shown in Table 1. Body weight gain was higher in the GalN, GalN+Silymarin, and the three GalN+GS-KG9 groups than that in the normal group, but there were no statistically significant differences. Both liver weight and liver index were lowest in the GalN group, and the groups treated with Ga1N and GS-KG9 or Silymarin showed tendencies to restore the liver weight and liver index reduction caused by GalN, but there were no significant differences in liver weight or index among the 6 groups.
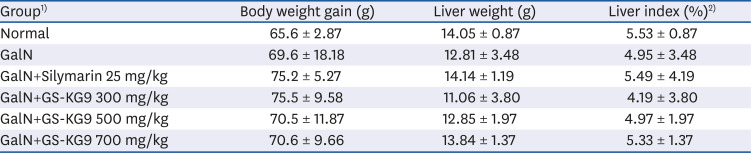
Table 1
Body weight gain, liver weight, and liver index of rats fed experimental diets for 2 weeks
Data are presented as mean ± SE (n = 10).
1)Normal, vehicle (0.9% NaCl); GalN, D-galactosamine 650 mg/kg, vehicle (0.9% NaCl); GalN+silymarin 25 mg/kg, Silymarin 25 mg/kg treated and GalN-induced liver damage group; GalN+GS-KG9 300 mg/kg, GS-KG9 300 mg/kg treated and GalN-induced liver damage group; GalN+GS-KG9 500 mg/kg, GS-KG9 500 mg/kg treated and GalN-induced liver damage group; GalN+GS-KG9 700 mg/kg, GS-KG9 700 mg/kg treated and GalN-induced liver damage group.
2)Liver index (%) = (Liver Weight/Body Weight) × 100.
![]()
Serum hepatic enzyme activities
Serum biochemical analysis was performed to evaluate the effects of the GS-KG9 treatments on liver injury in GalN-treated rats (Fig. 2). Serum ALT and AST levels were significantly increased in the GalN group compared to that in the normal group (normal and GalN: 48.2 ± 6.5 U/L and 281.9 ± 25.1 U/L and 58.5 ± 4.5 U/L and 317.4 ± 28.2 U/L, respectively). However, GS-KG9 pretreatment of GalN-treated rats significantly lowered the ALT and AST levels (ALT: GS-KG9 300, 500, 700 mg/kg groups, 108.3 ± 48.4 U/L, 50.7 ± 11.6 U/L, 52.0 ± 6.0 U/L, respectively; AST: GS-KG9 300, 500, 700 mg/kg groups, 144.2 ± 18.8 U/L, 63.5 ± 16.8 U/L, 58.4 ± 6.1 U/L, respectively). The level of ALT and AST of the silymarin+Ga1N group (62.4 ± 11.6 U/L and 79.1 ± 17.1 U/L) were significantly lower than those of the GalN group. Serum ALP levels in the GalN group were significantly elevated compared to that in the normal group (normal and GalN: 1,167 ± 196 U/L and 2,012 ± 81 U/L, respectively). In contrast, GS-KG9 groups (GS-KG9 300, 500, and 700 mg/kg group, 1,560 ±218 U/L, 925 ± 125 U/L, and 951 ± 261 U/L, respectively) and the silymarin+Ga1N group (1,478 ± 162 U/L) exhibited significantly lower ALP enzymatic activity levels than that in the GalN group (2,012 ± 81 U/L). LDH is a marker of liver damage as it is released upon liver injury. Compared to the normal group (77.9 ± 22.3 U/L), LDH activity was significantly increased in the GalN group (269.4 ± 30.5 U/L). However, compared to the Ga1N group level, LDH levels were significantly decreased in groups treated with all concentrations of GS-KG9 (GS-KG9 300, 500, and 700 mg/kg groups, 107.7 ± 34.2 U/L, 76.4 ± 17.5 U/L, and 86.0 ± 13.1 U/L).
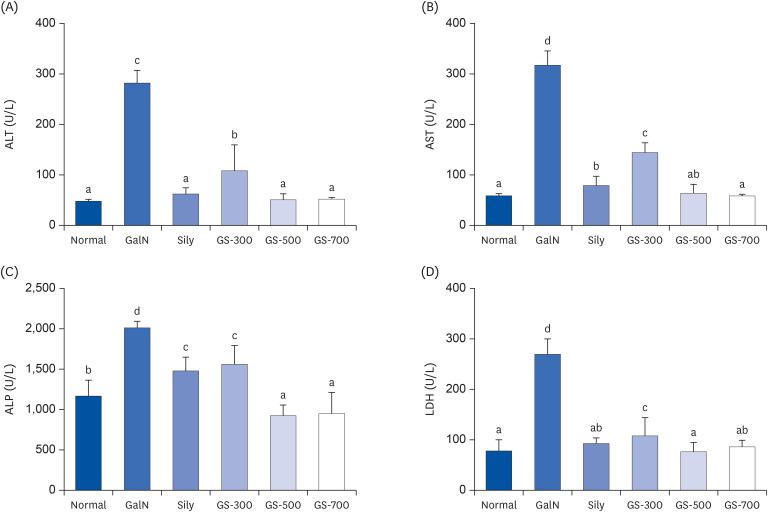 | Fig. 2Effects of GS-KG9 on serum hepatic enzyme activities of rats with D-galactosamin-induced liver damage: (A) serum ALT, (B) serum AST, (C) serum ALP, and (D) serum LDH. Data are represented as the mean ± SE (n = 10). Values with different superscript letters are significantly different among groups according to a one-way analysis of variance coupled with Dunnett's multiple-range test (P < 0.05).ALT, alanine aminotransferase; AST, aspartate aminotransferase; ALP, alkaline phosphatase; LDH, lactate dehydrogenase; GalN, D-galactosamine-induced liver damage group; Sily, Silymarin 25 mg/kg treated and GalN-induced liver damage group; GS-300, GS-KG9 300 mg/kg treated and GalN-induced liver damage group; GS-500, GS-KG9 500 mg/kg treated and GalN-induced liver damage group; GS-700, GS-KG9 700 mg/kg treated and GalN-induced liver damage group.
|
Hepatic antioxidant enzyme activities in the animal model
To determine the effects of GS-KG9 on the antioxidant defense system, the activity levels of the antioxidant enzymes SOD, CAT, and GPx were measured in the livers of normal and GalN-treated rats (Fig. 3). The activities of these enzymes were significantly decreased in the GalN group compared to that in the normal group. GS-KG9 administration to Ga1N-treated rats significantly restored the antioxidant enzyme activities of SOD, CAT, and GPx from the Ga1N-reduced level in a concentration-dependent manner. Silymarin, used as a positive control, also improved these antioxidant enzyme activities from the Ga1N-reduced level. These enzyme activities of the three GS-KG9-treated groups were similar to that of the silymarin-treated group.
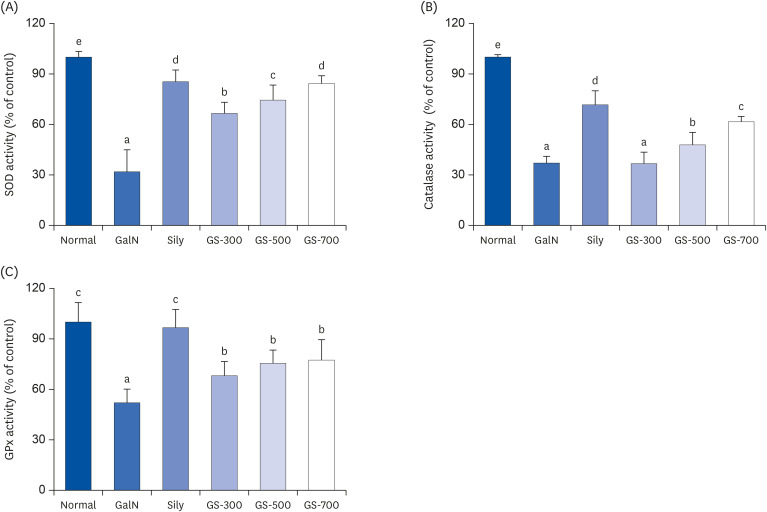 | Fig. 3Effects of GS-KG9 on liver antioxidant enzyme activities of rats with D-galactosamin-induced liver damage. (A) SOD activity, (B) CAT activity, (C) GPX activity. Data are represented as the mean ± SE (n = 10). Values with different superscript letters are significantly different among groups according to a one-way analysis of variance coupled with Dunnett's multiple-range test (P < 0.05).SOD, superoxide dismutase; CAT, catalase; GPX, glutathione peroxidase; GalN, D-galactosamine-induced liver damage group; Sily, Silymarin 25 mg/kg treated and GalN-induced liver damage group; GS-300, GS-KG9 300 mg/kg treated and GalN-induced liver damage group; GS-500, GS-KG9 500 mg/kg treated and GalN-induced liver damage group; GS-700, GS-KG9 700 mg/kg treated and GalN-induced liver damage group.
|
Antioxidant mechanism in HepG2 cells
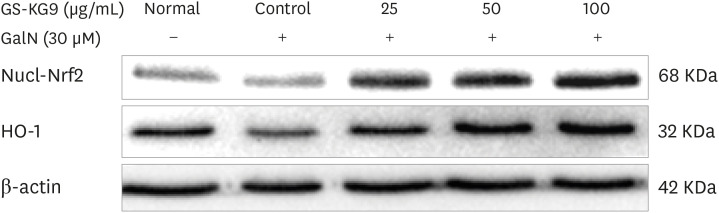
We examined whether GalN induced ROS production and GS-KG9 inhibited ROS production in hepatocyte HepG2 cells (Fig. 4). As shown in Fig. 4A and B, GS-KG9 treatment produced no change in cell viability up to a concentration of 500 ug/mL while GalN at 100 µM showed 95% cell viability. GalN-induced ROS production in HepG2 cells increased until the GalN concentration reached 30 µM and remained relatively constant thereafter. The GalN-induced ROS production was inhibited by 9.8%, 19.1%, and 28.5% following GS-KG9 treatment at concentrations of 25, 50, and 100 µg/mL, respectively. We also examined whether the treatment of GS-KG9 changed Nrf2 and HO-1 protein expressions in GalN-treated HepG2 cells. Nuclear Nrf2 and HO-1 protein expression levels were significantly decreased when HepG2 cells were treated with GalN. However, GS-KG9 treatment significantly recovered the Ga1N-reduced expression levels of Nrf2 and HO-1 proteins (Fig. 5).
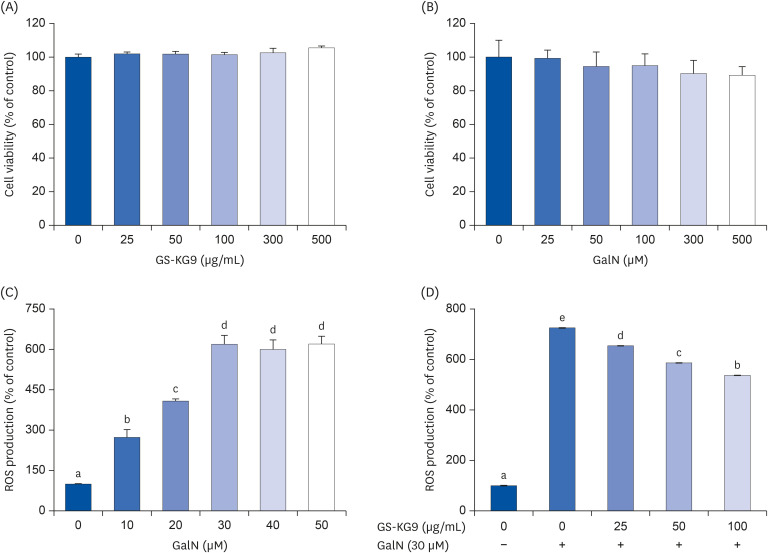 | Fig. 4Inhibitory effects of GS-KG9 on ROS production in hepatocyte HapG2 cells. (A) cell viability of GS-KG9 in HapG2 cells, (B) cell viability of D-galactosamine in HapG2 cells, (C) ROS production induced by D-galactosamine in HapG2 cells, (D) Inhibitory effects of GS-KG9 on D-galactosamine-induced ROS production in HapG2 cells. Data are represented as the mean ± SE (n = 5). Values with different superscript letters are significantly different among groups according to a one-way analysis of variance coupled with Dunnett's multiple-range test (P < 0.05).ROS, reactive oxygen species; GalN, D-galactosamine.
|
Histopathological analysis
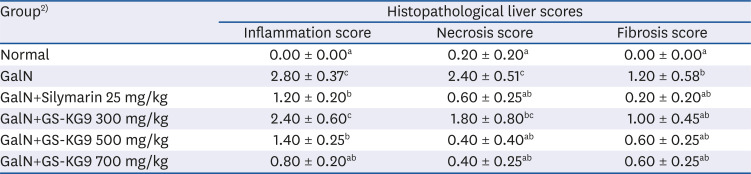
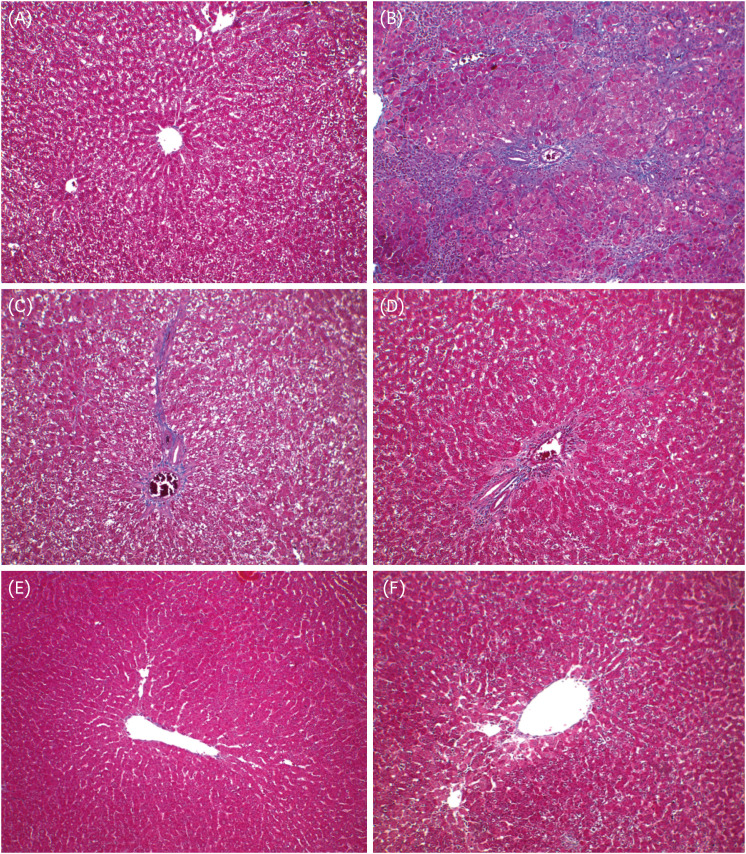
The results of H&E staining to examine the effects of GS-KG9 on GalN-induced morphological changes are shown in Fig. 6. The H&E staining results did not reveal morphological microstructure changes between the hepatic portal vein and the hepatic acinus in the normal group, whereas infiltration of inflammatory cells, hepatocellular expansion, and large vacuoles related to degeneration and accumulation of fat in and around the portal vein were frequently observed in the GalN group. The indications of inflammatory lesions, including vacuoles, in the GS-KG9- and silymarin-treated groups were improved compared to those of the GalN group. In particular, vacuoles by fat accumulation and necrosis by liver injury were not observed in the 500 mg/kg GS-KG9 group. MT staining was used to observe collagen deposition. The normal group showed only a small amount of collagen deposition, which is normal in the portal vein, but the GalN group showed severe collagen deposition in and around the portal vein. The GS-KG9 and silymarin groups showed significantly less hepatic fibrosis due to collagen accumulation compared to that in the GalN group (Fig. 7). As shown in Fig. 8, α-SMA was expressed only in vascular smooth muscle in the normal group, whereas it was widely and notably observed between the portal vein and perisinusoidal cells in the GalN group. In the GS-KG9 groups, α-SMA expression was improved compared to those in the GalN and silymarin groups. In particular, α-SMA in the GS-KG9 500 mg/kg group was at a level similar to that of the normal group. Fig. 9 shows the immunohistochemical staining results of TGF-β1 expression level measurement. TGF-β1 was not observed in the normal group but was seen around the portal vein in the GalN group. TGF-β1 expression levels in the silymarin, GS-KG9 300 mg/kg, and GS-KG9 700 mg/kg groups were improved compared to that in the GalN group, but TGF-β1 was still present. However, in the GS-KG9 500 mg/kg group, TGF-β1 was not observed similar to its absence from the normal group. Hepatic inflammation, necrosis, and fibrosis in the periphery of the portal tracts were evaluated by using H&E and MT stains, and the observations were scored by an experiment-blinded veterinary pathologist. As shown in Table 2, scores of the liver portal peripheral inflammation, necrosis, and fibrosis in the GalN group (2.80 ± 0.37, 2.40 ± 0.51, and 1.20 ± 0.58, respectively) were remarkably higher than those of the normal group (0.00 ± 0.00, 0.20 ± 0.20, and 0.00 ± 0.00, respectively). The scores for inflammation (1.40 ± 0.25 and 0.80 ± 0.20, respectively), necrosis (0.40 ± 0.40, 0.40 ± 0.25), and fibrosis (0.60 ± 0.25, 0.60 ± 0.25) in the GS-KG9 500 mg/kg and GS-KG9 700 mg/kg groups were significantly lower than those of the GalN group and were similar to the scores of the silymarin group (1.20 ± 0.20, 0.60 ± 0.25, 0.20 ± 0.20, respectively). Therefore, GS-KG9 administration inhibited GalN-induced hepatic inflammation, necrosis, and fibrosis in the study rats.
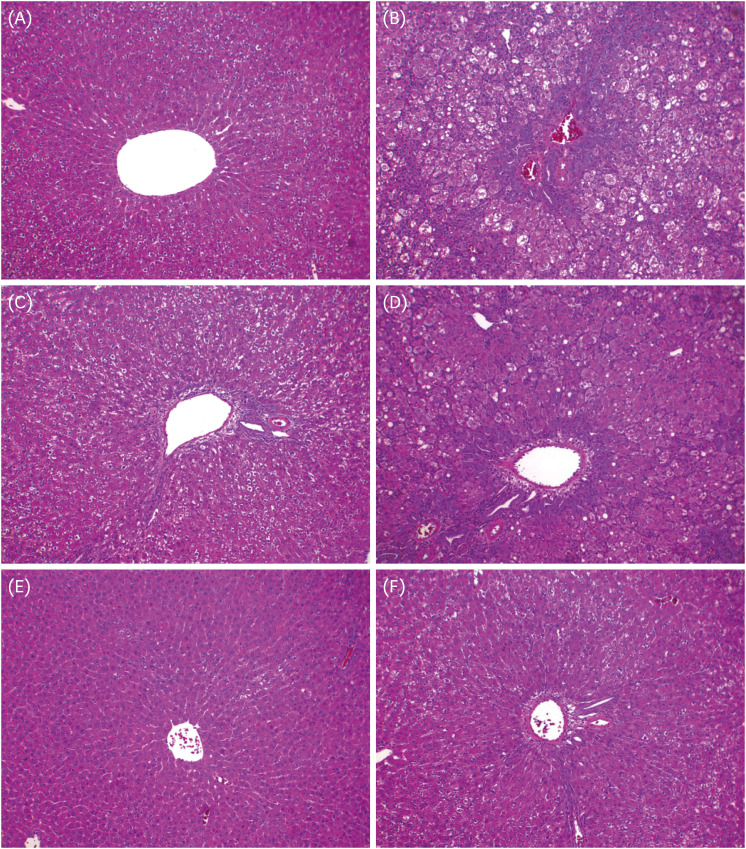 | Fig. 6Pathological examination of effects of GS-KG9 on liver inflammation in rats with GalN-induced liver injury. Livers were stained with hematoxylin and eosin and visualized at 100× magnification. (A) Normal group, (B) GalN-induced liver damage group, (C) Silymarin 25 mg/kg treated and GalN-induced liver damage group, (D) GS-KG9 300 mg/kg treated and GalN-induced liver damage group, (E) GS-KG9 500 mg/kg treated and GalN-induced liver damage group, and (F) GS-KG9 700 mg/kg treated and GalN-induced liver damage group.GalN, D-galactosamine.
|
 | Fig. 7Pathological examination of effects of GS-KG9 on liver fibrosis in rats with GalN-induced liver injury. Livers were stained with Masson's trichrome and visualized at 100× magnification. (A) Normal group, (B) GalN-induced liver damage group, (C) Silymarin 25 mg/kg treated and GalN-induced liver damage group, (D) GS-KG9 300 mg/kg treated and GalN-induced liver damage group, (E) GS-KG9 500 mg/kg treated and GalN-induced liver damage group, and (F) GS-KG9 700 mg/kg treated and GalN-induced liver damage group.GalN, D-galactosamine.
|
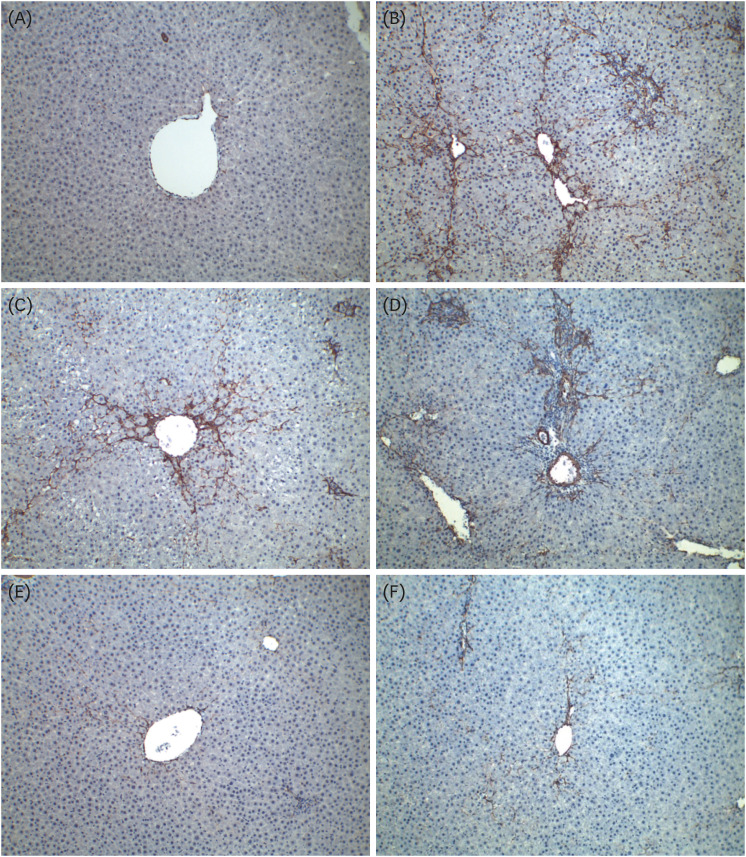 | Fig. 8Effects of GS-KG9 on activation of hepatic stellate cells in rats with GalN-induced liver injury. Immunohistochemical staining of α-smooth muscle actin was performed on liver sections and visualized at 100× magnification. (A) Normal group, (B) GalN-induced liver damage group, (C) Silymarin 25 mg/kg treated and GalN-induced liver damage group, (D) GS-KG9 300 mg/kg treated and GalN-induced liver damage group, (E) GS-KG9 500 mg/kg treated and GalN-induced liver damage group, and (F) GS-KG9 700 mg/kg treated and GalN-induced liver damage group.GalN, D-galactosamine.
|
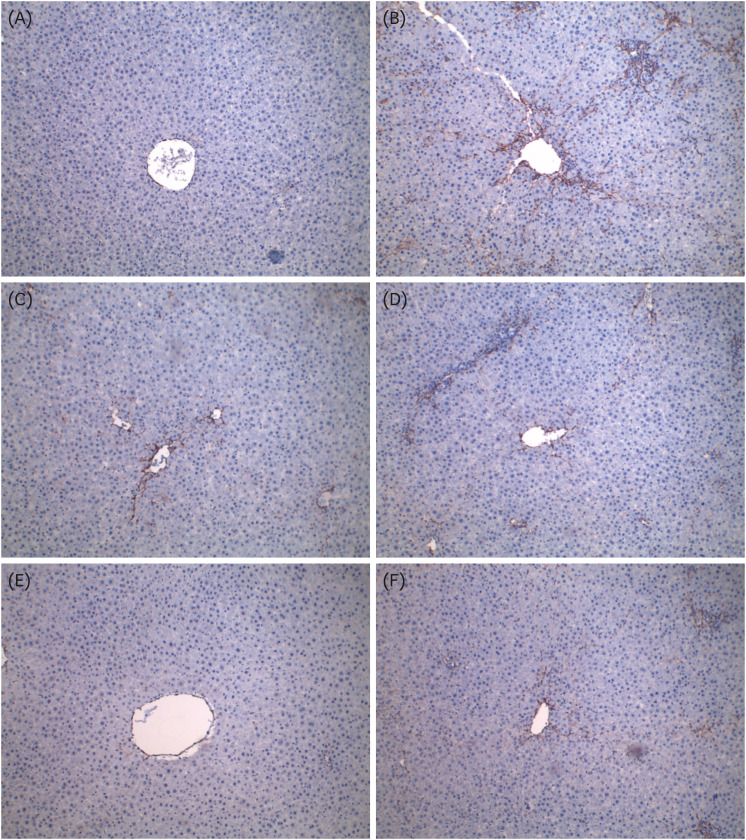 | Fig. 9Effects of GS-KG9 on TGF-β1 stain expression in rats with GalN-induced liver injury. Immunohistochemical staining of TGF-β1 was performed on liver sections and visualized at 100× magnification. (A) Normal group, (B) GalN-induced liver damage group, (C) Silymarin 25 mg/kg treated and GalN-induced liver damage group, (D) GS-KG9 300 mg/kg treated and GalN-induced liver damage group, (E) GS-KG9 500 mg/kg treated and GalN-induced liver damage group, and (F) GS-KG9 700 mg/kg treated and GalN-induced liver damage group.TGF-β1, transforming growth factor-β1; GalN, D-galactosamine.
|
Table 2
Scoring of the effect of GS-KG9 on liver inflammation, necrosis, and fibrosis of GalN-induced liver injury in rats1)
1)Histological indices of hepatic inflammation, necrosis, and fibrosis were quantified by an experiment-blinded veterinary pathologist and based on the numerical scoring of liver biopsy specimens. Liver damage was graded on a scale of 0–4 (0 = none, 1= slight, 2= mild, 3= moderate, and 4 = remarkable). Data are presented as mean ± SE (n = 10). Values with different superscripts within the same column are significantly different among groups according to a one-way analysis of variance coupled with Dunnett's multiple-range test (P < 0.05).
2)Normal, vehicle (0.9% NaCl); GalN, D-galactosamine 650 mg/kg, vehicle (0.9% NaCl); GalN+silymarin 25 mg/kg, Silymarin 25 mg/kg treated and GalN-induced liver damage group; GalN+GS-KG9 300 mg/kg, GS-KG9 300 mg/kg treated and GalN-induced liver damage group; GalN+GS-KG9 500 mg/kg, GS-KG9 500 mg/kg treated and GalN-induced liver damage group; GalN+GS-KG9 700 mg/kg, GS-KG9 700 mg/kg treated and GalN-induced liver damage group.
![]()
Go to :
DISCUSSION
Ginseng is referred to as white ginseng or red ginseng, according to the processing method applied. White ginseng is dried raw ginseng, while red ginseng has been steamed at a high temperature and dried. The GS-KG9 used in this study was prepared from white ginseng by performing the extraction and drying at a low temperature to maintain the quality of the original components of ginseng. There are reports [1518] that red ginseng extracts prepared at high temperature attenuate liver damage in CCl4-induced animal models. However, this study aimed to investigate the effects of GS-KG9 prepared from white ginseng on the inhibition of liver damage by using a GalN-induced liver damage animal model. ALT and AST are normal components of hepatocytes and are known to enter the blood when hepatocytes are damaged [19]. Serum ALT and AST levels were elevated in the GalN-induced liver injury rat model. However, administration of GS-KG9 at 300 mg/kg significantly recovered the levels of ALT and AST that had been increased by GalN administration, and, when GS-KG9 at 500 mg/kg was administered, the ALT and AST levels were similar to those in the normal group. The elevation of ALP enzymes in the blood usually indicates the presence of liver disease or bone disorders [20]. Serum ALP levels were significantly elevated in the GalN-treated group, while the administration of GS-KG9 produced significantly lower ALP enzymatic activity than that in the GalN group. LDH is present in many kinds of tissues as well as in the liver and is a marker of liver damage because it is released upon liver tissue injury [21]. LDH levels were significantly decreased after treatment in all three GS-KG9 concentration groups compared to that of the GalN group. The above results reveal that GS-KG9 is effective in protecting against liver damage induced by GalN. In particular, treatment with 500 or 700 mg/kg of GS-KG9 improved GalN-induced hepatic damage marker enzyme levels to the normal level. However, there was no significant difference in the effects on these markers between the 500 and 700 mg/kg GS-KG9 concentrations. In a preliminary animal model experiment with rats administered 100, 300, or 500 mg/kg of GS-KG9, it was determined that GS-KG9 had a concentration-dependent hepatoprotective effect against GalN-induced liver injury in rats (data not shown). Based on the above results, the most suitable concentration of GS-KG9, i.e., the one that shows a hepatoprotective effect in our GalN-induced rat model, was 500 mg/kg.
Aerobic organisms produce small amounts of free radicals or ROS during the breathing process. Free radicals have critical roles in cell signaling and homeostasis, but free-radical levels that are increased excessively by oxidative stress cause cell damage. Cells are protected against oxidative stress by an interacting network of antioxidant defense systems. These antioxidant defense systems include antioxidant enzymes such as SOD, CAT, and GPx that metabolize oxidative toxic intermediates [22]. In rats with Ga1N-induced liver damage, the administration of GalN has been reported to elevate all parameters related to free-radical metabolism [23]. In the present study, the SOD, CAT, and GPx antioxidant enzyme activity levels were significantly decreased in the GalN group compared to that in the normal group. However, GS-KG9 administration significantly restored these Ga1N-reduced antioxidant enzyme activity levels in a concentration-dependent manner. These enzyme activity levels of the GS-KG9-treated groups were similar to that of the silymarin-treated group. Previous studies have demonstrated that ginseng has antioxidant activities in H2O2-induced hepatocyte and CCl4-induced liver injury animal models [1524]. GaIN administration is reported to accelerate antioxidant stress by consuming antioxidant compounds as well as increasing ROS production in the liver [2526]. Herein, we examined whether GaIN produced ROS in hepatocytes and whether GS-KG9 inhibited such ROS production by using hepatocyte HepG2 cells. As shown in Fig. 4, administration of GS-KG9 inhibited concentration-dependently the increase in ROS production induced by GalN administration. HO-1 is an enzyme that is involved in the oxidation of heme to produce biliverdin and relieves inflammation through a cellular protective effect against oxidative stress [27]. It also inhibits the production of inflammation-promoting cytokines [28]. As a nuclear translation factor, activated Nrf2 has a vital role in regulating cellular defenses against stresses by enhancing the expression of antioxidant gene products, such as HO-1 [29]. GS-KG9 treatment increased the expression levels of nuclear Nrf2 and HO-1 protein. These results suggest that GS-KG9 attenuates oxidative damage in GalN-induced acute liver injury through activation of Nrf2 and HO-1 expression.
The administration of GalN to rats causes liver cell damage and leads to hepatic inflammation and fibrosis [26]. H&E staining is generally performed to observe the histological features of hepatic inflammation in animal models of liver injury. On the other hand, MT staining is performed to observe the degree of collagen deposition-related fibrosis of liver tissue [30]. The H&E staining results revealed morphological microstructure changes, including the infiltration of inflammatory cells, hepatocellular expansion, and large vacuoles related to degeneration and accumulation of fat in and around the portal vein in the GalN-treated group. Furthermore, through MT staining, the GalN group showed severe collagen deposition in and around the portal vein. The H&E and MT staining results showed that GS-KG9 reduced the necrosis related to liver injury, vacuoles by fat accumulation, and hepatic fibrosis due to collagen accumulation. In general, liver cells can be replaced by newly generated hepatocytes when hepatic necrosis occurs due to sporadic injury. However, hepatocellular necrosis caused by continuous liver injury develops into hepatic fibrosis, in which there are qualitative and quantitative changes due to the accumulation of extracellular matrix components such as collagen (I, III, and IV) [31]. In a quantitative evaluation of the liver portal peripheral inflammation, necrosis, and fibrosis evaluated by a veterinary pathologist, the results showed that GS-KG9 treatment significantly lowered the inflammation, necrosis, and fibrosis scores that had been elevated by GalN administration.
An important mechanism in hepatic fibrosis is the activation of hepatic stellate cells. Activated hepatic stellate cells change shape in a manner similar to the expression of α-SMA positive myofibroblasts, and they secrete vascular contractile substances and can synthesize and secrete collagen [32]. The mechanism of liver fibrosis depends on the cause, but in general, damaged liver cells in liver disease secrete both ROS and inflammatory substances to activate hepatic stellate cells. Recently, an epithelial to mesenchymal transition, which can be transformed into fibroblasts by TGF-β1, has been suggested as a mechanism related to liver fibrosis [33]. Among numerous inflammatory cytokines, TGF-β1 is a significant regulator of hepatic stellate cell activation and is reported to induce excessive collagen synthesis [34]. In brief, TGF-β1 stimulates ROS production and suppresses antioxidant defense, leading to redox imbalance or oxidative stress [34]. Our present study showed that GS-KG9 administration improved α-SMA and TGF-β1 expressions that had been affected by GalN. In particular, the 500 mg/kg GS-KG9 treatment improved the morphological changes due to Ga1N-induced liver inflammation and fibrosis to morphologies that were similar to those of the normal group.
In conclusion, the above results show that GS-KG9, a white ginseng extract prepared at a low temperature, can effectively inhibit liver fibrosis by improving oxidative stress, reducing inflammation, and inhibiting activation of hepatic stellate cells in a GalN-induced liver injury rat model. In addition, GS-KG9 promotes nuclear translocation of Nrf2 and expression of antioxidant enzymes, thereby having the effect of improving GalN-induced liver inflammation, necrosis, and liver fibrosis. Thus, GS-KG9 has potential as a functional food substance and for development as a natural-source product with liver protective capabilities.
Go to :
 XML Download