

 PDF
PDF Citation
 Print
Print


INTRODUCTION
Serum uric acid (SUA) level in childhood is important because it is correlated with susceptibility to various diseases in adulthood, such as hypertension, cardiovascular disease, and chronic kidney disease [12]. There is increasing evidence that SUA plays a role in childhood health, including pediatric hypertension [3]. Hypertension in childhood has become a major health concern [45]. A systematic review and meta-analysis reported that the overall prevalence of elevated blood pressure (BP, systolic or diastolic blood pressure ≥ 95th percentile) in children aged 2–19 years was 5.5% (95% CI, 4.2–6.9), and the prevalence of slightly elevated BP (systolic or diastolic blood pressure ≥ 90th percentile and < 95th percentile) was 12.7% (2.1–30.4) [6]. A few cross-sectional or case studies have examined children with SUA and hypertension, but these studies have focused primarily on those over 6 years of age [78]. Previously, we found that the SUA level at 3 years of age was positively related to BP, and a high SUA at 3 years of age contributed to an elevated BP at 7 years of age [9]. Further studies are needed to confirm our findings regarding the critical period when SUA begins to affect health.
Various factors increase SUA, such as aging, diet, and obesity [1011]. High SUA levels were observed in an obese group, and a positive correlation between SUA and BP has been reported [5]. In a cross-sectional survey of 1,027 subjects aged 6–14 years in Japan, hyperuricemia was associated with most the common abnormal component of the metabolic syndrome [12]. In our previous cohort study, we also found that 3-year-old children with a high weight or high body mass index (BMI) had an elevated SUA [13].
Antioxidants might also control SUA. Zinc is an essential micronutrient in human metabolism [141516]. The mechanism underlying the association of dietary zinc intake with SUA levels is not clear, but it might involve its antioxidant properties [17]. A cross-sectional study found a negative association between dietary zinc intake and hyperuricemia in middle-aged men in China [18]. Zhang et al. [19] also reported that the dietary zinc intake was inversely associated with hyperuricemia in Americans (n = 24,975) aged 20 years or older who participated in the National Health and Nutrition Examination Survey (NHNES) from 2001 to 2014.
However, there is insufficient evidence of the effects of lifestyle factors in healthy children. Therefore, this study investigated the associations of dietary zinc and BMI with SUA levels in early childhood in South Korea. We also examined whether BMI and zinc intake have a combined effect on SUA level.
Go to : 
SUBJECTS AND METHODS
Study subjects
This study used follow-up data from the Ewha Birth and Growth Cohort, which was established in 2001 at Ewha Womans University Mok-Dong Hospital. This birth cohort has already been described in detail elsewhere [1320]. Of the 940 children enrolled in the birth cohort, data were available on 469 children at 3 years old (233 boys, 236 girls) and on 369 children at 7 years old (182 boys, 187 girls). For this study, we used data on BMI, dietary intake, and SUA level. Repeated measures of data for both follow-up times were obtained from 183 children. The Institutional Research Board on human subjects at Ewha Womans University approved the protocol (ETC 176-17, EUMC-2015-04-048, EUMC-2018-01-002), and informed consent was obtained.
Data
At the follow-up visits, trained examiners measured current weight to one decimal place with a calibrated scale while the subjects wore light clothing; they measured height in stocking feet using a stadiometer (DS-102 model; Dong Sahn Jenix, Seoul, Korea). BMI was calculated as weight in kilograms divided by height in meters squared (kg/m2). The SUA level (mg/dL) was measured using the uricase- and peroxidase-coupled reaction method on a Hitachi 7180 chemistry analyzer (Hitachi, Fukuoka, Japan). Daily nutritional intake was assessed using a 2-day 24-h dietary recall survey completed by the parents of the participating children. Food models and measuring bowls, cups, and spoons were used to assist in estimating portion sizes. The record for each subject was coded, and standard reference tables were used to convert portions of foods measured by household items into gram weights. A nutrition specialist quantified the dietary intake using CAN-Pro ver. 3.0 [21]. In this study, we used data on the dietary intake of zinc, vitamin C, and total energy.
Statistical analysis
The data were analyzed using SAS ver. 9.4 (SAS Institute, Cary, NC, USA). Continuous data are expressed as the mean ± SD (normally distributed data) or median and interquartile range (skewed data), and categorical data are expressed as the number of subjects with percentages. We considered SUA at 7 years of age as a major outcome. Repeated measurements of dietary zinc intake and BMI at 3 and 7 years of age were used as independent factors. We calculated the Pearson's correlation coefficients between BMI at 3 and 7 years of age and the SUA level at 7 years of age. Spearman's rank correlation analysis was used to examine the association between dietary zinc at 3 and 7 years of age and SUA at 7 years of age because the zinc data were not normally distributed.
Considering the statistical power, we used operational definitions of overweight and low zinc intake for the combined effect analysis. The zinc intake level was categorized as low (< 75th percentile, < 6.77 mg) or high (≥ 75th percentile, 6.77 to 11.80 mg). Overweight was categorized as ≥ 85th percentile of BMI according to the 2007 Korean Children and Adolescents Growth Standards [22]. To assess the combined effect of zinc intake and BMI on SUA, we used data on dietary zinc intake at 3 years of age and BMI at 7 years of age, which have significant correlations with SUA at 7 years of age. Because there were only two subjects in the overweight, high-zinc group, the analysis examined the low-risk (group 1), high-risk (group 3), and remainder (group 2) groups. Group 1 was the normal-weight, high-zinc group; group 2 was the normal-weight, low-zinc and overweight, high-zinc group; and group 3 was the overweight, low-zinc group.
We constructed a general linear model after adjusting for sex, total energy (kcal), and vitamin C intake [23] and Zn intake at 7 years of age. The results are expressed as adjusted means with SEs and a P-value. A 2-tailed P-value < 0.05 was considered significant.
Go to :
RESULTS
General characteristics
Table 1 summarizes the basic characteristics of the study population. Overall, 183 participants were followed up at both 3 and 7 years of age, and 50.8% were girls (90 boys and 93 girls). All anthropometric data were within the normal ranges at 3 and 7 years of age according to the 2007 Korean Children and Adolescents Growth Standards [22].
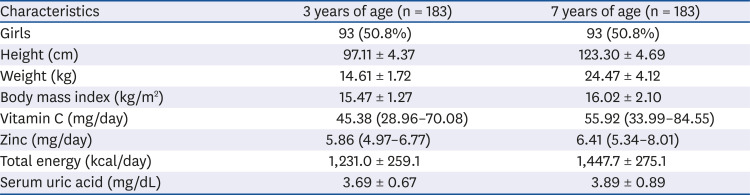
Table 1
Characteristics of study participants followed at both 3 and 7 years of age
![]()
Effects of zinc intake and BMI on serum uric acid
Fig. 1 shows the correlations between the SUA level at 7 years of age and the zinc intake or BMI at 3 and 7 years of age, respectively. Zinc intake at 3 years old was negatively correlated with an SUA at 7 years of age (Spearman's ρ = −0.18, P = 0.04). BMI at 7 years of age was positively correlated with SUA (Pearson's r = 0.18, P = 0.01) at 7 years of age, whereas BMI at 3 years of age was not correlated with SUA at 7 years of age. There was no significant relationship between the zinc intake at 7 years old and the SUA level at 7 years. Based on the results in Fig. 1, we then analyzed the zinc intake at 3 years of age and BMI at 7 years of age, as shown in Table 2.
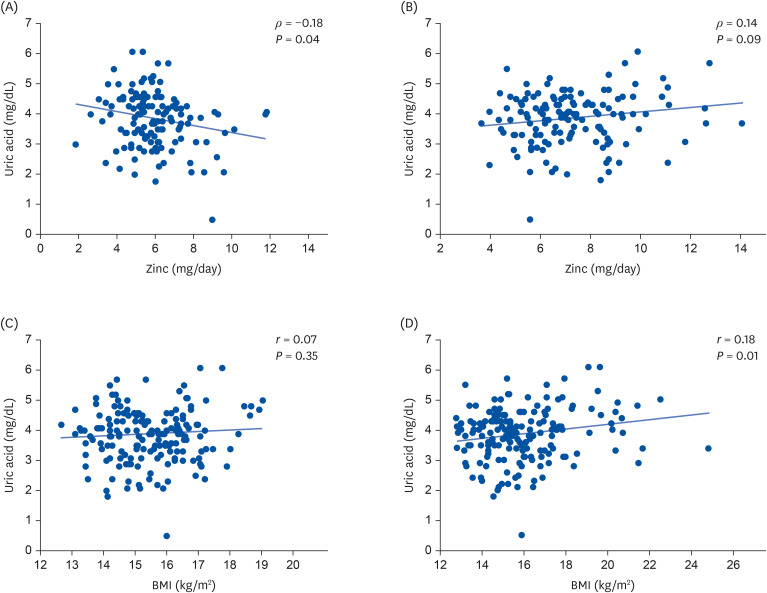 | Fig. 1Correlations between zinc intake or BMI and SUA level at 7 years of age. (A) Spearman correlation of zinc intake (mg/day) at 3 years old with SUA level (mg/dL) at 7 years. (B) Spearman correlation of zinc intake (mg/day) at 7 years old with SUA level (mg/dL) at 7 years. (C) Pearson correlation of BMI (kg/m2) at 3 years old with SUA level (mg/dL) at 7 years. (D) Pearson correlation of BMI (kg/m2) at 7 years old with SUA level (mg/dL) at 7 years.BMI, body mass index; SUA, serum uric acid.
|
Table 2
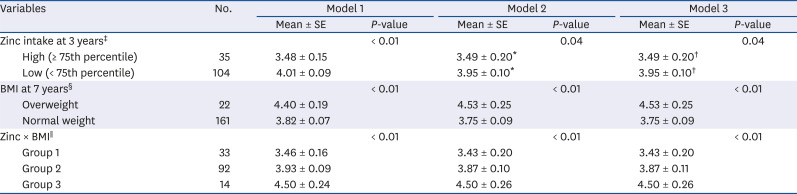
Effects of zinc intake and BMI on serum uric acid level (mg/dL) at 7 years of age
Model 1: crude model (not adjusted); Model 2: adjusted for sex, total energy at 3 years and Zn intake at 7 years; Model 3: adjusted for sex, total energy and vitamin C intake at 3 years and Zn intake at 7 years.
BMI, body mass index.
*Additionally adjusted for BMI at 7 years in Model 2; †Additionally adjusted for BMI in Model 3; ‡High: ≥ 75th percentile, cut-off point of zinc intake 6.766 mg/day; §Overweight: ≥ 85th percentile of BMI; ∥Combined groups of zinc and BMI are divided 3 groups—Group 1: normal-weight, high-zinc; Group 2: normal-weight, low-zinc and overweight, high-zinc; Group 3: overweight, low-zinc.
![]()
Combined effect of zinc intake and BMI on serum uric acid
The general liner model revealed the effects of zinc intake and BMI on SUA at 7 years of age (Table 2). The high-zinc-intake group had a lower mean SUA level than the low-zinc-intake group in the crude model (3.48 vs. 4.01 mg/dL, P < 0.01; Model 1). The significance remained in Model 2 (3.49 vs. 3.95 mg/dL, P = 0.04), which was adjusted for sex, total energy at 3 years of age, and BMI at 7 years of age, as well as in model 3 (3.49 vs. 3.95 mg/dL, P = 0.04), which was further adjusted for vitamin C intake at 3 years of age. The overweight group (high BMI) had a significantly higher mean SUA at 7 years of age than the normal-weight group in the crude (4.40 vs. 3.82 mg/dL, P < 0.01) and adjusted models (Model 2: 4.53 vs. 3.75 mg/dL, P < 0.01 and Model 3: 4.53 vs. 3.75 mg/dL, P < 0.01).
The third section of Table 2 summarizes the combined effect of zinc intake at 3 years and BMI at 7 years on SUA at 7 years of age. The participants were divided into three subgroups (group 1: normal-weight, high-zinc group; group 2: normal-weight, low-zinc and overweight, high-zinc group; and group 3: overweight, low-zinc group) to assess the combined effects of zinc intake and BMI on SUA. SUA was lower in the normal-body-weight, high-zinc group (3.43 mg/dL, P < 0.01) than in the other 2 groups (3.87 mg/dL in normal-weight, low-zinc and overweight, high-zinc groups and 4.50 mg/dL in the overweight, low-zinc group) even when adjusted for sex, total energy, and vitamin C intake at 3 years. There was no difference in SUA levels between Model 2* and Model 3†.
Go to :
DISCUSSION
In this study, we found that BMI at 7 years of age and zinc intake at 3 years of age were associated with SUA level in children at 7 years of age. Combined, a relatively high zinc intake and normal body weight was significantly associated with a decrease in SUA.
Although the precise mechanism of the association between childhood SUA and related diseases in adulthood is not clear, Feig [2] demonstrated a significant correlation between elevated SUA and blood pressure level in children and adolescents. Previously, we also confirmed that the SUA levels at 3 and 5 years of age had a strong effect on elevating the systolic blood pressure at age 7 years [9]. Therefore, an understanding of the risk factors related to SUA at an early stage will help prevent the development of cardiovascular diseases.
Several studies have suggested that SUA levels are elevated in obesity. A Chinese group evaluated the relationship between BMI and SUA in 39,736 healthy subjects living in Jiangsu Province. Multiple regression analysis revealed that SUA increased linearly with BMI (β = 0.132, P < 0.001) [24]. A cross-sectional prevalence study of 148 school-aged children in Spain showed similar outcomes, and patients with hyperuricemia had a higher BMI (33.9 vs. 30.6 kg/m2) and larger waist circumference (101.4 vs. 91.1 cm) than those with a normal SUA [25]. Therefore, we believe that BMI is a marker of a risk for elevated SUA in children.
The SUA level is related to nutrition intake. A recent review article summarized published research on the dietary impact of vitamin C intake on the risk of gout and increased SUA [1026]. Zinc is a micronutrient found in foods, such as shellfish and meat, and plays very important roles in cell proliferation, apoptosis, and defense against oxidative stress [14151627]. Zinc deficiency is associated with growth retardation, cell-mediated immune dysfunction, and cognitive impairment [28]. Uric acid is the final product of purine metabolism and can act as a major antioxidant or pro-oxidant within a cell [29]. These antioxidant properties may explain the association between zinc and SUA in biochemical systems [17]. Nevertheless, few studies have evaluated the beneficial effects of zinc on health. An animal study showed that the SUA levels in diabetic rats treated with a zinc-flavonol complex was significantly reduced [30]. A longitudinal study reported that SUA was linearly related the serum zinc concentrations in hemodialysis patients [31]. An epidemiological study demonstrated that dietary zinc intake is inversely related to the prevalence of hyperuricemia in middle-aged men in China. The odds ratio of hyperuricemia was decreased by 0.55 times in the adequate-zinc-intake group compared to the lowest-zinc-intake group (P = 0.003). However, this relationship was valid only in middle-aged men and not in middle-aged women [18]. As there have been no reports on the role of zinc intake in children, we focused on zinc as a potential modulator of SUA in this study. In the correlation analysis, a lower zinc intake at 3 years of age was associated with an elevated SUA at 7 years of age. We also found significant difference in the mean SUA levels at the age of 7 years when the zinc status at the 3 years of age was divided into quartiles. Further study should examine the causal relationship between the longitudinal effects of dietary zinc and SUA. The combined effect analysis concluded that SUA mean decreased from 4.50 ± 0.24 to 3.45 ± 0.17 mg/dL in the group with normal body weight and a relatively high zinc intake compared with in the overweight/obese group with relatively low zinc intake at 7 years of age.
Recent longitudinal studies have tracked BP and found a positive correlation of BP from childhood to adulthood in diverse populations [3233]. Therefore, SUA levels, a potential risk factor for an elevated BP, should be managed appropriately to maintain adequate BP levels in children. Our findings indicate that previous dietary zinc intake could have long-lasting effects on SUA in childhood. Therefore, appropriate nutritional recommendations and interventions for high-risk children with obesity with high SUA levels are a priority.
The limitations of this study include potential selection biases because it was a tertiary-hospital-based birth cohort and involved a small sample size. Additionally, the level of zinc intake in this study is higher than the recommended intake for Korean children, which is difficult to generalize. Measuring zinc intake using the 24-h recall method is probably less accurate than measuring micronutrient concentrations through blood tests or hair mineral analysis. Nevertheless, blood tests do not fully reflect micronutrient intake.
This study also has several strengths. First, we assessed dietary zinc intake as a potential beneficial factor for SUA levels in childhood. To elaborate on this finding, further interventional studies of the causal association between zinc intake and SUA in children are recommended. Second, many studies focused primarily on individual risk factors for related diseases [3435], whereas we evaluated the combined effect considering both risk factors and beneficial factors.
In summary, the combined effects of zinc intake and BMI on the SUA level in children were examined. This study is the first to propose that the beneficial effects of zinc intake might be used to regulate SUA in childhood. We also suggest that the SUA level should be monitored from early life and that dietary interventions should be implemented primarily for high-risk children who are more likely to have high SUA levels associated with their obesity.
Go to :
 XML Download