

 PDF
PDF Citation
 Print
Print


Introduction
Papillary thyroid cancer (PTC) is one of the most common endocrine cancers. Its incidence has been rising steadily.1) PTC presents variously, ranging from a single solitary nodule to multiple co-existing nodules arising from separate foci in the thyroid gland.2,3) Multifocal pattern in PTC has a high rate ranging from 24% to 46%, among which 50-70% are bilateral.4-6)
The correlation between multifocality and clinical aggressiveness of PTC remains controversial. Many studies reported multifocality is associated with progression of PTC.7-9) However, some of recent studies reported opposite result. Singhal et al.10) reported multifocal PTC showed less extrathyroidal extension (ETE) than solitary nodule. Konturek et al.11) reported that multifocal PTC showed less distant metastasis than solitary nodule. Ahn et al.12) reported that odds ratio of lymph node metastasis didn’t show significant difference between multifocal and solitary PTC.12) In this reason, classification of molecular subtyping of multifocal PTC is absolutely needed to predict clinical behavior of multifocal PTC.
The Cancer Genome Atlas (TCGA) research network group has analyzed multiple genomic platform data of cancers, including PTCs data.13) They share valuable data at publicly available websites with diverse clinical information, including mRNA expression using RNA sequence, mutation profile, copy number alteration, micro-RNA expression, methylation profile, and exon sequencing data. Molecular classification of cancer type using these multiplatform data makes it possible to predict clinical behavior and give appropriate treatment, especially for aggressive tumor subtypes.
In this study, using a large set of TCGA mRNA expression data, we classified multifocal PTCs into two subgroups with distinct molecular patterns and different clinical behaviors. Differences in involved pathways between these subgroups were determined using an integrated gene-level approach based on gene expression data, copy number alteration data and somatic mutation data.
Materials and Methods
Genomic and Clinical Data Sets
All genomic data of PTC from TCGA project were obtained from TCGA data portal (https://tcga-data.nci.nih.gov) and cancer browser (https://genome-cancer.ucsc.edu). Effective samples included both clinical pathological information, including presence of other thyroid disease. Patients with multifocal PTC (n=226) of total 505 participants were enrolled in our study. 80 patients were diagnosed at bilateral PTC, and others represented unilateral PTC. All parameters including age, gender, tumor size, extrathyroidal extension, TNM stage, presence of thyroid disease, and BRAF mutation state in 226 patients were analyzed. Minimal ETE is defined as tumor cells extending to the sternothyroid muscle or perithyroidal soft tissue, and this is a departure from the 7th edition of the AJCC staging, in which ETE was distributed across T3, T4a, and T4b categories to reflect minimal ETE (including microscopic ETE and macroscopic ETE into strap muscles). Moderate/Advanced ETE, extensive ETE, is defined as tumor of any size that has grown beyond the thyroid capsule to invade subcutaneous soft tissues, larynx, trachea, esophagus, recurrent laryngeal nerve, or major vessels by the tumor. Gene expression data from mRNA-seq, copy number alteration data, somatic mutation data, and clinical parameters in patients with multifocal PTC (n=226) were analyzed. Clinical data included age, gender, tumor size, extrathyroidal extension, TNM stage (AJCC 8th), RAS mutation state, and BRAF mutation state (Supplementary Data 1).
Analysis of Gene Expression Data and Supervised Clustering
All the samples used to test the gene expression are from human thyroid tissue. Effective samples included both clinical and pathological information, and the expression levels of the whole genome (total of 20,531 genes). The expression levels of genes were measured as the reads per kilobase per million reads. Gene expression data were gene-median centered using BRB-ArrayTools software program (http://linus.nci.nih.gov/BRB-ArrayTools.html ).14) Gene variability was then computed using median absolution deviation. A total of 3134 most variable genes were selected. A heatmap was generated using Cluster and TreeView software programs. 15)
Analysis of Copy Number Alteration Data
Copy number alteration analysis was performed using Cluster and TreeView software programs.
Analysis of Somatic Mutation Data
Somatic mutation analysis was performed using oncoprint at Cbioportal website (http://cbioportal.org).
Selection of Specific Gene Signature in Each Group
Genes with a fold change greater than 2 (the absolute value of log 2 fold change greater than 1) and an adjust p-value less than 0.05 were considered as differentially expressed and were selected genes in groups.
Significant Canonical Signaling Pathways Enriched in Each Subgroup
Pathway analysis was carried using Ingenuity Pathways Analysis (Ingenuity, Redwood City, CA, USA). Genes associated with canonical pathway in Ingenuity Pathways Knowledge Base were analyzed. Significance of association between differently expressed genes of each group and the canonical pathway was measured using Fischer’s exact test at p<0.001.
Statistical Analysis
The association of molecular subtype with each clinical variable was evaluated using Chi-square test. Recurrence free survival (RFS) results between two groups were compared using Kaplan Meier plot and log rank test. Significant difference was considered at p<0.05. All statistical analyses were conducted in R language environment (http://www.r-project.org) and SPSS statistics version 22.0 (IBM Corp., Armonk, NY, USA).
Results
Unsupervised Hierarchical Clustering in Multifocal Papillary Thyroid Carcinomas
To find statistically significant gene expression subtypes in multifocal PTCs (n=226), hierarchical clustering in an unsupervised and unbiased manner was performed using cluster 3.0. program. Results of hierarchical clustering analysis revealed two molecular subtypes with distinct gene expression profiles (Fig. 1). Red and green colors in the heatmap indicated relative high and low expression, respectively.
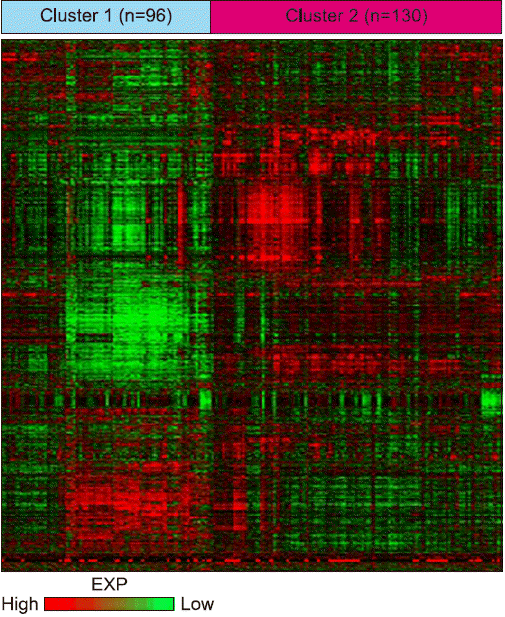
Fig. 1
Unsupervised clustering of multifocal papillary thyroid carcinomas (PTCs) revealing two distinct molecular subtypes. A hierarchical clustering of gene expression data from 226 multifocal PTC cases in The Cancer Genome Atlas (TCGA) data. Gene expression levels that were at least 2-fold different in at least 50 cases relative to the median value across cases were selected for hierarchical clustering analysis (3134 gene features). Data are given in matrix format, in which rows represent individual genes and columns represent each patient. Each cell in the matrix represents expression level of a gene feature in an individual pattern. Red and green colors in cell indicate relative high and low expression, respectively, as indicated in the scale bar.
![]()
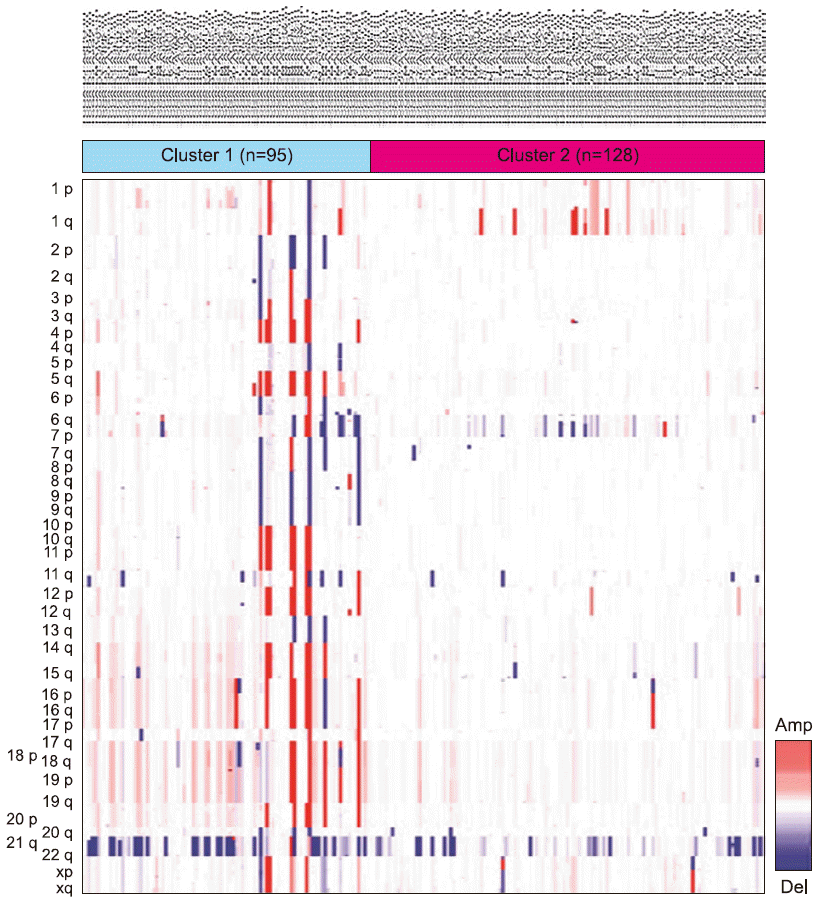
Comparison of Copy Number Alterations Data between Cluster 1 and Cluster 2
As shown in Fig. 2, copy number alterations of cluster 2 were almost none when compared to cluster 1. Cluster 1 multifocal PTCs had some CPN alterations such as chromosome 15,16,17,18,19 amplification and chromosome 20,21 deletion, but cluster 2 multifocal PTCs had chromosome 1q amplification and chromosome 6q deletion.
Comparison of Somatic Mutation Data between Cluster 1 and Cluster 2
Since previous study suggested the importance of both BRAFV600E mutation status and RAS score to predict tumor aggressiveness, comparison of somatic mutation data between cluster 1 and cluster 2 were performed (Supplementary Fig. 1). We hypothesized that there was another molecular pathway related to tumor progression in multifocal PTC and the presence of well-known somatic mutation. Interestingly, cluster 2 had more frequent BRAFV600E mutation (n=85/130, 65.4%) compared to cluster 1. However, BRAFV600E mutation was also detected in some patients in cluster 1 (n=21/96, 21.9%). Moreover, RAS mutation were detected only cluster 1 (HRAS mutation=7, NRAS mutation=13, and KRAS mutation=2) (Supplementary Fig. 1).
Comparison of Clinicopathologic Parameters between Cluster 1 and Cluster 2
To determine the importance of our molecular subtypes classification using integrated genomic analysis, we compared clinicopathologic parameters between cluster 1 and cluster 2 using Chi-square test and paired t test (Table 1). There was no significant difference in age, sex, or T stage between cluster 1 and cluster 2. Although tumor size was significantly more increased in cluster 1 compared to that in cluster 2, the status of extra-thyroid extension, lymph node metastasis, and presence of BRAFV600E mutation was less frequent in cluster 1 compared to that in cluster 2. In analysis of thyroid disease status between the two groups, nodular hyperplasia was significantly more increased in cluster 1 compared to that in cluster 2. Since several groups identified the relationship of nodular hyperplasia or lymphocytic thyroiditis with tumor aggressiveness,16-18) we investigated the relationship of thyroid disease with clusters. However, there was no significant association between lymphocytic thyroiditis and the two molecular subtypes. We also compared RFS between the two clusters. There was no significant difference in RFS between the two groups (Supplementary Fig. 2). Overall, cluster 1 showed more frequent existence of nodular hyperplasia with indolent behavior whereas cluster 2 showed aggressive clinical behavior (Table 1).
Table 1
Case distribution according to cluster 1 and cluster 2
![]()
The presence of BRAFV600E mutation is one of the most influencing factor in tumor progression. Thus, multivariate analysis using stepwise logistic regression was conducted on parameters shown to be significant in univariate analysis to identify the role of cluster 2 as an independent predictor of the aggressive phenotypes of multifocal PTC (Table 2). Results of multivariate analysis revealed that cluster 2 was an independent risk factor for lymph node metastasis (p<0.0001, OR: 4.464) and the presence of BRAFV600E mutation (p<0.0001, OR: 5.411). Nodular hyperplasia was also a significantly related factor between two groups (p=0.035, OR: 0.456) (Table 2).
Table 2
Multivariate analysis of clinicopathologic factors between cluster 1 and cluster 2
![]()
Comparison of Clinicopathologic Parameters between Cluster 1 and Cluster 2 Patients without BRAF Mutation and RAS Mutation
Previous studies have reported that BRAFV600E mutated multifocal PTCs have aggressive phenotype.19,20) Consistent with previous results, the presence of BRAFV600E mutation was significantly related to our classification using integrated genomic analysis. However, some patients with BRAFV600E mutation included in cluster 1 group showed indolent clinical behavior. This suggests that there is another molecular mechanism independent of mutation of BRAFV600E in multifocal PTCs that is associated with tumor progression. After excluding patients with BRAF mutation (n=114), and RAS mutation (n=21), we re-analyzed clinicopathologic findings between cluster 1 (n=51) and cluster 2 (n=44) (Table 3). Interestingly, presence of lymph node metastasis was significantly associated with cluster 2 group, compared to cluster 1 group (Table 3). These finding support that our classification using integrated genomic analysis may have potential to determine the prognosis of multifocal PTCs, independent of BRAF or RAS mutation status.
Table 3
Case distribution according to cluster 1 and cluster 2 in patients without BRAF or RAS mutation (n=95)
![]()
Selection of Specific Gene Signature in Each Group
Next, we tried to select genes differentially expressed between cluster 1 and cluster 2 multifocal PTCs. We applied stringent cutoff criteria (p<0.001, Student t-test; and 2-fold difference) and identified 100 genes for each group (Supplementary Data 2). In Fig. 3, data given in the matrix represent expression level of a gene feature in an individual patient. We selected 100 genes that were cluster specific and drew a heatmap. Red and green colors in the heatmap reflected relative high and low expression, respectively.
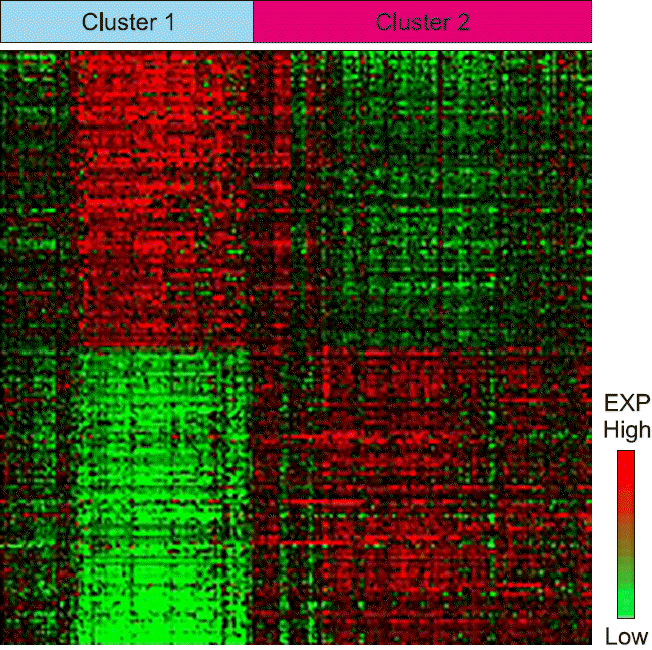
Fig. 3
Each cluster-specific gene expression patterns shown in heatmap. Data given in the matrix represent the expression level of a gene feature in an individual patient. We selected 100 group-specific genes to draw the heatmap. Red and green colors in cell indicate relative high and low expression, respectively.
![]()
Significant Canonical Signaling Pathways Enriched in Cluster 2 Revealed Aggressive Behavior of Multifocal PTC Using Ingenuity Pathway Analysis (IPA)
IPA revealed that each cluster had different canonical signaling pathways (Supplementary Data 3). Diverse immune related pathways such as dendritic cell maturation, Th1 pathway, IL-6 pathway, and Leukocyte Extravasation signaling were enriched in cluster 2. P-value and ratio are presented in Table 4.
Table 4
Altered canonical pathways in cluster 2
![]()
Discussion
Using TCGA mRNA expression data, we found that multifocal PTC had two distinct molecular subtypes for the first time. These two subgroups using molecular classification revealed significant different clinical behaviors and different molecular pathways. Multifocal PTC in cluster 1 showed indolent clinical behavior whereas multifocal PTC in cluster 2 showed aggressive clinical behavior, suggesting the importance of integrated genomic analysis for tumor aggressiveness in multifocal PTC. Our study could provide reasons why prognostic effects on tumor progression in multifocality are controversial.
Multifocality is frequently observed in patients with PTC. It is emerging as a prognostic marker in terms of lymph node metastasis and regional recurrence.3,6) However, the prognostic significance of multifocality remains controversial. Moreover, there is no exact biomarker to predict the prognosis of multifocal PTC. Some groups have focused on the importance of bilateral PTC rather than unilateral multifocal PTC in tumor progression of multifocal PTC. However, prognostic effects of bilateral PTC are also controversial. Previous study has suggested that patients with bilateral PTCs show more advance tumor stage, lymph node metastasis, and higher rates of ETE and BRAFV600E mutation than those with unilateral-multifocal PTCs.6) Other study has indicated that bilateral and multifocal PTCs have aggressive pathologic features.3) However, only multifocality is significantly associated with an increased risk of disease recurrence.3) Therefore, tumor location is insufficient as a predictive biomarker to treat multifocal PTC. Here, we investigated tumor location of unilateral PTC and bilateral PTC in cluster 1 and cluster 2 using molecular classification (Table 1). We found no significant difference in the proportion of bilateral PTC between the two groups. These results support that molecular classification using integrated genomic analysis may be useful for predicting tumor aggressiveness rather than the location of tumor in multifocal PTC.
Previous studies about papillary microcarcinoma have found that recurrence is significantly higher in the presence of multifocality.21-23) However, the effect of multifocality in PTC with tumor size larger than 1 cm is rarely reported. A recent meta-analysis about multifocal PTC has shown that there is no significant association between tumor size and multifocality, although diverse clinic-pathologic parameters including lymph node metastasis, ETE, and disease recurrence are associated with multifocality.2) In this study, we analyzed all multifocal PTC, including microcarcinoma and macrocarcinoma, from TCGA database to evaluate the importance of tumor size in determining tumor progression in multifocal PTCs. Our results are consistent with previous meta-analysis.1) Tumor size in cluster 2 showing aggressive behavior was significantly smaller than that in cluster 1 showing indolent behavior (Table 1). Additionally, in multivariate analysis (Table 2), there was no significant association between tumor size (>1 cm) and molecular classification, although lymph node metastasis and BRAFV600E mutation were significantly more frequent in cluster 2 compared to those in cluster 1. Thus, tumor size was not a major influencing factor of tumor behavior in multifocal PTC.
Since most studies have focused on the association of clinicopathologic parameters with tumor progression of multifocal PTC without performing molecular analysis, the mechanism involved in the aggressive behavior of multifocal PTC has remains unclear. A recent study has suggested that BRAFV600E mutation, the most well-known mutation related to thyroid cancer prognosis, is significantly associated with tumor progression in multifocal PTC.24) However, several recent studies have failed to corroborate such findings.25,26) Thus, the significance of BRAFV600E mutations in multifocal PTC remains debatable. We analyzed BRAFV600E mutation status between the two clusters to evaluate the effect of BRAFV600E mutation through molecular classifications. Cluster 2 showed significant higher existence of BRAFV600E mutation and more aggressive clinical behaviors compared to cluster 1. Currently, the presence of BRAFV600E mutation was significantly related to our classification using integrated genomic analysis based on multivariate analysis (Table 2). However, some participants with BRAFV600E mutation were included in cluster 1 with indolent clinical behavior. These results are inconsistent with findings of our previous report.27) When we analyzed TCGA database from all patients with PTC using unsupervised clustering, there were two distinct mRNA expression patterns and all BRAFV600E mutated PTCs were included in one cluster group.27) Molecular mechanisms involved in tumor behavior of multifocal PTCs might be different from those involved in unifocal PTCs. We also investigated clinicopathologic parameters of BRAFwild multifocal PTCs in cluster 1, different from BRAFwild multifocal PTCs in cluster 2, to determine whether our molecular classification using integrated gene-level approach could be used as a surrogate tool to predict prognosis in multifocal PTC independent on BRAFV600E mutation. Interestingly, BRAFwild multifocal PTCs in cluster 1 showed indolent clinical behavior whereas BRAFwild multifocal PTCs in cluster 2 showed aggressive behavior (Table 3), suggesting the prognostic possibility using our molecular classification.
We also analyzed somatic mutation data between the two groups. Multifocal PTC in cluster 1 had frequent RAS family mutations, including NRAS, KRA, and HRAS. In contrast, multifocal PTCs in cluster 2 did not have any RAS mutation. RAS mutation in BRAFwild PTCs is known to be associated with a lower risk of tumor progression.28-30) These results are similar to those of our previous study about BRAFwild PTC.27) However, the prevalence of RAS family was detected in only 11% of our data. We also selected genes differentially expressed between cluster 1 and cluster 2 to search for upstream or downstream of functionally important genes. Comparison of differentially expressed genes between the two clusters revealed that there was no different difference in expression of well-known genes such as BRAF, TERT, RAS, RET, or TP53. Interestingly, when we analyzed prominent molecular pathway in cluster 2 compared to that in cluster 1, IPA analysis revealed that many immune-related signaling including IL-6 signaling and macrophage signaling were related to tumor aggressiveness (Table 4). IL-6 is frequently viewed as a pro-inflammatory cytokine with functions similar to tumor necrosis factor (TNF) and IL-1b in the context of inflammation.31) During tumor progression, classically activated macrophages or M1- macrophages are characterized by high expression of IL-6, TNF, and iNOS as well as a dendritic cell-like phenotype to tumor progression, and IL-6 is known to have detrimental effects. Its action is frequently linked to tumor growth, progression, and relapse.32) Cluster 2 with aggressive behavior in our molecular classification showed upregulated dendritic cell maturation signaling, production of NO and reactive oxygen species in macrophages, Th1 Pathway, and Th2 Pathway, as well as upregulation of IL-6 signaling axis. These findings suggest that IL-6 signaling axis has an important role in thyroid cancer progression. Thus, targeting IL-6 signaling might contribute to clinical management of multifocal PTC patients.
Previous findings have suggested that the pathogenesis of multifocal PTC involves intraglandular spread of a single clone or from independent progenitor clones.33-36) The exact prognostic value of independent clonal origin and intra-thyroidal metastases from a single malignant focus is unknown.36) Currently, it remains inconclusive whether each tumor in multifocal PTC occurs independently or spreads from a single tumor mass in the thyroid gland in our study because TCGA database have gene analysis of single tumor in each patient. To clarify the importance of clonal origin in determining molecular subtypes, a large scaled study using whole genome sequencing of all tumor samples of multifocal PTCs will be necessary. This study identified that multifocal PTC has two distinct molecular subtypes with distinctive clinical behaviors. Using these molecular subtypes, we can predict tumor aggressiveness and make an appropriate treatment plan of multifocal PTC.
In conclusion, multifocal PTC has two distinct molecular subtypes with distinctive clinical behaviors, independently the presence of BRAF or RAS mutation. Our data suggested the clinical implications of the transcriptomic signature to predict clinical outcomes of multifocal PTC.
 XML Download