

 PDF
PDF Citation
 Print
Print


INTRODUCTION
Food-related programming is an important broadcasting trend in Korea. Two types of such programming are Mukbang and Cookbang. Mukbang refers to a live or recorded audiovisual broadcast in which a host eats large amounts or delicious-looking foods while interacting with their audience; this format is receiving sociocultural attention worldwide [1-3]. Cookbang goes beyond Mukbang, in which the performers first cook the food themselves, and then eat it [4]. These food-related programs offer viewers a sense of intimacy and comfort, but also provide simple “food porn”-level sensations and pleasures that can lead to excessive consumption and unhealthy eating [5].
University students in their early adulthood tend to have undesirable dietary habits, often because they underestimate the importance of a healthy lifestyle and/or lack interest in bettering their diet [6]. In contrast to the regular schedules that children experience in their middle and high school years under parental guidance, college students, with their newly gained autonomy, may experience a poor diet because they frequently eat out, experience irregular meals, excessive drinking and smoking [7] and have a limited budget, limited/incorrect nutritional knowledge and excessive interest in their looking cool [8]. Furthermore, according to a 2018 survey on smartphone use by the Ministry of Science and Information and Communication Technology [9], 25.9% of college students in Korea were at risk for smartphone over-dependency, compared to 18.1% of adults. Therefore, as the content available on mobile devices continues to increase at a rapid pace, college students may become particularly vulnerable to the adverse effects of watching Mukbang and Cookbang.
Fortunately, unfavorable lifestyle choices are more easily corrected by education among college students than later in life [10]. Therefore, it is important to identify the dietary issues of university students and use this information to develop an effective program for nutritional education that will help improve their health now and in the future. Two main types of food-related programs available in the Korean market are Mukbang and cookbang, some of which combine these 2 so the boundaries separating the 2 genres are vague in some respects. But, Mukbang and Cookbang have disparate influences on viewers' lives [4].
Therefore, this study sought to identify patterns of Mukbang- or Cookbang-watching and their potential association with the dietary life of university students who are not food and nutrition majors to avoid professional knowledge acting as a confounding variable.
Go to : 
SUBJECTS AND METHODS
Participants
This study was conducted from March to April 2019 on male and female students at a university in northern Gyeonggi, Korea. A total of 639 questionnaires were distributed and 621 were collected. After exclusion of incomplete questionnaires and those completed by students from the Department of Food and Nutrition (n = 150), the final study included data from 380 finalized questionnaires. This study was approved by the Institutional Review Board at the Daejin University (1040656-201907-SB-01-02).
Data collection
The questionnaire was 3 pages long and took 5–15 minutes to complete. The contents of the questionnaire included items on demographic characteristics, the actual status of watching, perception of diet change attributed to watching, dietary life and self-diagnosis of dietary habits. The questionnaire began by defining and providing examples of Mukbang and Cookbang as used in the questionnaire. Regarding the frequency of Mukbang- and Cookbang-watching, participants were asked to select one answer from the 4 categories of “never”, “maybe, but not sure”, “sometimes” and “often”. The questions on nutrition labels were constructed with reference to a questionnaire of the National Health and Nutrition Survey [11]. For questions regarding nutrition label awareness, participants were asked to select from possible answers of “aware”, “aware but don't know how to use” and “not aware”. For nutrition label use, participants were asked whether they consulted such labels before buying processed foods. The self-diagnosis of dietary habits consisted of 21 items (12 desirable including meal regularity, appropriate amount at each meal, eating rice foods, vegetables, vegetable oil, milk/dairy foods, fruits/sugarless fruit juice and seaweed, pleasant eating atmosphere, balanced diet, not skipping breakfast and regular exercise and 9 undesirable including eating processed foods, delivery foods, saturated fat/cholesterol, salty foods/MSG and sweet foods, eating out, excessive drinking, drinking more than 3 caffeinated drinks and excessive smoking) [12]; the participants were asked to select the appropriate frequency among “0–2 days”, “3–5 days”, and “6–7 days” per week. For desirable items, 1, 3, and 5 points were coded, respectively, whereas the reverse was true for undesirable items. Thus, the number of possible points was higher for better dietary habits.
Statistical analysis
The survey results were analyzed using SPSS ver. 25.0 (IBM Corp., Armonk, NY, USA). The participants were divided into 3 groups according to their frequency of watching Mukbang and Cookbang, seperately: the frequent-watching (FW) group consisted of those who answered “often”; the moderate-watching (MW) group consisted of those who answered “sometimes”; and the not-watching (NW) group consisted of those who answered “never” and “maybe, but not sure” (Table 1). Self-diagnosis scores were represented as mean of 21 dietary habits and the differences between the 3 groups for each genre were tested by analysis of variance followed by Duncan's multiple range test, with significance set at P < 0.05. The χ2 tests were used to test the significance of differences in other variables among the groups.
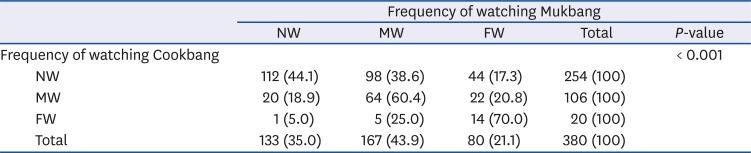
Table 1
Distribution of Cookbang-watching frequency according to Mukbang-watching frequency of the subjects
![]()
Go to :
RESULTS
Participants
Table 1 shows distribution of Cookbang-watching frequency according to the Mukbang-watching frequency of participants. The largest proportion in the Cookbang FW group, 70.0%, belonged to the Mukbang FW group and the largest proportion in the Cookbang NW group, 44.1%, belonged to the Mukbang NW group (P < 0.001).
Table 2 shows descriptive data for participants grouped according to their Mukbang- or Cookbang-watching frequencies. There was no significant between-group difference in sex, grade, or residential type. Smartphone use time was not significantly different among the groups according to Cookbang-watching frequency. In the case of Mukbang, 38.8% of the FW group used a smartphone more than 6 hours/day, while only 25.1% of MW group and 19.5% of NW group fell into this usage category (P < 0.05).
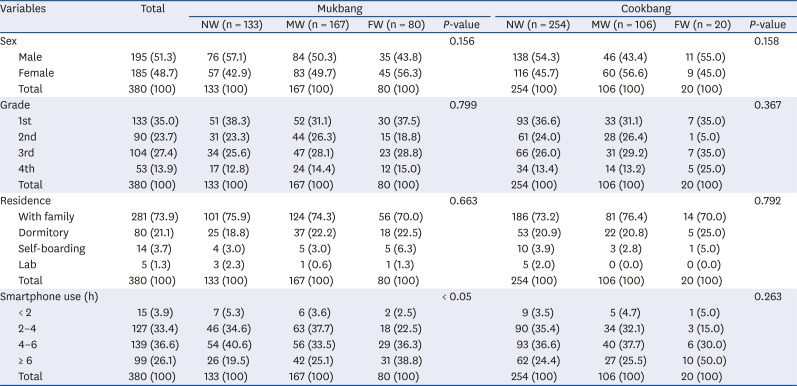
Table 2
The general characteristics of the study subjects
![]()
Dietary life
Table 3 compares the dietary life among participants grouped by their frequency of Mukbang- or Cookbang-watching. Neither set of groups showed any significant difference in the awareness of nutrition labels and whether they used such labels before buying processed foods.
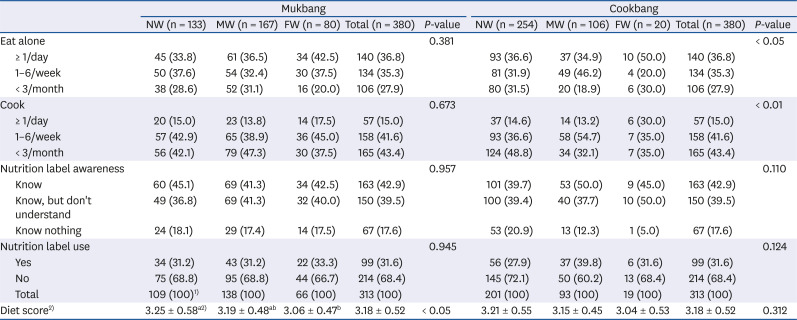
Table 3
Dietary life of the university students according to their Mukbang- and Cookbang-watching status
Data are shown as mean ± SD or number (%).
NW, not watching; MW, moderate watching; FW, frequent watching.
1)Analyzed only in participants who reported being aware of nutrition labels.
2)Mean from self-reported 21 items of dietary habits. Means with a same superscript were not significantly different.
![]()
In the case of Cookbang, participants in the FW group reported eating alone (P < 0.05) and cooking for themselves (P < 0.01) significantly more frequently than those in the MW and NW groups. Up to 50.0% of participants in the Cookbang FW group reported eating more than one meal per day alone, whereas these percentages were 34.9% in the MW group and 36.6% in the NW group. Also, up to 30.0% of participants in the Cookbang FW group reported cooking more than one meal per day for themselves, whereas these percentages were 13.2% in the MW group and 14.6% in the NW group.
The Mukbang FW group had a significantly lower mean score for the 21 items, compared to the NW group (3.06 vs. 3.25, respectively, P < 0.05). But, there was no significant difference in the mean score of the 21 items when participants were grouped with respect to Cookbang watching.
Watching status
The Mukbang- and Cookbang-watching patterns were compared between the FW and MW groups (Table 4). In the case of Mukbang, compared to the MW group, significantly more of the FW group reported watching it “at least 3 days a week” (88.8% vs. 19.8%, respectively, P < 0.001) and “at least 30 minutes a day” (56.3% vs. 27.3%, respectively, P < 0.001). In the case of Cookbang, compared to the MW group, significantly more of FW group reported watching it “at least 3 days a week” (70.0% vs. 17.9%, respectively, P < 0.001) and “at least 30 minutes a day” (60.0% vs. 25.5%, respectively, P < 0.05).
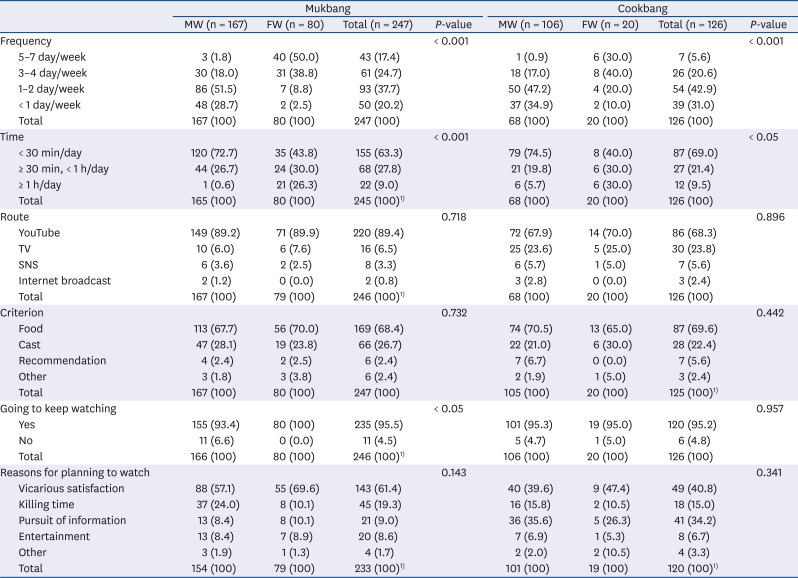
Table 4
Mukbang- and Cookbang-watching habits of the university students grouped by watching status
Values are presented as number (%).
MW, moderate watching; FW, frequent watching.
1)Missing response.
![]()
There was no significant between-group difference in the principal consumption route and the criterion used to select the program or the main motive for watch Mukbang and Cookbang between the FW and MW groups in each case. The most common consumption route for Mukbang was YouTube (89.4%), followed by social network service (6.5%), TV (3.3%), and internet broadcasting (0.8%); although YouTube was also the most common route for Cookbang, the proportion was much smaller (68.3%). For both Mukbang and Cookbang watchers, the criterion most commonly used to select a program was “food”, followed by the cast. For Mukbang, 100% of the FM group and 93.4% of the MW group answered that they intended to keep watching such programming (P < 0.05). For Cookbang, there was no difference in the proportion of the FW and MW groups that reported they intended to keep watching the programming (95.2% in both groups). The most commonly reported motive for watching Mukbang was “vicarious satisfaction” (61.4%), followed by “killing time” (19.3%) and “seeking information” (only 9.0%). For Cookbang, “vicarious satisfaction” was the most common answer (40.8%), but a relatively high proportion reported that they were “seeking information” (34.2%) and fewer answered that they watched the program with the goal of “killing time” (15.0%).
Diet changes related to Mukbang- and Cookbang-watching
Tables 5 and 6 compares the participants' perceptions of how their diets were influenced by watching Mukbang or Cookbang. For Mukbang, 29.1% reported that watching Mukbang increased their intake through eating out and delivered and convenience foods, whereas only 3.2% reported that their viewership decreased it. In the FW and MW groups, 11.3% and 6.6%, respectively, reported that watching Mukbang worsened their diet, while 7.5% and 0%, respectively, reported that viewership improved their diet (P < 0.05).
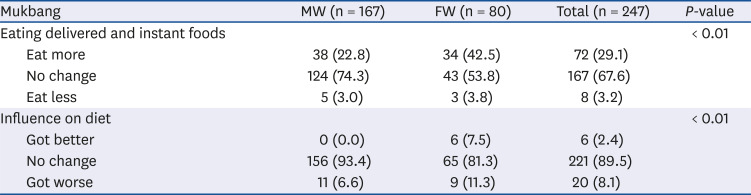
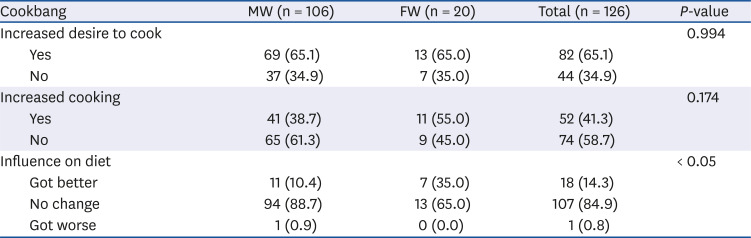
Table 5
The university students' perceptions of influence of Mukbang-watching influences their diet
![]()
Table 6
The university students' perceptions of influence of Cookbang-watching influences their diet
![]()
Only one subject of Cookbang answered that viewership worsened their diet, whereas 35.0% of the FW group and 10.4% of the NW group reported that viewership improved their diet. Compared to MW group, the FW group had a significantly more favorable perception of how watching Cookbang affected their diet, since a greater proportion of this group reported that watching Cookbang improved their diet (P < 0.05). Up to 65.1% answered that watching Cookbang increased their desire to cook and 41.3% reported that it actually increased their frequency of cooking; there was no significant difference between the FW and MW groups in this regard.
Go to :
DISCUSSION
The most notable finding from this study is that frequent watching of Cookbang and Mukbang may have different associations with the diet of university students. Using 4 categories, we found evidence suggesting that excessive watching of Mukbang, but not Cookbang, may adversely influence the diet of young adults.
Firstly, frequent watchers of Mukbang scored their diet significantly worse than the less-frequent watchers of this genre, whereas the means were not significantly different between groups according to their Cookbang-watching frequency.
Secondly, the students had different perceptions of how Mukbang- and Cookbang-watching affected their diet. More participants felt that their diets improved rather than worsened by watching Cookbang, with more dramatically in FW group, while in case of Mukbang, far more participants felt that it worsened their diet rather than improved it. A significant positive change was previously associated with the acquisition of dietary information from TV cooking programs among adults [13].
Thirdly, as much as two thirds of the frequent watchers of Cookbang answered that Cookbang-watching increased their desire to cook and 55% answered that they actually cooked more frequently thanks to their viewership, whereas Mukbang-watching seemed to be associated with rather undesirable diets, since the participants felt that Mukbang-watching prompted them to eat more of less-desirable foods, such as through eating out and consuming convenient and delivered foods. This perception was significantly greater in frequent watchers than in moderate watchers.
Fourthly, the motives ascribed to viewership were also different between Mukbang and Cookbang. Our results suggested that Cookbang-watching was more often undertaken for the relatively practical purpose of “seeking information”, compared to Mukbang-watching, while the latter was more frequently associated with less-desirable motivations, such as “vicarious satisfaction” and “killing time”.
Although the use of different variables in various reports makes it difficult to perform a direct comparison, our results may be inconsistent with those some previous studies. For example, Jin and Hwang [14] surveyed 256 Korean university students and reported that the frequency of food delivery service was not changed by viewing a personal ‘Food Web Casting’ program. In contrast, our participants felt that viewing Mukbang increased their eating of foods that were usually considered unhealthy, such as delivered foods. Indeed, Korea has seen increasing questions regarding whether Mukbang-watching may lead to binge eating and negatively impact public health. The Korean government recently launched the “National Obesity Management Comprehensive Plan”, which would develop and enforce Mukbang guidelines and focus media attention on binge eating [15]. However, criticisms were levied against the ministry in this context, and the Blue House petition board received petitions arguing against the Mukbang regulations and denouncing the purported association between Mukbang and binge eating [16]. It does seem potentially relevant that a study comparing the appetite of college students who watched YouTube's most popular Mukbang for 10 minutes versus that of colleagues who watched an irrelevant program (dominoes falling down) for the same time period did not find any evidence of an association between Mukbang-watching and increased appetite [17].
Our observation that only 9.0% of Mukbang-watching participants and as much as 34.2% of Cookbang-watching participants reported “seeking information” as a motive for this viewership are comparable to those of a previous study [18] that found “seeking information” (hot restaurant information) was a greater motivation for Mukbang viewers than “seeking information” (recipe information) for Cookbang viewers. The previously mentioned study in which university students watched personal internet broadcasting of Mukbang [14] found that the most common motivation for viewership was “killing time”, followed by “gourmet pursuit”, “seeking information” and “vicarious satisfaction”, which was comparable to our results. The different results obtained for viewership motivation may reflect differences in the definition and/or watching routes of Mukbang. The original narrow definition of Mukbang is “a live online audiovisual broadcast in which a host eats large amounts of foods while interacting with their audience” [1]. Today, however, some Mukbang programs (especially on TV) present more positive and informative content in a variety of formats, such as exploring gourmet restaurants and novelty food ingredients in Korea’s backcountry and famous cities worldwide. Conversely, personal internet broadcasting offers real-time cast/viewer interactions, allowing viewers to push the cast to overeat, and such programming is not obliged to comply with the broadcasting review regulations that govern TV programming.
Although the emotional hunger of people living alone has been suggested to contribute to the popularity of Mukbang [2], we did not find that university students who lived alone (dormitory-living, lab-living, and self-boarding) tended to watch Mukbang more frequently than those who lived with family. These results are consistent with those of a previous study [4] in which 669 adults did not differ in their reported viewing motivation and level of satisfaction between single-person households and/or lone diners versus those who lived with family and ate together.
This study also showed that up to 62.7% of our participants used a smartphone more than 4 hours a day and 89.4% and 68.3% answered that the principal consumption routes to watch Mukbang and Cookbang were YouTube, suggesting that this excessive use might lead to more and more watching of food-related content through YouTube, especially Mukbang, in the future. Therefore, our results indicate that strategies should be developed to prevent university students' diets from worsening due to the adverse effects of over-viewing of food-related programming, especially Mukbang.
This study has some limitations. First, it is difficult to generalize the results due to the small size of the study sample. Second, it is challenging to identify causality because we used a cross-sectional study design and a self-administered questionnaire. For example, we observed that more of the Cookbang FW group reported eating alone (Table 3) and that Cookbang-watching was associated with increases in the desire to cook and actual cooking behavior (Table 6). While this shows that there is a possible association between cooking and watching Cookbang, we cannot say which is the cause and which is the effect. Finally, it seemed hard to disparate the effect of Mukbang and Cookbang, since the majority of frequent Cookbang watchers was frequent Mukbang watchers. Despite these limitations, however, we believe this to be the first study examining the associations of university students' diets with viewership of Mukbang versus Cookbang. Considering that almost all the watchers of Mukbang or Cookbang reported that they intended to keep watching such programming in the future, this study suggests that we urgently need develop nutritional education emphasizing the importance of wisely consuming Mukbang.
Go to :
 XML Download