

 PDF
PDF Citation
 Print
Print


INTRODUCTION
SUBJECTS AND METHODS
Data collection
Menu label conditions
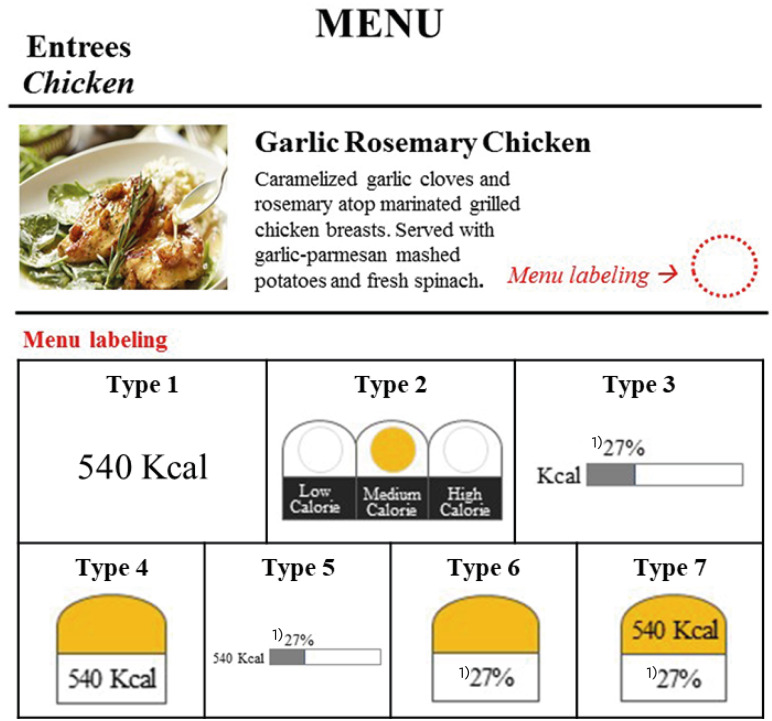 | Fig. 1Types of menu-labeling formats.Type 1, kcal menu labeling; Type 2, traffic-light menu labeling; Type 3, %DI menu labeling; Type 4, kcal + traffic-light menu labeling; Type 5, kcal + %DI menu labeling; Type 6, traffic-light + %DI menu labeling; Type 7, kcal + traffic-light + %DI menu labeling. (%DI, percent daily intake).
1)Number (%): percent of Recommended Dietary Allowance.
|
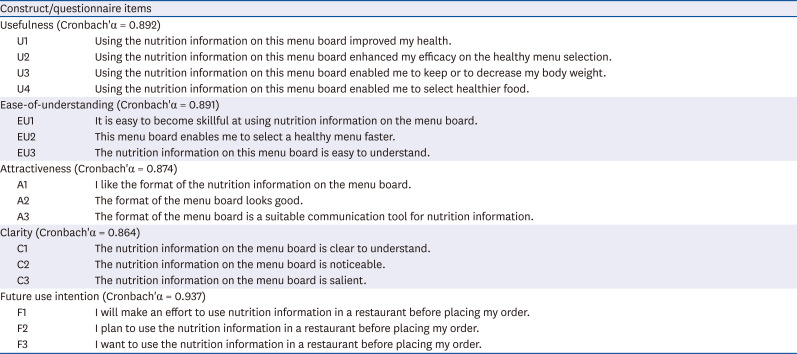
Research instrument
Table 1
Description of measures
![]()
Statistical analysis
RESULTS
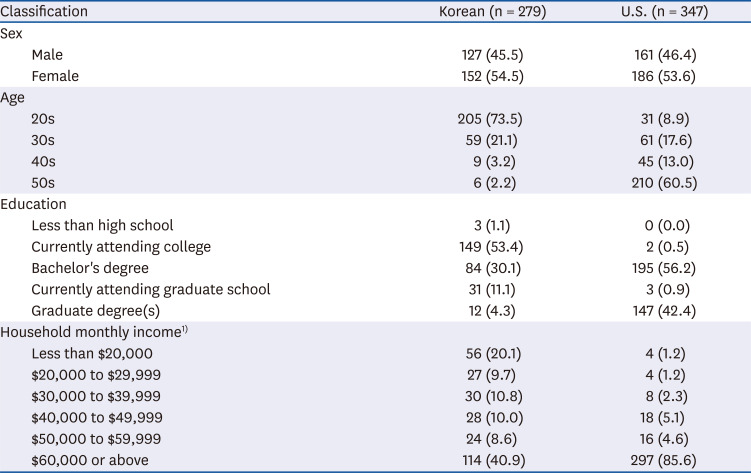
General characteristics of the respondents in Korea and the U.S.
Table 2
General characteristics of the respondents in Korea and the U.S.
![]()
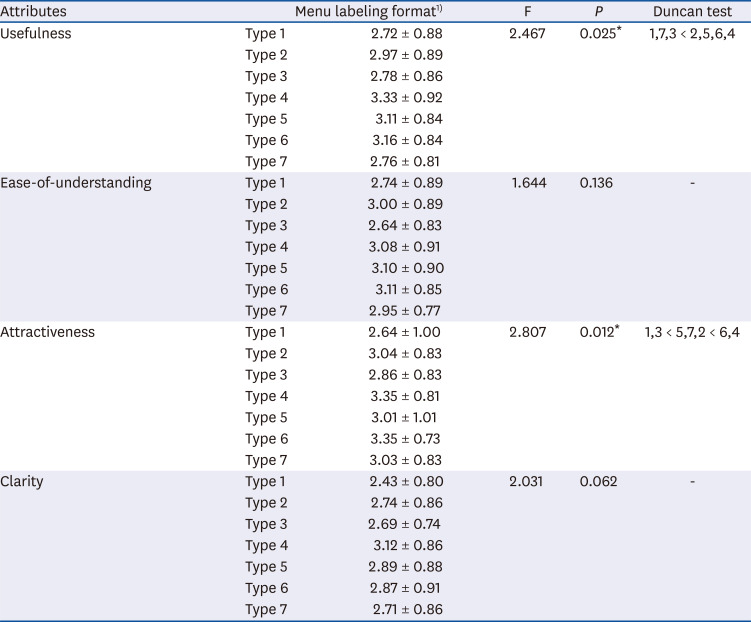
Perception of the attributes of different formats of menu labeling in Korea and the U.S.
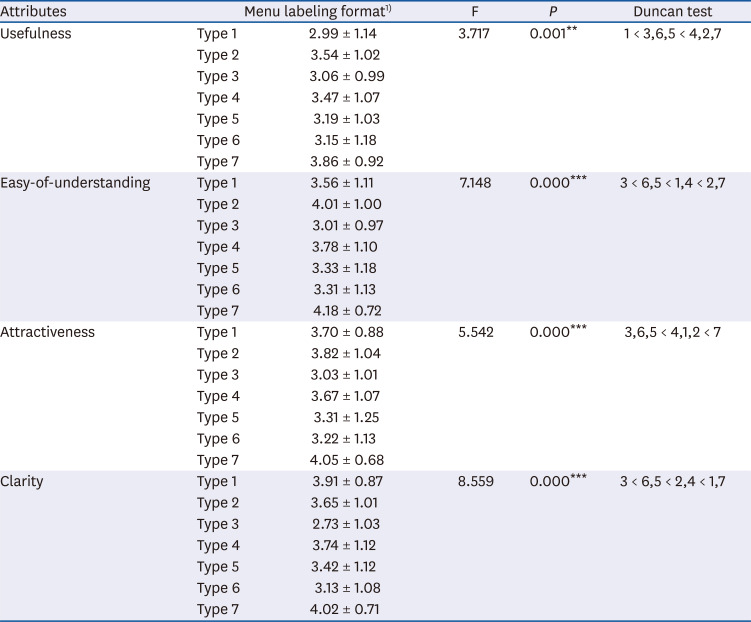
Table 3
Korean customers' perception of the attributes of different formats of menu labeling (n = 279)
![]()
Table 4
American customers' perception of the attributes of different formats of menu labeling (n = 347)
![]()
Comparison of the customers' perceived attributes of menu labeling between Korea and the U.S.
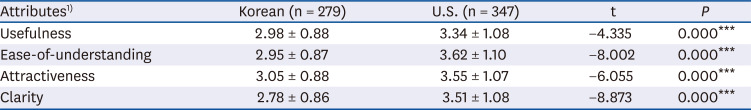
Table 5
Comparison of the customers' perception of the attributes of menu labeling between Korea and the U.S.
![]()
Customers' future use intention toward different formats of menu labeling in Korea and the U.S.
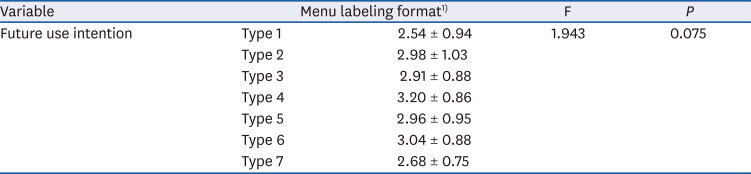
Table 6
Korean customers' future use intention toward different formats of menu labeling (n = 279)
![]()
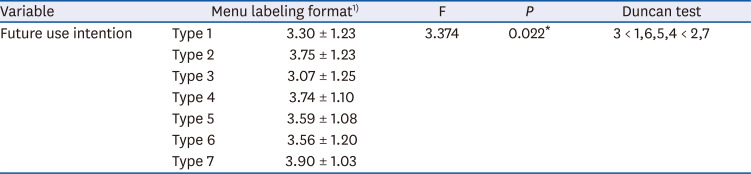
Table 7
U.S. customers' future use intention toward the different formats of menu labeling (n = 347)
![]()
Comparison of the customers' future use intention toward menu labeling between Korea and the U.S.
Table 8
Comparison of the customers' future use intention toward menu labeling between Korea and the U.S.

| Variable1) | Korean (n = 279) | U.S. (n = 347) | t | P |
|---|---|---|---|---|
| Future use intention | 2.91 ± 0.92 | 3.58 ± 1.18 | −7.515 | 0.000*** |
![]()
DISCUSSION
1. Korean customers had different perceptions toward different formats of menu labeling for usefulness and attractiveness. Koreans rated the type 4 (kcal + traffic light) format as highest for usefulness and attractiveness, while the type 1 (kcal) format was rated lowest for usefulness and attractiveness by Koreans.
2. American customers perceived the different formats of menu labeling for usefulness, ease-of-understanding, attractiveness, and clarity differently. Americans perceived type 7 (kcal + traffic light + %DI) to be the highest for usefulness, ease-of-understanding, attractiveness, and clarity. On the other hand, the type 3 (%DI) format was rated the lowest for usefulness, ease-of-understanding, attractiveness, and clarity by Americans.
3. Significant differences in the customers' perceived attributes to menu labeling were found between Korea, and the U.S. Americans perceived higher usefulness, ease-of-understanding, attractiveness, and clarity toward menu labeling than Koreans.
4. Koreans did not show a significant difference in the future use intention toward the different formats of menu labeling.
5. The Americans showed a significant difference in the future use intention toward different formats of menu labeling. They revealed the type 3 (%DI) format to be the lowest in the future use intention toward menu labeling.
6. Americans showed a significantly higher future use intention toward menu labeling than Koreans.
 XML Download