

 PDF
PDF Citation
 Print
Print


INTRODUCTION
Phytochemicals are plant-derived substances with various known health benefits such as anti-inflammatory, antioxidant, and anticancer effects [12345]. Previous epidemiologic studies of various populations have demonstrated that the consumption of phytochemical-rich foods can help prevent cardiovascular and metabolic diseases [678910].
Recently, a new dietary index, the phytochemical index (PI), was developed to efficiently assess the health effects of phytochemical-rich food intakes in large population-based epidemiologic studies [781112131415]. For example, the Tehran Lipid and Glucose Study calculated a PI based on the daily energy intake derived from phytochemical-rich foods and examined the cross-sectional associations of this index with metabolic risk factors [15161718]. In that study, participants with higher PI values reported a lower prevalence of abdominal obesity and hypertriglyceridemia [16]. Additionally, a recent case-control study of the association between PI and prediabetes reported that a higher PI is significantly associated with a lower risk of prediabetes [19].
There is a paucity of data on the association between the consumption of phytochemical-rich foods and metabolic disorders in the Korean population. To date, the majority of previous Korean studies have solely focused on the effects of specific foods or food groups such as fruits and vegetables [202122]. Given the increasing prevalences of metabolic syndrome and type 2 diabetes in various Asian countries, including Korea, it is necessary to identify dietary factors that may prevent these diseases and understand their roles in human health. Therefore, the present study aimed to establish a PI for a Korean population and analyze the association between PI and metabolic syndrome using data from the Korea National Health and Nutrition Survey (KNHANES).
Go to : 
SUBJECTS AND METHODS
Data source
The KNHANES is a nationwide cross-sectional health and nutrition survey of non-institutionalized residents of South Korea who are aged ≥ 1 year. All participants provided signed informed consent. Details of this survey have been reported elsewhere [23]. Briefly, survey sampling was conducted using a complex, stratified, multistage, and clustered method. Demographic, lifestyle, dietary, and health data were collected through a health interview, health examination, and nutritional survey. Initially, the KNHANES was first applied as a series of three surveys in 1998, 2001, and 2005. Since 2007, however, the KNHANES has been administered year-round to produce timeline data while excluding seasonal variations.
In this study, we attempted to include all available KNHANES data, including all key variables for the analysis. Regarding these key variables, physical activity questionnaires were not administered in 1998 and 2001, and some details were omitted in 2005. In addition, only 8% of participants responded in 2007. Therefore, this study only analyzed data from the KNHANES during 2008–2016.
The KNHANES was approved by the Institutional Review Board (IRB) of the Korea Centers for Disease Control and Prevention. This entity provided formal ethics approval for the KNHANES data sets (IRB numbers: 2008-04EXP-01-C, 2009-01CON-03-2C, 2010-02CON-21-C, 2011-02CON-06-C, 2012-01EXP-01-2C, 2013-07CON-03-4C, and 2013-12EXP-03-5C).
Participants
Of the 76,909 people who participated in the KNHANES 2008–2016, we excluded the following: (1) those younger than 19 years (n = 17,823); (2) those with missing sampling weight information (n = 9,798); (3) pregnant or lactating women (n = 739); (4) those with extremely low or high total daily energy intakes (< 500 or > 5,000 kcal; n = 835); (5) patients with known chronic diseases, including hypertension, diabetes, cardiovascular disease, and cancer (n = 14,411); and (6) those with missing data on metabolic biomarkers, including waist circumference (WC), fasting blood sugar, systolic/diastolic blood pressure, triglycerides, or high-density lipoprotein (HDL)-cholesterol levels (n = 1,984). Finally, our analysis included 31,319 participants.
Demographic information
Demographic and lifestyle data were obtained from the questionnaires. These data included age, sex, education level, household income level, job status, obesity status, family history of diabetes, smoking habits, drinking status, and physical activity level. The participants’ education levels were reclassified into two categories: lower than high school graduation and high school graduation or higher. The household income levels were categorized into four groups: low, mid-low, mid-high, and high. A positive family history of diabetes was defined as having at least one parent with diabetes. The smoking status was classified into 2 categories: smokers and non-smokers. The daily alcohol intake was calculated by multiplying the servings of alcohol consumed in one sitting by the frequency of consumption. The physical activity level was calculated in terms of metabolic equivalents of task (MET-hours per week) and categorized into tertiles [24].
PI
The PI was calculated using one day (24-hour) recall data collected by trained interviewers who visited participating households during the examination. The following formula was used to calculate the PI: daily energy intake derived from phytochemical-rich foods (kcal) ÷ total daily energy intake (kcal) × 100 [15]. The following food groups were included in the PI calculation: whole grains, vegetables, fruits, legumes, nuts and seeds, and soy products. Fresh soybean products, including tofu, fried tofu, soybean paste, cheonggukjang, and natto, as well as extra virgin olive oil, which is rich in absorbable antioxidants were also included. Considering the high consumption of seaweed among Koreans, we included seaweeds as well in our PI calculation. Generally, fresh fruit and vegetable juices are also included in the calculation. However, the majority of fruit and vegetable juice products consumed by this population are industrially canned or bottled products, which contain low amounts of phytochemicals [252627]. Accordingly, these products were excluded from the PI calculation. Some grain products with a whole grain content < 50%, potatoes, pickled vegetables (including kimchi), and powdered vegetable and soybean products were also excluded.
Anthropometry and metabolic biomarkers
The body mass index (BMI) was calculated by dividing the body weight (kg) by the square of the height (m2). The BMI cut-off value from the World Health Organization criteria for Asian populations [28] was used to define the following categories: underweight/normal weight (< 23 kg/m2), overweight (≥ 23 to < 25 kg/m2), and obese (≥ 25 kg/m2). WC was measured at the midpoint between the bottom of the least palpable rib and the top of the iliac crest using a stretch-resistant tape.
The participants were asked to fast for at least 8 hours before blood collection. Subsequently, fasting blood samples were sent to a certified laboratory for analyses of the blood glucose, triglyceride, and HDL-cholesterol levels. The laboratory analyses were performed using an ADIVIA 1650 system (Tarrytown, NY, USA) in 2008 and the Hitachi Automatic Analyzer 7600 (Hitachi, Tokyo, Japan) during 2009–2016.
The systolic and diastolic blood pressure were measured twice on the right arm using a mercury sphygmomanometer (Baumanmeter® Desk Model 0320; WA Baum, New York, NY, USA) while the participant was seated. Blood pressure levels were measured thrice, and the average values of the second and third measurements were included in the analysis.
Metabolic syndrome was defined according to the criteria of the modified National Cholesterol Education Program III for the Asian population [29]. Participants who met at least 3 of the following criteria were defined as having metabolic syndrome: (1) a WC ≥ 90 cm in men and ≥ 80 cm in women; (2) fasting glucose level ≥ 100 mg/dL or use of medication for diabetes (insulin or oral agents); (3) triglyceride level ≥ 150 mg/dL or use of lipid-lowering medication; (4) HDL-cholesterol level < 40 mg/dL in men and < 50 mg/dL in women; and (5) blood pressure level ≥ 130/85 mmHg or use of antihypertension medication.
Statistical analysis
Multistage, stratified, and clustered sampling methods were used in the analysis. The age- and total energy-adjusted mean values of daily calorie intakes of the components included in the PI calculation, namely whole grains, vegetables, fruits, legumes, soy products, nuts and seeds, seaweeds, and olive oil, were calculated using a multivariate regression model.
The participants were classified according to PI quintiles, and logistic regression models were used to calculate the odds ratios (ORs) and 95% confidence intervals (CIs) for the association between PI and the prevalence of metabolic syndrome. A preliminary analysis and literature review were conducted to identify potential confounding factors [16171830], and effect modifiers were tested using multiplicative terms in the models. Consequently, the following 3 covariate models were constructed: (1) model 1, unadjusted; (2) model 2, adjusted for age and sex; and (3) model 3, additionally adjusted for education, household income level, smoking status, drinking status, and physical activity level. All statistical analyses were performed using SAS software, version 9.4 (SAS Institute, Cary, NC, USA), and the statistical significance level was set at α = 0.05.
Go to :
RESULTS
Intake levels of PI components
Table 1 shows the adjusted mean PI values and calorie intake levels from the food groups used to calculate the PI. The average PI value was higher in women than in men (16.49 ± 0.12 vs. 12.68 ± 0.11, P < 0.001). Moreover, the caloric intake levels of all PI components except for soy products were significantly higher in women than in men (P < 0.05).
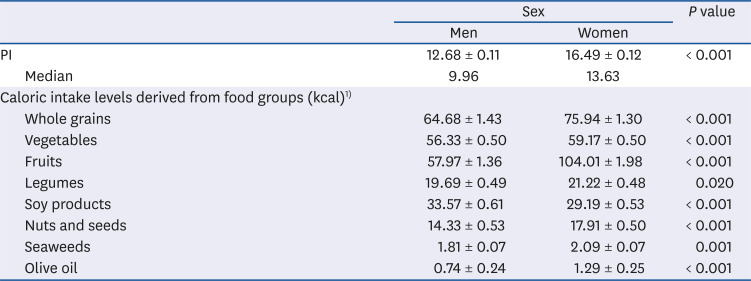
Table 1
PI and dietary intake levels of food components included in the PI calculation stratified by sex (KNHANES 2008–2016, n = 31,319)
Values are shown as means ± SE.
PI, phytochemical index; KNHANES, Korea National Health and Nutrition Examination Survey.
1)Adjusted for age and total energy intake.
![]()
General characteristics of participants according to PI score
Generally, higher PI scores were observed for women, elderly participants, individuals with a higher household income and/or lower education level, non-smokers, non-alcohol drinkers, and obese participants (all P < 0.01, Table 2). Participants with lower physical activity levels had a significantly lower PI (P = 0.004).
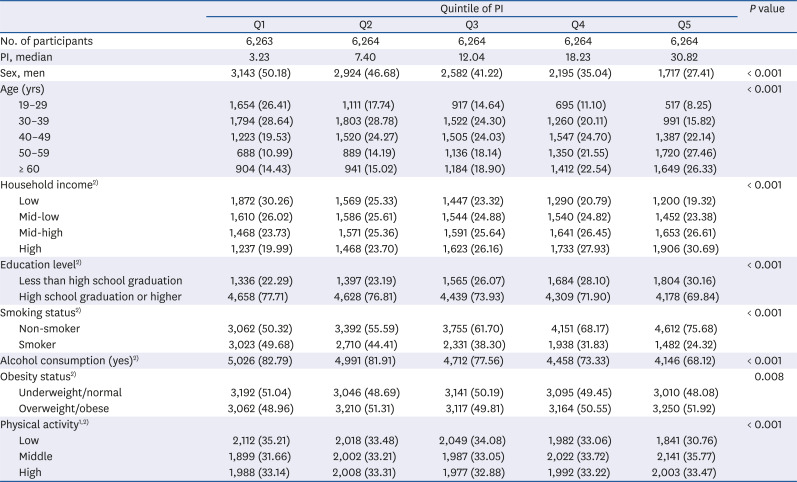
Table 2
General characteristics of the participants according to the PI quintiles (KNHANES 2008–2016, n = 31,319)
Values are presented as number of patients (%).
PI, phytochemical index; KNHANES, Korea National Health and Nutrition Examination Survey; Q, quintile.
1)Physical activity level was calculated as metabolic equivalents of task (MET-hours per week) and grouped into tertiles.
2)These categories had missing data, and the total n values are not identical.
![]()
Metabolic biomarkers according to PI
Table 3 presents a multivariable-adjusted comparison of metabolic biomarker levels according to the PI value. Notably, significant associations of the fasting blood glucose and triglyceride levels and blood pressure (systolic and diastolic) levels with the PI score were observed, and these relationships exhibited a dose-response pattern (P for trend < 0.05). However, the WC and HDL-cholesterol levels did not differ significantly among PI quintiles (WC: P for trend = 0.1, HDL-C: P for trend = 0.5).
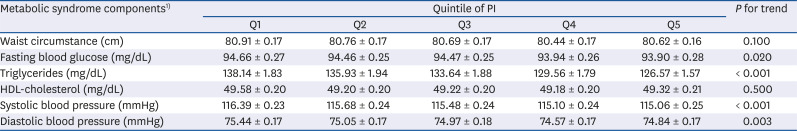
Table 3
Adjusted average levels of metabolic biomarkers according to the dietary PI quintiles (n = 31,319)
PI, phytochemical index; Q, quintile; HDL, high-density lipoprotein.
1)Values are adjusted for age, sex, education level, household income, smoking status, alcohol drinking, and physical activity level.
![]()
Table 4 presents the ORs for abdominal obesity, hyperglycemia, high blood pressure, hypo-HDL cholesterolemia, hyperglyceridemia, and metabolic syndrome according to the PI quintiles. The age- and sex-adjusted models revealed inverse correlations of the PI quintile with the prevalence of abdominal obesity (P for trend < 0.001), hyperglycemia (P for trend = 0.002), high blood pressure (P for trend < 0.001), hypertriglyceridemia (P for trend < 0.001), and metabolic syndrome (P for trend < 0.001). These inverse linear trends remained statistically significant after adjusting for the additional confounding factors in model 3. Compared with the lowest PI quintile in model 3, participants in the highest (fifth) PI quintile were less likely to present with abdominal obesity (OR: 0.90, 95% CI: 0.81–0.99), hyperglycemia (OR: 0.83, 95% CI: 0.74–0.94), high blood pressure (OR: 0.82, 95% CI: 0.73–0.93), hypertriglyceridemia (OR: 0.84, 95% CI: 0.75–0.94), and metabolic syndrome (OR: 0.78, 95% CI: 0.69–0.88).
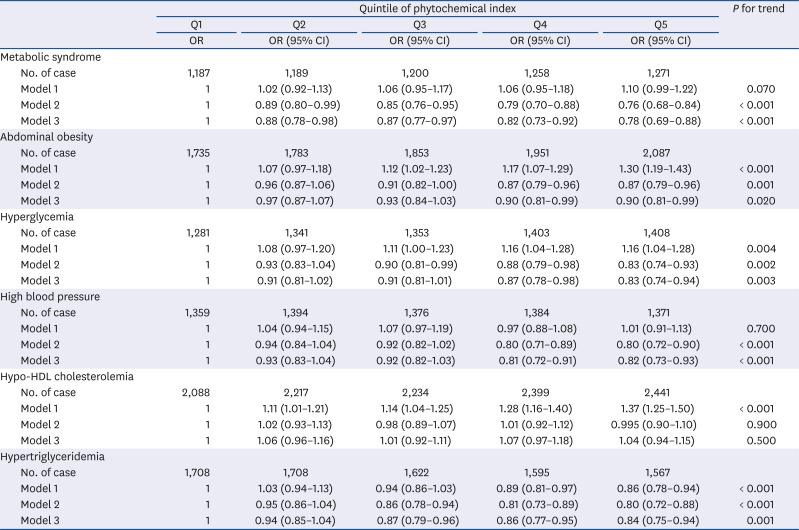
Table 4
ORs (95% CIs) for metabolic syndrome and its components according to the dietary phytochemical index quintiles (n = 31,319)
Model 1: unadjusted; Model 2: adjustment for age and sex; Model 3: model 2 plus additional adjustments for education level, household income, smoking status, alcohol consumption, and physical activity level.
OR, odds ratio; CI, confidence interval; Q, quintile; HDL, high-density lipoprotein.
![]()
Go to :
DISCUSSION
In this study, we observed that higher PI levels were associated with a lower prevalence of various forms of metabolic dysregulation, including abdominal obesity, hyperglycemia, high blood pressure, hypertriglyceridemia, and metabolic syndrome. In this population, whole grains, vegetables, and fruits were major food sources contributing to PI. Generally, women consumed larger amounts of whole grains, vegetables, fruits, nuts and seeds, and olive oil than men and therefore, tended to have higher PI values.
Many studies have emphasized the health benefits of consuming foods rich in phytochemicals [161830]. According to the Tehran Lipid and Glucose Study, a higher PI was associated with lower WC, systolic and diastolic blood pressure, and triglyceride levels, as well as significantly lower risks of abdominal obesity and hypertriglyceridemia [16]. In another study, Bahadoran et al. [30] reported that a higher PI was associated with reductions of 86%, 52%, and 89% in the risks of hyperinsulinemia, insulin resistance, and insulin insensitivity, respectively. One previous study of the associations between PI and blood lipid levels reported significantly better total blood lipid, total cholesterol, and non-HDL-cholesterol concentrations in men with a higher PI [18].
Some researchers have attributed the biological mechanisms underlying the occurrence of metabolic syndrome to insulin resistance and obesity [31]. In a person with insulin resistance, the body does not respond normally to secreted insulin [32], thus leading to hyperinsulinemia and subsequent development of other cardiometabolic risk factors such as high blood pressure and dyslipidemia, which are also known risk factors for metabolic syndrome [33]. The cumulative evidence associates the consumption of phytochemicals abundant in plant-based foods, particularly polyphenols, with improvements in insulin resistance [34]. Specifically, polyphenols regulate insulin production and secretion and protect pancreatic β-cells from oxidative stress [3435]. Moreover, some polyphenols increase insulin-dependent glucose uptake in the context of insulin resistance by inducing the cell membrane localization of GLUT4 via the activation of AMP-activated protein kinase, a signal transducer involved in insulin secretion from β-cells [3436]. The beneficial flavonoid quercetin contributes to reductions in blood pressure, visceral fat, and body fat and promotes the apoptosis of adipocytes, while genistein is associated with decreases in BMI and fat mass and increases in HDL-cholesterol and glucose tolerance [37].
This study had several strengths. For example, the use of data from the KNHANES, a South Korean nationally representative cross-sectional survey, enhanced the generalizability of our results. Moreover, to the best of our knowledge, this was the first study to examine the effects of the magnitude of phytochemical intake on metabolic health in a Korean population. However, this study also has some limitations to note. First, the association between PI and metabolic syndrome was analyzed using cross-sectional data, and therefore causality could not be determined. To minimize the possibility of reverse causality, we excluded patients who were aware of their chronic disease statuses and thus, could have changed their diet or lifestyle habits after diagnosis. Second, we calculated PI using one day (24-hour) recall data, which might not have reflected the participants' usual intake levels accurately. PI was also calculated using calories from consumed food items, and therefore food items containing zero calories could not be included. Despite these limitations, however, PI appears to be a useful surrogate index of phytochemical intake level with a confirmed predictive validity.
In conclusion, we determined an association of our newly calculated PI with metabolic syndrome in a sample of Korean adults. Our findings support dietary guidelines that emphasize intake of phytochemical-rich foods. Large-scale prospective cohort studies or randomized clinical trials are warranted to confirm our findings.
Go to :
 XML Download