

 PDF
PDF Citation
 Print
Print


INTRODUCTION
Childhood obesity is caused by complex interactions among individual, environmental, and behavioral factors, and can result in chronic medical and psychosocial health problems over the lifespan [1]. In Korea, the number of severely obese children and adolescents has doubled over the past decade [2]. This population may develop chronic comorbid conditions because of excess adiposity [3]. Metabolic syndrome (MS) prevalence in severely obese children has been estimated to be as high as 50% [4]. Current treatment options appear to have limited effectiveness and scalability in severely obese children and adolescents [5].
Adequate nutrition and a balanced diet are key [6] to healthy maturation and the physical growth and development of children and adolescents. Nutritional professionals (registered dietitians/nutritionists) can play an integral role in promoting weight control and a healthy diet in obese children. The nutrition care process (NCP) model [7] is a systematic tool designed for diverse individuals and populations to provide nutritional care and management using evidence-based guidelines [89]. This model can enhance the consistency and quality of people-centered nutritional care [101112].
Integrated theoretical models of behavior change can lead to significant improvements in nutrition-related behaviors [13]. The transtheoretical model (TTM) has been used to promote healthy behavioral changes in several stage-based intervention studies [141516]. The latest studies that have used the TTM to design interventions for obese children and adolescents have reported decreased energy and carbohydrate intake and BMI-z score [14], decreased fatty food consumption, increased fruit and vegetable consumption [15], and lower diastolic BP (DBP) [16]. Recently, a stage-based tailored nutrition information message for dietary behavior change designed for mobile devices was developed to manage childhood obesity [17].
Previous researchers reported that higher (≥ 75%) levels of intervention session attendance were related to a decrease in the proportion of overweight patients with type 2 diabetes [18] and weight loss in severely obese children [19]. In another study, the adequacy of proposed energy, carbohydrate, protein, fat intake, and meal frequency were measured as proxies for dietary compliance with the intervention [20]. A systematic review paper found that improvement in weight status was related to reduced energy intake [21].
Few studies, however, have adopted an individual NCP model to treat childhood obesity. There is a dearth of evidence-based nutritional intervention studies in moderate to severe obese children and adolescents. Evidence-based research is needed to identify complex, obesity-related nutritional problems in moderate to severe obese children and adolescents.
Therefore, in this study, we investigated the effects of a 16-week, evidence-based, customized nutritional intervention on body composition, macronutrient intake, and nutritional behavior in moderate to severe obese children and adolescents based on their adherence to the intervention program.
SUBJECTS AND METHODS
Subjects and settings
Children and adolescents who met the following inclusion criteria were invited to enroll in this study: 7-16 years of age with a BMI in the 95th percentile for age and sex or higher. Recruitment was performed via newspapers, broadcasting, posters, websites, and other social networking services in the Geonggi and Seoul (South Korea) areas from January to August, 2016. Eligible subjects who agreed to participate in the intervention program signed informed consent after explanation of the study goals and procedures to be followed. The sample size on power in studies of group differences in BMI-z score between groups. We used for power 80% with a two-sided significance level set at 0.05 to detect differences of 0.1 between groups. In total, one hundred three participants enrolled in the study and sixty-six moderate to severe obese children and adolescents completed the study. This study was approved by the Hallym University Sacred Heart Hospital's Institutional Review Board (approval number: 2015-I134). Written informed consent was obtained from all of the participants and their parents or caregivers. This study was registered at cris.nih.go.kr (identifier: KCT0002111).
Customized nutrition care process
A customized NCP was implemented by a nutrition professional. NCP was implemented using the following four steps: 1. nutrition assessment, 2. nutrition diagnosis, 3. nutrition intervention, and 4. monitoring/evaluation [7].
Nutrition assessment/reassessment
Anthropometric data, biochemical data, dietary intake data, and nutritional diagnosis at baseline and 4 months post-baseline were collected. Prior to data collection, a guideline booklet and previously validated questionnaires were developed by the clinical, physical, and nutrition professional team.
Sociodemographic assessment
Demographic data such as school level (elementary, middle, high school), age, parents' education, metabolic syndrome-related medical history and household income were collected.
Anthropometric data
The 2017 Korean Children and Adolescents Growth Standard [22] was used for anthropometric assessment and BMI reference data specific for age and sex of the subject. BMI z-scores were calculated and adjusted for age and sex using the lambda-musigma (LMS) method and Korean national growth charts. Body mass index (BMI) was calculated using the formula weight (kg)/height (m)2. For weight and height measurements, subjects were dressed lightly for indoors and were told to remove their shoes before the measurement. Waist circumference (WC) was measured midway between the lowest rib and the iliac crest with the subject in an upright position. Blood pressure was measured twice with an appropriately sized cuff after the subjects had been seated for 5 min. The mean value was used for analysis. Whole body dual energy x-ray absorptiometry (DXA) scan to determine body composition was performed at baseline and 16 weeks after the intervention.
Dietary intake assessment
Dietary intake was assessed using a 3-day food diary (including one weekend day) specifically designed for the intervention participants. Subjects were asked to record everything that they ate and drank over a 3-day period. All completed records were evaluated for average daily nutrient intake using the Computer Aided Nutritional Analysis Program (CAN Pro, Version 5.0, The Korean Nutrition Society, 2015). The intake of macronutrients, as well as total energy, was compared with Dietary Reference Intakes for Koreans (KDRIs) (The Korean Nutrition Society, 2015) [23].
Nutrition diagnosis
Nutrition diagnosis was performed based on three main domains by writing a Problem, Etiology and Signs/symptoms (PES) statement after communication and collaboration with other providers of the multidisciplinary team. All data (sociodemographics, health- and diet-related behaviors, NQ, anthropometric data, biochemical data, and dietary intake) was obtained and recorded through nutrition assessment by nutrition professional.
Three domains (categories)
The Nutrition Diagnosis Terminology (IDNT) [24] was used to describe the problem. Following the nutrition assessment, the nutritional diagnosis was made based on three domains (categories).
PES statement
A specific nutrition problem or nutrition diagnosis was identified and described using a PES statement: Problem related to Etiology as evidenced by Signs and Symptoms. This was done to document the problem, its root cause, and provide evidence for the nutrition diagnosis.
Nutritional intervention
A 16-week nutritional intervention was designed for each subject by a nutrition professional based on that subject's specific nutrition diagnosis. The constructs of social cognitive theory and TTM of change were applied to the intervention to modify participant obesity-related dietary behaviors.
Intervention
Families accompanied the participants on all visits. Each family received a multicomponent obesity intervention program consisting of clinical, nutritional, and physical activity (PA) sessions. PA sessions were randomly assigned for the 16-weekperiod. At the first visit, written informed consent, self-reported surveys, a 3-day food diary, anthropometric measurements, and blood samples were obtained from all participants. On the second to fourth visits, clinical interview and nutritional counseling were provided to participants and their families.
Four month stepped wedge engagements with 4 themes-targeting a balanced diet, portion-control, healthy cooking and maintain healthy weight- were individually delivered based on the NCP protocol to the families and participants. At each nutritional session, the participant and his/her caregiver set their own goals to change unhealthy eating behaviors through assessment of nutrition intake problems. Individual phone contact and counseling appointments were scheduled by the nutrition team.
Components
Components of the nutritional intervention are described in detail in our study protocol. Each participant problem was identified as an intake (NI) problem, clinical (NC) problem, or behavioral (NB) problem. Obesity-related dietary problems were treated by nutrition education (NE-1.1, NE-2.4), nutrition intervention (ND-1.2), priority modification (E-1.2), and social cognitive theory (C-1.3, C-2.1, C-2.3, C-2.4, C-2.5). Motivation for appropriate nutrient intake, goal-setting, self-monitoring, problem solving, and social support were delivered to the participants. Additionally, nutritional prescriptions, nutritional assessments, project books, practical posters, and 3-day food diaries were provided to the participants. Individual follow-up and phone contact times were scheduled by the nutrition team.
Monitoring
Monitoring was performed to identify outcomes relevant to the individual diet-related goals of the participants. Following the monthly individual counseling sessions and phone contact, dietary intake, eating behavior changes, and anthropometric status of the participants were evaluated by nutrition professional. Based on the evaluated data, customized nutrition counseling and education were performed for 30 minutes by nutrition professional.
Evaluation and nutritional adherence
All participants had their stage of change (SOC) evaluated according to their TTM compliance with the intervention program (completed all nutrition and counseling sessions), if they attained diet-related individual goals, achieved a practical mission, and provided nutritional assessment sheet data. Nutritional reassessment was performed for comparison with baseline nutritional status and metabolic profile. The same procedures and equipment were used at baseline and follow-up.
Nutritional adherence was assessed by a nutrition professional using four nutritional diagnosis categories: NI, NB, NC, and TTM based on attending the nutrition and counseling sessions with their parents.
A. NI: Compliance with individual DRIs [23] based on the participant's BMI-z score
B. NB: Compliance to attain individual obesity-related dietary behavior goals
C. NC: Compliance with anthropometric changes
D. TTM: Compliance with hand-out practical posters from nutrition sessions and 3-day food diaries
E. 100% attendance at nutrition, counseling, and phone sessions.
Statistical analysis
Statistical analyses were performed using the Statistical Package for the Social Sciences (SPSS) version 23(SPSS Inc., Chicago, IL, USA). χ2 tests were performed to compare sociodemographic variables with discontinuous frequencies between participants. To evaluate the significance of group differences in study populations, the Student's t-test and paired t-test were used. Mixed effects linear regression models for repeated measures were used to analyze between-group differences in anthropometrics, data and dietary intake and over time. The intercept was used for mixed model random effects at the individual level. A general linear regression model was used to assess the significance of changes in macronutrient intake and anthropometric variables between groups and the effects of NI, NB, and SOC on TTM interactions. A multiple linear regression model was conducted to test the effects of NI, NB, and SOC as mediators of the effects of the intervention on changes in body composition and macronutrient intake. Analyses were adjusted for age, gender, PA, and mother's and father's education years. A P < 0.05 was considered statistically significant (two-tailed test).
RESULTS
Following recruitment, a total of 103 children and adolescents [mean age: 12.4 years, boys = 63 (61.2%)] were assessed for eligibility according to the previously described inclusion criteria. Of these 103 children, 69 (67%) were moderate obese (95th percentile ≤ BMI < 120% of the 95th percentile) and 34 (33%) were severe obese (120% of the 95th percentile ≤ BMI) (data not shown). There were no significant differences in sociodemographic characteristics (school and age of the participants, metabolic syndrome-related medical history of the parents, and house income) except for parents' education years between adherent and non-adherent groups (Table 1).
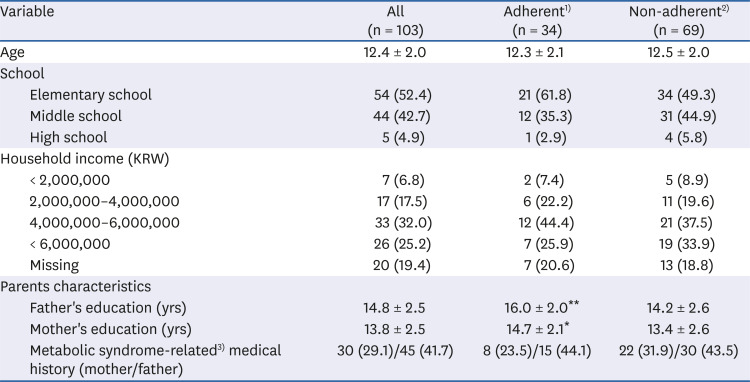
Table 1
Sociodemographic characteristics of the participating moderate to severe obese children and adolescents at baseline
Values are number (%) or mean ± SDs.
Significantly different between the groups by Student's t-test at *P < 0.05 and **P < 0.01.
1)Adherent: participants with good adherence to the intervention program including attendance of clinical and nutrition sessions.
2)Non-adherent: participants with poor adherence to the intervention program including clinical and nutrition sessions.
3)Metabolic syndrome-related: hypertension, diabetes, cardiac, stroke, dyslipidemia.
![]()
Changes in anthropometric data
Anthropometric data for the participants are described in Table 2. After a 16-week intervention, the adherent group had a lower weight (−0.2 kg vs. 3.3 kg, P = 0.000), BMI (−0.7 kg/m2 vs. 0.0 kg/m2, P = 0.000), BMI-z score (−0.3 vs. 0.1, P = 0.000), WC (−2.4 vs. 1.6, P = 0.008), fat mass (−1.4 vs. 1.4, P = 0.000), and percentage body fat (−1.5 vs. 0.5, P = 0.001) than the non-adherent after adjusting for age, sex, and PA. Statistically significant (P < 0.05) reductions in all anthropometric variables except weight and waist-to-hip ratio (WHR) were observed in the adherent group compared to baseline measurements over the 16-week intervention period.
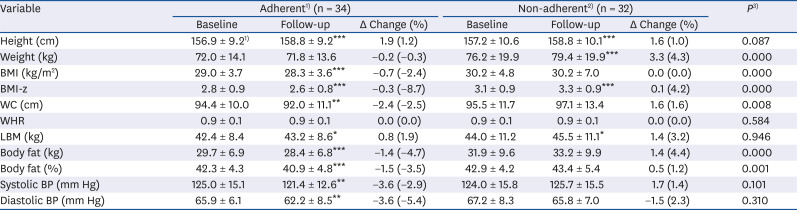
Table 2
Changes in anthropometrics measurements of the participating moderate to severe obese children and adolescents
Values are means ± SDs.
Significantly different between groups by paired t-test at *P < 0.05, **P < 0.01, ***P < 0.001.
1)Adherent: participants with good adherence to the intervention program including attending clinical and nutrition sessions.
2)Non-adherent: participants with poor adherence to the intervention program including attending clinical and nutrition sessions.
BMI, body mass index; WC, waist circumference; WHR, waist-to-hip ratio; LBM, lean body mass; BP, blood pressure.
3)Group × time interaction effects adjusted for age, sex, mother's and father's education years, and physical activity group in the mixed effects linear regression models (random intercept: individual).
![]()
Changes in macronutrients intake of the participants
Nutrient intake changes for the participants and a comparison of nutrient intake and KDRIs between the two groups are shown in Table 3. Sixty-six of the 70 children and adolescents reported their energy intake at baseline and follow-up. At the end of the intervention, lower daily energy intake (27.1%, P < 0.001 in the adherent group, 18.4%, P < 0.01 in the non-adherent group) was reported in both groups. In the adherent group, there was a caloric reduction of 20.4% for boys (−533.2 kcal/d, P < 0.01) and 24.5% for girls (−621.9 kcal/d, P < 0.01), while in the non-adherent group, there was a caloric reduction of 5.6% in boys (−129.8 kcal/d, P < 0.01) and 25.5% in girls (−591.1 kcal/d, P < 0.01). No significant change was found in macronutrient intake ratios in either group, but there was a significant reduction in carbohydrate (17.1%; −54.3 g/d, P < 0.001), protein (14.3%; −13.5 g/d, P < 0.01) and fat (21.2%; −18.1 g/d, P < 0.001) intake in the adherent group relative to baseline. However, differences between groups were not statistically significant after adjusting for age, sex, and PA using mixed effects regression analysis.
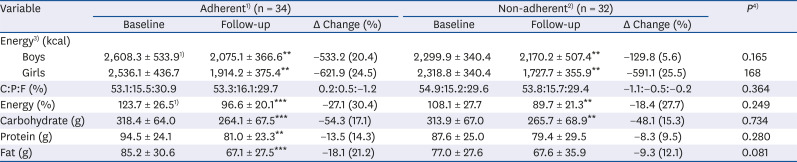
Table 3
Changes in nutrition intake (macronutrient) of the participating moderate to severe obese children and adolescents
Values are means ± SDs.
C:P:F (Carbohydrate: Protein: Fat, Macronutrient intake ratios).
Significantly different between groups by paired t-test at *P < 0.05, **P < 0.01, ***P < 0.001.
1)Adherent: participants with good adherence to the intervention program including attending clinical and nutrition sessions.
2)Non-adherent: participants with poor adherence to the intervention program including attending clinical and nutrition sessions.
3)Korean Dietary Recommended Intake for children aged 9-11 years: energy intake boys, 2,100 kcal; girls, 1,800 kcal. Protein recommended intake for boys and girls: 40 g/day. KDRI intake for children aged 12–14 years: energy intake boys, 2,500 kcal; girls, 2,000 kcal. Protein recommended intake: 55 g/day for boys and 50 g/day for girls) (Korean Nutrition Society, KDRI, 2015).
4)Group × time interaction effects adjusted for age, sex, mother's and father's education years, and physical activity group in the mixed effects linear regression models (random intercept: individual).
![]()
Changes in NI and NB problems of the participants
Changes in NI were assessed during the nutrition diagnosis step by employing IDNT (Fig. 1). At baseline, most participants (88.2% of adherent and 66.7% of non-adherent participants) were diagnosed with excessive energy intake (NI-2.2). In detail, 97% of adherent and 87% of non-adherent group participants were diagnosed with excessive fat intake (NI-5.6.2), and 67% of the adherent group and 52% of the non-adherent group were diagnosed with excessive carbohydrate intake (NI-5.8.2). There were no significant differences between groups after the intervention.
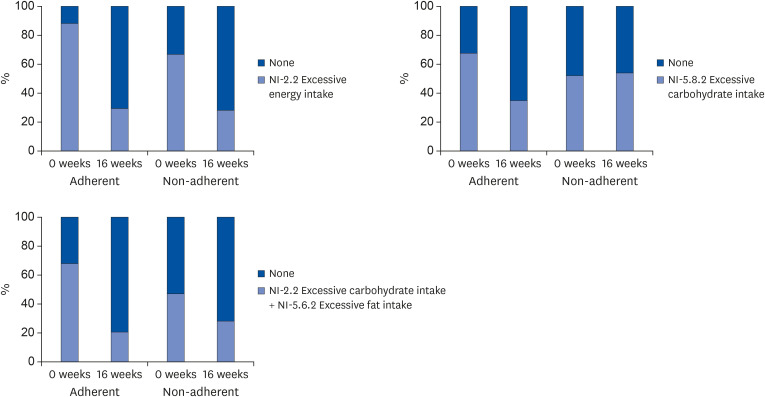
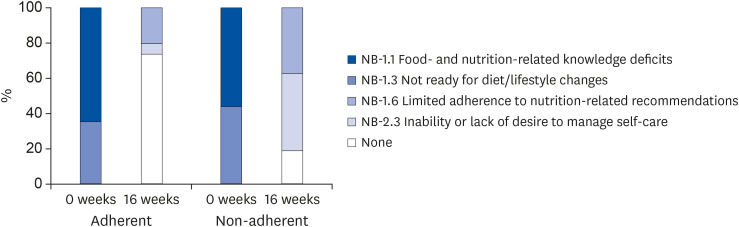
The following NB problems were identified: food and nutrition-related knowledge deficits (NB-1.1) (64.7% of adherent and 56.3% of non-adherent participants) and not ready for diet/lifestyle changes (NB-1.3) (35.3% of adherent and 43.7% of non-adherent group participants) at baseline. After the intervention, 73% of adherent and 18% of non-adherent group participants had no NB problems. There were no significant differences between groups after the intervention (Fig. 2).
SOC of the participants according to the TTM
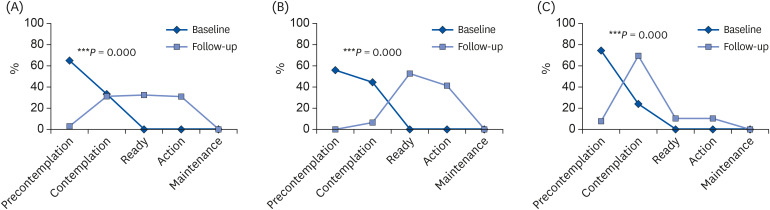
At baseline, 65% of the participants were at the pre-contemplation (PC) and 34% at the contemplation (C) (Fig. 3). There was a significant difference in the SOC in TTM of the participants (P = 0.000) after 16 weeks of intervention. At 16 weeks, 31% of participants were in the C, 32% were in the ready (R), and the rest of the participants were in the action (A). After the intervention, 52% of the ready and 41% of the action participants moved from the PC and C stages in the adherent group (P = 0.000). In contrast, only 22% of the low (pre-contemplation and contemplation) SOC participants in the non-adherent group moved to the high (ready and action) SOC group (Fig. 3).
Changes in macronutrient and body composition between groups according to NI, NB diagnosis and SOC in TTM
Macronutrient intake and body composition was diagnosed as being due to NI (NI-2.2 excessive energy intake) or NB (NB-1.6 limited adherence to nutrition-related recommendations or NB-2.3 inability or lack of desire to manage self-care) (Supplementary Table 1–2). Consumption of energy, carbohydrates, and fat [energy (%) (−26.5 ± 29.9 vs. −18.4 ± 27.7, P < 0.01), carbohydrate (g) (−57.4 ± 88.2 vs. −48.1 ± 83.3, P < 0.01) and fat (g) (−28.3 ± 40.6 vs. −9.3 ± 42.0, P < 0.05)] was significantly lower in the adherent group than the non-adherent group, respectively.
With regard to body composition variables, BMI (kg/m2) (−0.8 ± 0.9 vs. 0.8 ± 0.6, P < 0.01), BMI-z (−0.3 ± 0.2 vs. 0.1 ± 0.1, P < 0.01), fat (kg) (−1.3 ± 2.1 vs. 1.4 ± 1.5, P < 0.01), and fat (%) (−1.5 ± 1.9 vs. 0.5 ± 2.9, P < 0.01) were lower in the adherent group than the non-adherent group. The exception was LBM (0.8 ± 2.0 vs. 1.4 ± 3.1) (Supplementary Table 1–2).
Participants in both groups were categorized as being at low or high SOC according to the TTM (Table 4). Changes in macronutrient intake and body composition between the groups changed in a similar way between the low and high groups as was observed for the non-adherent and adherent groups. The adherent high SOC group had significantly lower energy (kcal) (−563.7 ± 656.8, P = 0.049), energy (%) (−26.5 ± 30.0, P = 0.021), and fat (g) (−28.3 ± 40.6, P = 0.018) consumption than the non-adherent low change group within the adherent group. Furthermore, the adherent group had lower BMI (kg/m2) (−0.8 ± 0.9, P = 0.017), BMI-z (−0.3 ± 0.2, P = 0.000), fat (kg) (−1.3 ± 2.1, P = 0.033) and fat (%) (−1.5 ± 1.9, P = 0.034) than the non-adherent group within the adherent group.
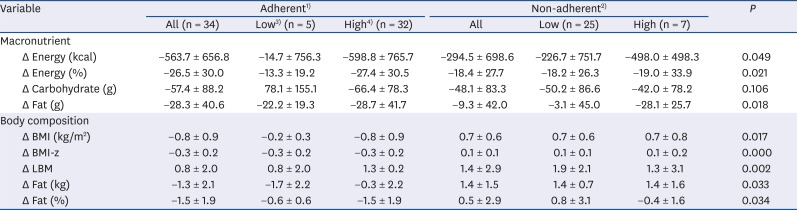
Table 4
Group differences of changes in macronutrient and body composition according to stage of change in TTM
TTM, transtheoretical model; BMI, body mass index; LBM, lean body mass.
Significantly different between groups using group × stage of change interaction effects in the general linear regression model after adjusting for age, sex, mother's and father's education years, and physical activity group covariate at *P < 0.05.
1)Adherent: participants with good adherence in the intervention program including attending clinical and nutrition sessions.
2)Non-adherent: participants with poor adherence to the intervention program including attending clinical and nutrition sessions.
3)Low: in pre-contemplation to contemplation stages of change in the TTM.
4)High: in ready to action stages of change in the TTM.
![]()
NI was associated with lower in macronutrient intake. SOC were associated with lower in body composition except LBM of the participating children and adolescents (Supplementary Table 3).
DISCUSSION
Our 16-week evidence-based customized nutritional intervention improved body composition (weight, BMI status, growing height and age-gender specific BMI-z scores, waist circumference, body fat, and percentage body fat) and decreased calorie intake in adherent moderate to severe obese children and adolescents. Furthermore, SOC according to the TTM improved in the adherent group after the intervention. Excessive energy and carbohydrate and fat intake decreased in both groups after the intervention. Total energy intake, carbohydrate consumption, and fat consumption decreased 9%, 2% and 9% more in the adherent group than the non-adherent group. Two thirds (73.5%) more participants in the adherent group than the non-adherent group had reduced NB problems. All participants in the adherent group had a higher SOC while only 22% of non-adherent group participants had a higher SOC. Furthermore, BMI (kg/m2), BMI-z score, body fat, and body fat % decreased 0.7, 0.4 units, 2.7 kg, and 2% more in the adherent group than the non-adherent group, respectively. All assessments followed strict international criteria, the Korean national reference standard, and an evidence-based study protocol previously developed before implementation of this program by our nutrition research team.
A previous study reported lower BMI-for-age and gender specific z scores (−0.2 ± 0.2) in obese children in the intervention group than the control group after six months of a stage-based lifestyle modification intervention [14]. Another study reported a lower diastolic BP (DBP) in the intervention group than the control group after 9 months of intervention [16]. Our findings were similar; positive changes were seen for most of the anthropometric variables of adherent children and adolescents. In contrast, BMI-z, body fat, and body fat% actually increased by 0.1 units, 1.4 kg, and 0.5% from baseline in non-adherent children and adolescents. Particularly, the difference in mean change in weight, BMI, BMI - z score, WC, body fat mass, and body fat percentage between the two groups was statistically significant. This indicates that greater participant adherence to the intervention resulted in significant improvements in their body composition after the intervention.
There was a significant reduction in macronutrient intake (17.1% lower carbohydrate intake, 21.2% lower fat intake) in the adherent group compared to baseline. However, there were no significant group differences. This indicates that both groups controlled their diet following the individual nutrition sessions and counseling (portion control based on DRIs [23]). It has been suggested that practical, achievable, and sustainable diet methods should be easy to adhere to [25]. For our 16-week nutrition intervention, we used information about the subjects' lives to design interventions to improve their nutritional status. In the first and second sessions, balanced diet and portion control were explained to the participants. In the third and fourth sessions, choosing and cooking healthy snacks in a real-life setting were explained. Over the 16-week intervention period, subjects and their families considered modifiable dietary factors together and subjects developed individually centered goals with the aid of monthly nutritional assessment sheets, educational books, monthly posters, and a theme-based food diary. Furthermore, monthly phone contact, text messages, and online study-specific recipes were provided to support the families of the moderate to severe obese children and adolescents enrolled in this study.
In the present study, all participants were managed using a customized NCP model. After nutritional assessment, nutrition-related problems of all participants were diagnosed as NI or NB problems at baseline and at the 16-week follow-up. A high proportion of moderate to severe children and adolescents in both groups had excessive energy intake including macronutrients (carbohydrate, fat) at baseline. After the 16-week intervention, fat intake was still high in both groups, while energy and carbohydrate intake were lower in both groups. This observation reflects the difficulties our participants apparently experienced in implementing healthy and balanced food choices in real life. Consistent with our findings, previous studies reported a reduction in energy intake and an improvement in macronutrient distribution, although fat [26] or protein EARs [27] remained excessive.
All participants in both groups were diagnosed with food- and nutrition-related knowledge deficits or as not being ready for diet/lifestyle changes at baseline. After the intervention, 74% of participants in the adherent group had no NB diagnosis while 71% of participants in the non-adherent group had an NB diagnosis (limited adherence to nutrition-related recommendations or inability or lack of desire to manage self-care).
Regarding the SOC according to the TTM, all participants were at the PC or Cstages before the intervention. There was a significant increase in participants who entered a high SOC (ready or action) in the adherent group after the intervention compared to only 22% of participants in the non-adherent group who moved to a higher SOC. We interpreted these results to mean that children and adolescents in the adherent group attempted to reduce their excessive caloric consumption and unhealthy food and diet-related problems by adhering to their individual nutrition-related problems. Furthermore, a high attendance rate, monthly theme-based mission completion, and achievement of individual goals for their diet based on their nutritional assessment were observed in the adherent group after the 16-week intervention.
NI was associated with a reduction in energy (kcal), percentage energy, and fat intake in participating children and adolescents. NB and SOC had an effect on weight loss, BMI, age and gender specific BMI-z scores, fat (kg), and percentage body fat in moderate to severe obese children and adolescents. In summary, fewer NB problems improved weight status and body composition directly, while lowered NI only impacted caloric restriction of macronutrients in our study cohort. However, the stage-based behavioral changes and caloric restriction observed in moderate to severe children and adolescents show that change in weight status and diet-related behaviors are possible.
This study had several limitations. First, we had no intervention control group. However, some participants missed the nutrition intervention sessions or these were replaced with phone contact in non-adherent children and adolescents and their families during the intervention. Therefore, the results of the present study were analyzed based on differences in participant adherence. Second, PA sessions were randomly assigned because of regional and individual time differences. However, there were no statistically significant differences at baseline between physically active and non-physically active participants. Last, the intervention period was only 16 weeks based on school times and the drop-out rate of the participants; this may not be long enough to evaluate intensity guidelines (i.e. >25 hours delivered over at least six months) [2829].
Despite these limitations, this study highlights the positive effects that an evidence-based approach for customized nutrition care executed by a multidisciplinary team can have. This is the first multifaceted intervention study to apply an evidence-based customized nutrition care approach to moderate to severe obese children and adolescents in South Korea to improve their nutritional and weight status. In-depth NI and NB assessments helped identify problems that the individual participants faced [11]. We developed a theoretical and evidence-based framework, procedures, and unique resources for the present nutritional intervention. Real-world implementation of our approach can help improve the lives of moderate to severe obese children and their families.
In conclusion, the customized nutritional intervention program described in this study improved body composition, macronutrient intake, and nutritional behavioral in adherent moderate to severe obese children and adolescents. Our results highlight the utility of an evidence-based approach to designing multifaceted intervention strategies for people-centered nutrition care and weight management. Further understanding of why it is difficult to maintain a healthy diet is necessary to improve the life-long health of subjects struggling with childhood obesity.
 XML Download