

 PDF
PDF Citation
 Print
Print


INTRODUCTION
The proportion of the older adult population worldwide has increased consistently owing to the increased life expectancy, development of medical technology, and decrease in birthrates. In the United Nations' 2017 World Population Prospects Report [1], the proportion of older adults aged 60 years or older is expected to increase rapidly to about 15% of the entire population. Moreover, most countries, except those in Africa, can expect this cohort to account for more than 25% of their respective total population by 2050 [1]. According to Korea's National Statistical Office, the country became an aged society in 2017; a dramatic change in the types of older adult households [2] has occurred, which can be explained by the growth of nuclear families. The proportion of traditional extended households decreased from 24.5% in 1985 to 6.2% in 2015, whereas the ratio of older adults living alone increased from 16.9% to 32.9% at the same time [3]. Korean society is faced with various social problems, such as silver poor, high medical expenses, high prevalence rate of chronic diseases, and high incidence of suicide. Medical expenditures among older adults reached 39.1% of the total medical costs in 2016 [4]. The Korean government has implemented various medical and welfare policies to reduce the medical expenses of older adults and paid nationwide attention to the health problems of this population.
As their aging progresses, older people are more prone to chronic diseases, functional impairments, lack of physical activities, decrease in appetite, and difficulties in maintaining healthy nutritional diets [567]. Physical and mental ability as well as social networks are likely to collapse [8], which might lead to unbalanced eating. Older adults cope with higher risks of nutritional deficiencies compared with younger adults [5]. Moreover, more than half of the older adult population report clinical problems [9], such as diabetes and hypertension, which require dietary intervention for treatment. Therefore, serving customized meals is necessary, but these adults may not be consuming an adequate diet because of such factors as psychological alienation, physical weakness, and economic problems.
Cohabitation with a spouse or children plays a positive role in the physical and mental well-being of the older adult [78910111213]. Older adults living alone have a higher risk of exposure and adverse effects on their prognosis of cardiovascular disease compared with those not living alone [789]. Older adults living alone also have fewer experiences of health-promoting activities, such as health checkups and oral examinations, and a higher smoking risk, compared with those living with their families [10]. Recent research [101415] has reported that demographic and socioeconomic factors affect the food intake of older adults. Changes in household types can also affect the nutritional status of older adults [1617181920]. Old age makes it difficult to be physically active, and to buy food and prepare meals.
This study aimed to provide baseline data for nutrition policy and program development for older adults in Korea by comparing dietary behavior and food and nutrients intake by family type.
Go to : 
SUBJECTS AND METHODS
Study participants and design
This study used the raw data of the 6th Korea National Health and Nutrition Examination Survey (KNHANES VI, 2013–2015) [21]. The KNHANES VI was a sample survey employing a two-stage stratified cluster sampling method. The study participants included older adults aged 65 years and over who had participated in the health survey, health examination, and nutrition survey, but excluding those on the diet therapy. From such criteria, 1,856 older adults (858 men, 998 women) were selected for this study. The participants were categorized into two groups: living alone (LA) and living with a spouse (LS) based on the household survey questions. The study protocol was reviewed and approved by the Institutional Review Board of KNHANES VI (2013-07CON-03-04C, 2013-12EXP-03-5C, 2015-01-02-6C).
Assessment of dietary behavior and dietary intake
Trained interviewers collected food intake data by face-to-face interviews. Dietary behavior questions included the frequency of skipping meals and eating out. A food intake survey was conducted using the 24-hour recall method to examine the type and intake of food consumed one day before the survey date using tools such as 2D images, measuring cups, and thick slice. As the survey date influenced the amount of food intake, it was designed not to be based on a specific day. Food groups were analyzed into 17 categories based on the Standard Food Composition Table, 8th Revision in Korea [22]. The amount of nutrients intake was compared with the Dietary Reference Intakes for Koreans 2015 [23]. In the case of energy, the estimated energy requirements were used, and sodium and potassium were compared with the adequate intake.
Percentage of participants with insufficient nutrients intake
The percentage of the participants with insufficient nutrients intake in this study represented the proportion of people who consumed less than 75% of the estimated energy requirement and below of the average requirements for calcium, vitamin A, and riboflavin. We reported and then compared the percentage of the participants with insufficient nutrients intake with the statistics for the total older adults in KNHANES VI.
Demographic and socioeconomic variables
Demographic and socio-economic variables included sex, age, area of residence, household income level, and education level. The age distribution of the participants ranged from 65 to 74 years and 75 years and over, whereas the area of residence was categorized into urban and rural areas. Household income level was split into three groups according to the average household income of the designated year. Education level was classified as elementary school graduate or less, middle school graduate, high school graduate, and college graduate or more.
Statistical analyses
All of the statistical analyses were conducted using SPSS 24.0. We performed descriptive and analytic statistics using the generalized estimating equations approach through stratified and clustered design and weighting method.
For nominal variables, the χ2 test was conducted, and for continuous variables, complex sample general linear models was undertaken to assess mean differences in food and nutrient intakes. All results of the study are presented as crude, and using two models. In the crude model, no adjustments were made for any variable, whereas sex and age variables were adjusted for in Model 1, and sex, age, energy consumption, household income, and education variables were adjusted for in Model 2.
Go to :
RESULTS
Demographic characteristics and dietary behavior
Among the 1,856 participants, 638 older adults lived alone and 1,218 older adults lived with their spouse, as presented in Table 1. Significant differences were found in the distribution of sex, age, residence, household income, and education variables between the LA and LS groups. The percentage of female was higher in the LA group than in the LS group. The average age of the LA group was significantly higher than that of the LS group. Both education and household income levels in the LA group were lower compared with the LS group. The ratio of skipping breakfast, lunch, and dinner in the LA group was higher compared with the LS group. However, the frequency of eating out in the two groups was not significantly different.
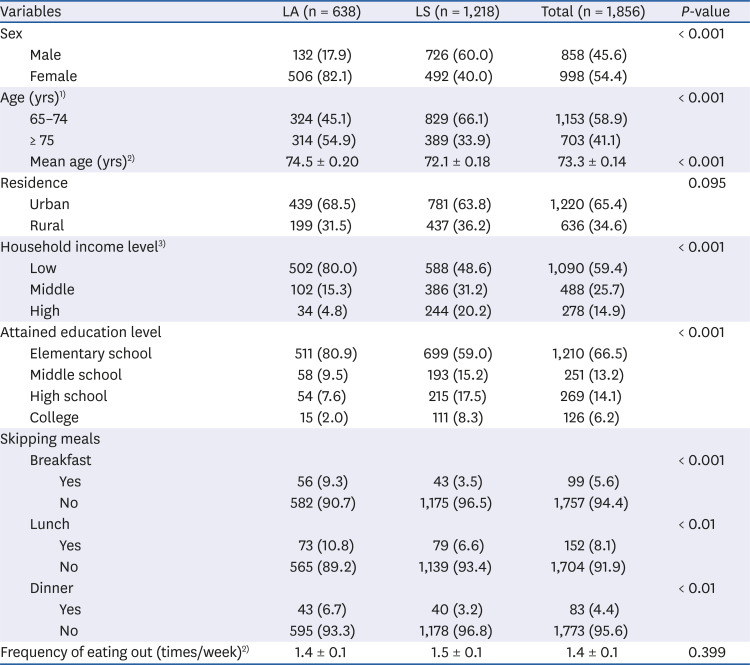
Table 1
Demographic characteristics and dietary behavior of the subjects
Values are number (%) or mean ± SE.
LA, living alone; LS, living with a spouse; SE, standard error.
1)P-Value from complex sample χ2-test.
2)P-Value from complex sample t-test.
3)Household income level; ‘Low’ = 1st quartile, ‘Middle’ = 2nd & 3rd quartile, ‘High’ = 4th quartile.
![]()
Food group intakes
Table 2 presents the differences in food groups intake between the LA and LS groups. Most of the food intake, such as grains, saccharides, nuts, vegetables, fruits, seaweed, seasonings, vegetable oils, meats, eggs, seafood, beverages, and alcohol, showed a significant difference in the two different family types before adjusting for any variables (crude). Both Models 1 and 2 revealed that the LA group ate significantly lower amounts of vegetables and seaweed. In Model 1, the LA group consumed about 36 g less fruit than the LS group. These results showed that the LA group had a relatively lower consumption of vegetables, fruits, and seaweeds compared with the LS group even after adjusting for socio-demographic variables.
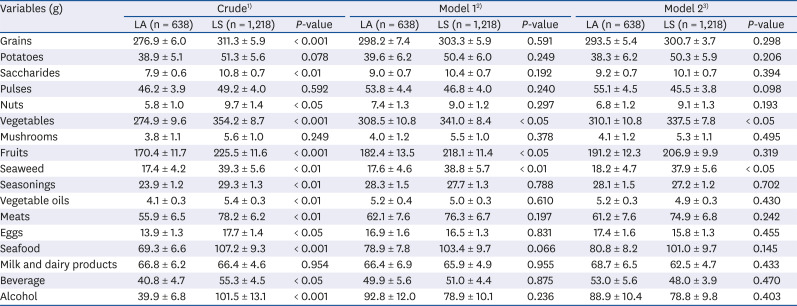
Table 2
Food group intakes of the subjects
Values are the mean ± SE, significant difference determined using CSGLM.
LA, living alone; LS, living with a spouse; CSGLM, complex sample general linear model.
1)Crude: no adjustment.
2)Model 1: adjusted for sex and age.
3)Model 2: adjusted for sex, age, energy intake, household income level, and education level.
![]()
Nutrient intakes and korean dietary reference intakes percentage
Table 3 shows the participants' nutrient intakes and the percentage of nutrient intakes compared with the Korean Dietary Reference Intakes (KDRIs 2015) [23] corresponding to their sex and age; the estimated energy requirement for energy; adequate intake for sodium and potassium; and recommended nutrient intake (RNI) for other nutrients. In both Models 1 and 2, the LA group showed a significantly lower intake of potassium, riboflavin, and vitamin C compared with the LS group. Especially in Model 1, the LA group consumed a significantly smaller amount of iron and niacin compared with the LS group.
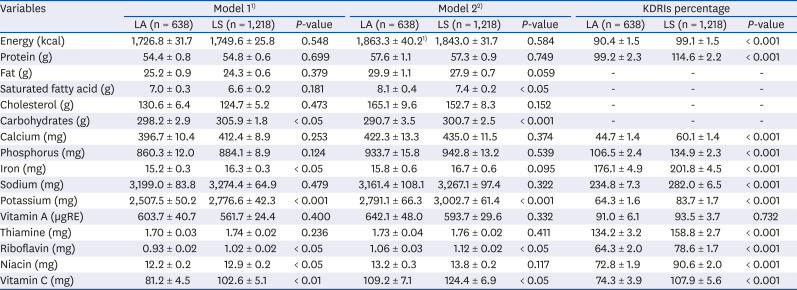
Table 3
Nutrient intakes and KDRI percentage of nutrient intakes of the subjects
Values are the mean ± SE, significant difference determined using CSGLM.
LA, living alone; LS, living with a spouse; KDRIs, Dietary Reference Intakes for Koreans; EER, the specific estimated energy requirement for energy; RNI, recommended nutrient intakes for protein, calcium, phosphorus, iron, vitamin A, thiamine, riboflavin, niacin and vitamin C; AI, adequate intake for sodium and potassium; CSGLM, complex sample general linear model.
1)Model 1: adjusted for sex and age.
2)Model 2: adjusted for sex, age, energy intake, household income level, and education level.
![]()
For the percentage analysis with respect to KDRIs, the LA group showed significantly lower percentages in all of the reported nutrients compared with the LS group. Although not significant, LA's vitamin A intake also tended to be lower. Moreover, the KDRIs percentage of calcium, potassium, riboflavin, niacin, and vitamin C of the LA group was lower than 75%, indicating the severity of their poor intake of essential nutrients.
Especially, the calcium intake level in the LA group was 44.7%, or lower than half of the RNIs. For sodium, intake levels in LA and LS were 234.8% and 282.0%, respectively, which were twice as high as the RNIs. Indeed, LA older adults consumed less than the RNIs of all of the essential nutrients excluding phosphorus, iron and riboflavin, indicating an unbalanced dietary intake compared with LS older adults. Thus, we found significant differences in the nutrient intakes level between the two family types, particularly LA indicated low dietary quality.
Percentage of insufficient nutrient intakes
Fig. 1 shows the percentage of participants in the two groups who consumed less than 75% of the estimated energy requirement and below the average needs for calcium, iron, vitamin A, and riboflavin. Percentages of participants with insufficient nutrient intakes were 10.0% in the LA group and 4.5% in the LS group.
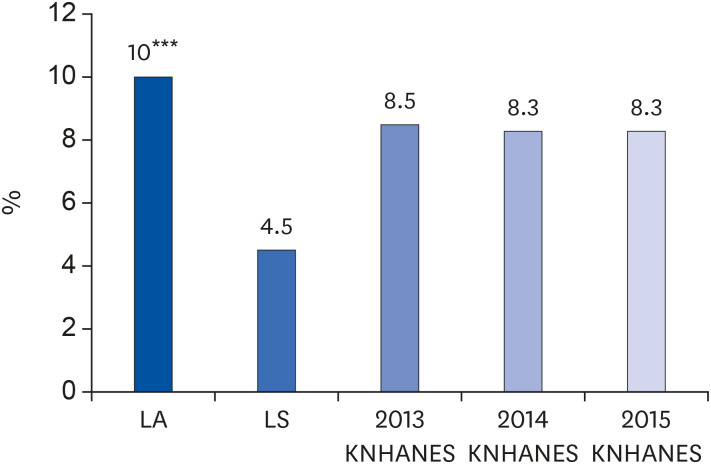 | Fig. 1Percentage of insufficient nutrient intakes of the subjects of aged 65 and over. Percentage of insufficient nutrient intakes: The percentage of people who consume less than 75% of the estimated energy requirement and consume below of the average requirement for calcium, iron, vitamin A, and riboflavin.LA, living alone; LS, living with a spouse; 6th KNHANES (2013–2015), Korea National Health and Nutrition Examination Survey (2013–2015).
Values are the percentage, significant difference determined using complex sample χ2-test, ***P < 0.001.
|
Go to :
DISCUSSION
As people age, they cope with both physical and mental debilitation; meanwhile, their social networks are likely to shrink. Researchers [724] have claimed that older women who live alone after experiencing the death of their spouse feel depressed, in turn affecting meal frequency and variety. Living with a spouse or children is known to play a decisive role in physical and mental well-being.
Many studies [56791213] have reported that older adults living with family members, including spouses, benefit from positive effects on healthy eating, whereas older adults living alone show negative effects on their health, such as social isolation, drinking problems, and poor eating habits. In particular, health inequalities may be the most severe problems for older adults; age, severe socioeconomic deprivation, and family characteristics can affect the nutritional status of older adults.
The present results also showed significant differences in the dietary behavior and food and nutrients intake among Korean older adults when analyzed according to their family type, namely, living alone or with spouse. We found notable discrepancies between the two groups without and with adjustments for affecting factors on their diet, such as sex, age, energy intake, household income level, and education level.
Older adults living alone were more likely to skip meals and eat meals less regularly compared with those living with a spouse, which could result in a negative association with their food and nutrients intake. These findings are similar to other study results [2526]. Tani et al. [25] revealed that men who exclusively ate alone are 3.74 times at higher risk of skipping meals compared with men who ate with others, and the combined effect of living alone is related to a higher ratio of unhealthy eating habits, obesity, and underweight. Moreover, men who live alone and eat alone are more likely to have an association with malnutrition compared with people living with others [25]. Wham [26] insisted that living with a spouse can have a positive effect on health behavior. In contrast, Feldblum et al. [27] claimed that family-type variables, such as marital life and deprivation, are not related to food intake and nutritional status.
Our study showed that food consumption of meat, eggs, seafood, grains, nuts, vegetables, fruits, seaweed, and even beverages and alcohol in the LA group was less compared with the LS group without adjusting for affecting factors, revealing the inferior diet of older adults living alone. After adjusting for age and sex variables in Model 1, the consumption differences in vegetables, fruits, and seaweed remained. After adjusting for age, sex, energy intake, household income, and education level in Model 2, we found a consumption difference in vegetables and seaweed. In particular, the vegetable consumption in the LA group was about 80 g less than that of the LS group. The difference in consumption of vegetables and seaweed is due to the complex cooking procedure and relative short preservation duration of these foods, which need a longer cooking duration and more effort for older adults. Alcohol consumption of the LA group was higher than that of the LS group after adjusting for sex and age, but not to a statistically significant degree.
These characteristics of inferior diet among the LA group are clearly outlined in Table 3. Nutrients intake of carbohydrates, iron, potassium, riboflavin, niacin, and vitamin C in the LA group were lower after adjusting for age and sex variables, and similar results of low intake of carbohydrates, potassium, riboflavin, and vitamin C but higher intake of saturated fat were found in the LA group after adjusting for five socio-demographic variables.
All of the KDRI percentages, except vitamin A, were lower in the LA group. Notably, the intake percentage of calcium, potassium, riboflavin, niacin, and vitamin C in the LA group, compared with KDRIs, were 44.7%, 64.3%, 64.3%, 72.8%, and 74.3%, respectively. The calcium intake levels was 60.1% even in the LS group. Therefore, regardless of the family type, the optimum intake level of calcium in Korean older adults is necessary to reduce the risk of bone disease. The deficient intake of vitamins and minerals seems to be related to lower amounts of consumption of vegetables and fruits in the LA group, which may be attributed to a relatively monotonous and carbohydrate-based diet pattern.
The Insufficient Nutrients Intake Index of energy, calcium, iron, vitamin A, and riboflavin in the LA and LS groups were 10% and 4.5%, respectively, showing a difference of two times between the two groups. The percentage of the LA group with insufficient nutrients intake (10%) was even higher than that in the results of the 2013, 2014, and 2015 KNHANES statistics for all older adults of the designated survey years.
For these reasons, we inferred that older adults living alone consumed a simple meal of rice and pickled vegetables of kimchi to avoid the hassle and difficulty of preparing meals using various kinds of food. Other [16171819] researchers have also found that older adults living alone consume lower amount of fruits and fiber compared with those with spouses and have poor-quality diets. Family type has been recognized as one of the decisive indicators leading to high risks for poor health.
Overall, the diet of the older adults living alone in our study was inadequate both in quantity and quality, and we confirmed that these differences between the two groups resulted from their family type. If financial support or meal services and nutrition education are provided, this differences could be narrowed, demonstrating the serious need for comprehensive nutrition programs targeting older adults living alone.
The dietary intake and health of older people might be influenced not only by the family type but also by social and environmental factors. Holcomb et al. [28] reported that nutrition education, taking into account age, area of residence, and education level, has a positive effect on food and nutrient intake among older adults living alone. However, the ratios of Korean older adults who have experienced nutrition education from 2013 to 2015 are 5.1%, 4.5%, and 5.9%, respectively, by the 6th KNHANES [21]. In Japan, the figure is only 6% of older adults [25]. Considering these data, the participation rate in nutrition education programs among older adults is low at home and abroad [25].
Thomas et al. [29] reported that older men living alone have no problems maintaining their dietary balance and health through dinner club gatherings. Lim et al. [30] also reported that in Korea, the nutrition program of providing daily meals for rural older adults living alone has shown positive effects on the balanced diet, healthy eating, and social networking among the cohort.
We suggest that a customized nutrition intervention program composed of nutrition education and nutrition support be developed as a promising way to improve the diet of older adults, especially those living alone. Efforts in promoting social interests and delivering nutrition programs to unserved or underserved older adults should be prioritized.
This study has certain limitations. First, owing to privacy issues, we could not analyze the data according to various family types, such as living with their married child or grandchildren. Second, because the majority of older adults had chronic diseases, those with chronic diseases were not excluded from the study sample; only those practicing diet therapy were excluded. Finally, food intake data for one day would be limited in representing usual diet. Despite these limitations, our study results are meaningful and representative for Korean older adults because of the use of KNHANES VI data, a large-scale survey conducted nationwide with a statistically optimal sample size.
The results showed the frequent skipping of meals and insufficient food and nutrients intake of older adults living alone compared with those of living with a spouse. In particular, there existed education and income disparities between these two groups. Our previous research [30] confirmed the effectiveness of a program providing daily lunch using village center facilities in rural areas. Such a nutrition program requires various physical facilities and contents. Social awareness and institutional support, together with the development of a nutrition program for underserved older adults, are urgently needed.
Go to :
 XML Download