

 PDF
PDF Citation
 Print
Print


INTRODUCTION
It is well established that adequate nutrition is essential for growth and development. Infants and young children grow at their fastest rate and neurocognitive development is mainly acquired during the first 2–3 years of life. Inadequate nutrition during this period affects mental and physical growth.
Faltering growth is generally used to describe a growth slower than expected weight gain in infants and young children, based on their age and sex [12]. It can cause diminished capacity to maintain normal body functions (https://icdlist.com/icd-10/R62.51). The diagnostic criteria of faltering growth differ between studies. Multiple anthropometric criteria with weight and/or height indexes such as < 3rd, < 5th, < 10th, or < −2 z-scores have been used including the Korean National Growth Chart and the World Health Organization (WHO) growth Standards [2345], and specific criteria in connection with growth velocity lines have also been used [23]. The preexisting criteria of faltering growth were proposed as one of the followings: 1) body mass index-for-age < 5th centile, 2) weight-for-age < 5th centile, 3) length-for-age < 5th centile, 4) < 75% of median weight-for-age, 5) < 80% of median weight-for-length, 6) weight deceleration crossing more than 2 major centile, and 7) slow conditional weight gain (lowest 5%) [6].
Most children with faltering growth do not have organic disease. In these children, growth often begins to slow down in infancy and their growth rate declines markedly until about 18 to 19 months; these children are then diagnosed with nonorganic faltering growth [7]. Thus, early intervention is important to promote catch-up growth in these young children.
The calorie intake of infants and toddlers with faltering growth is insufficient to maintain growth [18]. This low energy intake is sometimes accompanied by picky eating, poor food quality, low dietary variety, and inappropriate eating behaviors of caregivers [291011]. Children may be distractible while eating, and would rather play than eat [12]. As such, catch-up growth can be achieved with behavioral modifications and increased caloric intake [8]. Behavioral modification includes differential reinforcement of appropriate eating behaviors and ignoring inappropriate response [1314]. We have been basically providing educational programs of feeding practice and appropriate information about food to caregivers in clinics as a part of routine practice for children with faltering growth.
Increasing caloric density can be helpful in some children because of the reluctance to increasing feeding volumes. Beyond an energy-dense infant formula for growth-faltered infants, a pediatric nutritional formula might have favorable effects on catch-up growth in young children with faltering growth. According to previous studies, the improvement of nutritional intake by supplementing the diet with a concentrated and balanced pediatric nutritional supplement formula had some positive effects on catch-up growth in prepubertal children with faltering growth [1516]. However, these studies used a less strict definition for faltering growth of both body weight and height below the 10th centile and age was restricted to 3 years or older [1516]. Because of the importance of early intervention in growth-faltered children for better outcome, well-designed prospective studies of nutritional interventions in children younger than 3 years of age are needed.
Therefore, the aim of this prospective multicenter study was to evaluate the effectiveness of nutritional supplementation with a pediatric nutritional formula for promoting growth and improving nutritional status in young children aged 1 to 3 years with nonorganic faltering growth.
Go to : 
SUBJECTS AND METHODS
Subjects
Children aged 12–36 months with nonorganic faltering growth who visited a pediatric gastroenterology outpatient clinic in one of 5 tertiary university hospitals in 4 cities of South Korea were eligible to participate in this prospective multicenter study.
Nonorganic faltering growth was defined as a slow growth not caused by an underlying diagnosable medical condition. The inclusion criteria were one of the following: 1) body weight-for-age below the 5th percentile on the 2017 Korean National Growth Charts (https://knhanes.cdc.go.kr/knhanes/sub08/sub08_02.do), 2) body weight-for-age decreased by more than 2 major percentile curves on the Korean National Growth Chart when previous medical record of his or her body weight existed, or 3) a weight-for-height z-score below −2.
All participants were asked whether they were consuming formula and what the product name was. Children who previously used a pediatric nutritional supplement formula were excluded from the study. Children who took other nutritional supplements or medications, such as vitamins, minerals and trace elements, formula, or appetite stimulators were also excluded. Children who were born premature or who had organic diseases, such as congenital heart diseases, genetic diseases, endocrinologic disorders, neurologic diseases, swallowing difficulties, malignancies, or infectious diseases, were excluded from the study.
A total 89 children initially entered the study. Of those, 82 children completed the 6-month intervention during the study period and were then enrolled in the study. Participant withdrawal occurred mainly at the second visit due to other family members choosing to withdraw.
Study design and protocol
Children were instructed to consume 2 sachets of the formula, Pediapowder® (MDwell, Seoul, Korea), mixed with 400 mL of water per day, in addition to consuming their regular diet, for 6 months. The nutritional supplement formula contained protein, fat, carbohydrates, vitamins, and minerals, as described in Table 1. Parents chose a vanilla or chocolate flavored formula.
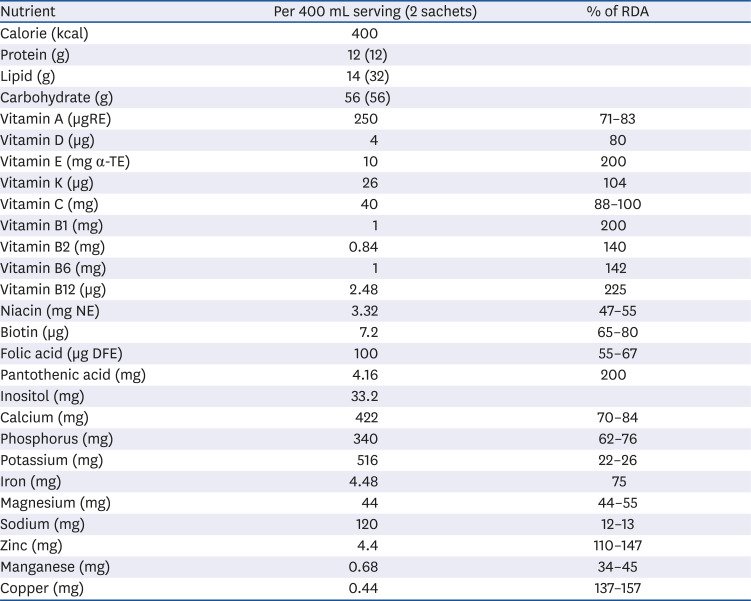
Table 1
Composition of a pediatric nutritional supplement formula (Pediapowder®) per daily serving
Values are expressed as number (% of total kcal).
α-TE, alpha-tocopherol equivalents; DFE, dietary folate equivalents; NE, niacin equivalents; RDA, recommended dietary allowance; RE, retinol equivalents.
![]()
Pediatricians and dietitians gave the parents formal education on nutritional intake and feeding behavior every 2 months. Parents recorded their child's daily dietary intake, including the amount of formula that the child consumed. The number of remaining sachets of formula were counted at each study visit. Data on demographics, previous medical history, and feeding behaviors were collected. Any adverse reactions on the formula were recorded at each visit.
Anthropometric parameters, including weight, height (in children 2 years and older) or length (in children younger than 2 years), head circumference, and mid-arm circumference, were measured at baseline and again at 2, 4, and 6 months after the intervention began. Weight-for-age and height-for-age z-scores were calculated using the power in the Box-Cox transformation (L), median (M), and generalized coefficient of variation (S) parameters for age and sex provided by the Korean Center for Disease Control and Prevention (https://knhanes.cdc.go.kr/knhanes/sub08/sub08_02.do). Laboratory tests were done at baseline and 6 months.
For analysis, the study subjects were divided into 2 groups: 1) children who consumed ≥ 60% of the recommended dose of the formula were included in the good consumption group, and 2) children who consumed < 60% of the recommended dose of the formula were designated to the poor consumption group. Primary outcomes of the study were individual improvements in anthropometric parameters and changes in z-score before-compared to after the intervention. Secondary outcomes were the trend for growth catch-up at 2-month intervals and improvement in nutritional status including anthropometric parameters.
Data analysis and statistics
Statistical analysis was performed using SPSS version 24.0 (SPSS, Inc, Chicago, IL, USA). Differences in continuous data between the 2 study groups were analyzed using independent t-tests or Mann-Whitney U tests. Categorical data were analyzed using χ2 tests or Fisher's exact tests. Paired t-test was performed to examine differences throughout the study periods. Generalized estimating equation (GEE) analysis was done to examine the trend in changes of anthropometric growth parameters at each 2-month interval throughout the intervention in the 2 study groups.
Ethics
This study was approved by the Institutional Review Boards (IRBs) of all 5 hospitals enrolled (Korea University Guro Hospital, IRB No. 2016GR0028; Severance Hospital, IRB No. 4-2015-1120; Kyungpook National University Hospital, IRB No. 2016-01-004; Gyeongsang National University Hospital, IRB No. GNUHIRB 2015-09-007; and Seoul National University Bundang Hospital, IRB No. B-1510-319-005). Written informed consent was obtained from all parents of the study subjects before subjects were enrolled.
Go to :
RESULTS
Patient characteristics
A total 82 children (50 boys, 32 girls, age 21.6 ± 7.3 months [mean ± SD]) were enrolled after completing the 6-month intervention. Thirty-eight children were included in the good consumption group and 38 children were included in the poor consumption group.
Comparison of anthropometry between the good- and poor consumption groups
Demographic characteristics and anthropometric measurements of children at baseline and after 6-month intervention are listed in Table 2. Baseline anthropometric measurements were not different between the 2 groups.
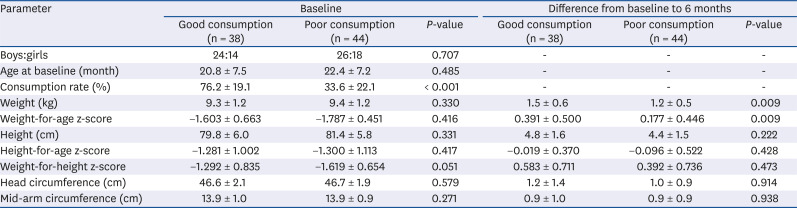
Table 2
Demographic characteristics and anthropometric measurements of children with faltering growth before and after 6 months of supplementation with a nutritional supplement formula, categorized according to good- and poor consumption groups
![]()
After the 6-month intervention, weight, weight-for-age z-score, height, weight-for-height, head circumference, and mid-arm circumference improved in all participants (all P < 0.001). Weight and weight-for-age z-score improved significantly in the good consumption group compared to in the poor consumption group over the 6-month intervention (P = 0.009, respectively). There were no significant differences between the 2 groups in changes of height, height-for-age z-score, weight-for-height, head circumference, and mid-arm circumference. No adverse reactions were reported.
Trend for changes in anthropometry
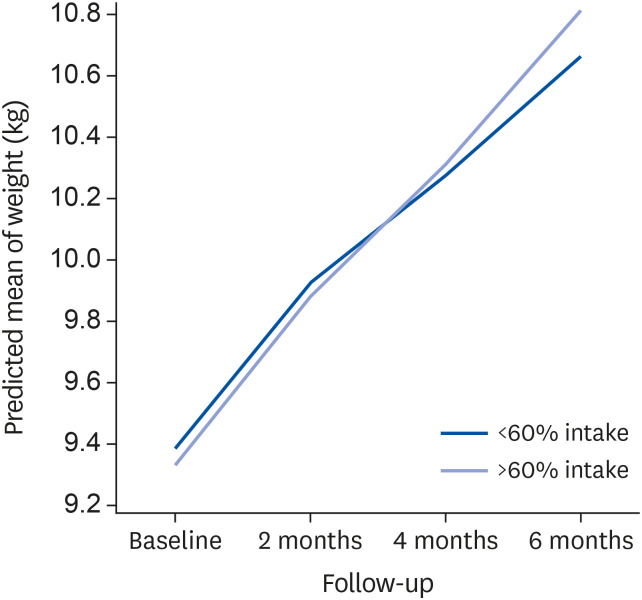
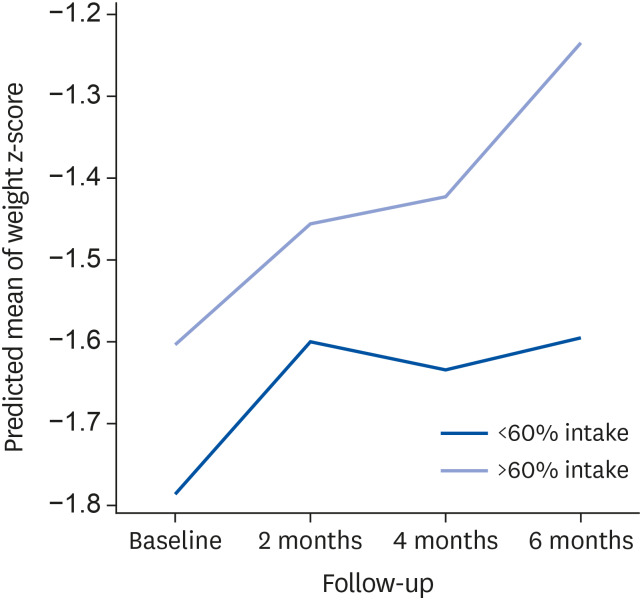
When GEE analysis was performed, the good consumption group showed a significant trend in weight gain (all P < 0.001) and improvement in weight-for-age z-scores after 2, 4, and 6 months of supplementation compared to the poor consumption group (P < 0.001, P = 0.024, and P = 0.004, respectively) (Figs. 1 and 2). Trends in changes in height and height-for-age z-score during the study period were not significant between the 2 groups.
Comparison of laboratory parameters between the good- and poor consumption groups
Baseline laboratory parameters were not different between the 2 groups. At baseline, mean serum concentration of prealbumin was 18.9 ± 4.7 mg/dL (reference values of 20–40 mg/dL) in the good consumption group and 18.7 ± 3.7 mg/dL in the poor consumption group. Except for prealbumin, mean serum levels of initial laboratory parameters were within normal limits in both groups.
The difference in blood urea nitrogen concentration after 6-month intervention was significantly higher in the good consumption group than in the poor consumption group (P = 0.001), and the other laboratory parameters did not differ between the 2 groups (all P > 0.05) (data not shown). Overall, the serum concentration of calcium, iron, and total iron binding capacity (TIBC) increased (P = 0.047, P = 0.006, and P < 0.001, respectively), while that of ferritin decreased significantly (P < 0.001) in all participants after the 6-month intervention. Table 3 presents the differences in the laboratory parameters for each group, from baseline to the end of the study for each group. In the good consumption group, serum levels of uric acid, total bilirubin, and ferritin decreased, while that of TIBC increased significantly (P = 0.012, P = 0.029, P < 0.001, and P < 0.001, respectively). In the poor consumption group, the levels of hemoglobin, albumin, creatinine, iron, and TIBC increased significantly (P = 0.022, P = 0.001, P = 0.040, P = 0.004, and P < 0.001, respectively). The proportion of children with abnormal laboratory parameters by age and sex did not differ between the 2 groups (all P > 0.05, respectively, data not shown).
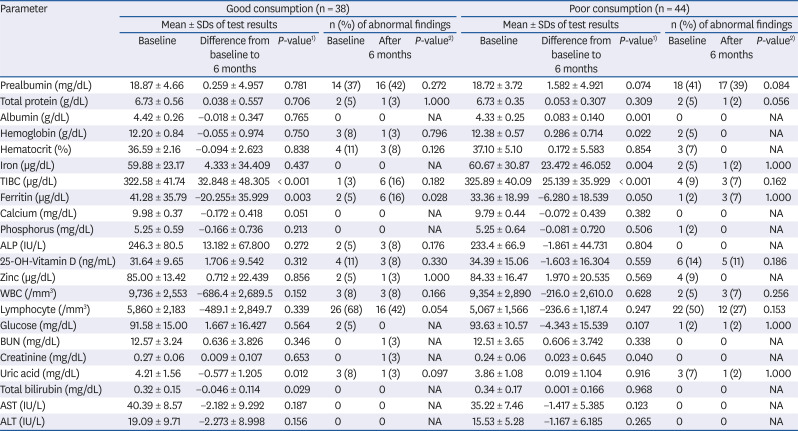
Table 3
Comparison of laboratory parameters in children with faltering growth before and after 6 months of supplementation with a nutritional supplement formula, categorized according to good- and poor consumption groups
NA, not applicable; TIBC, total iron binding capacity; ALP, alkaline phosphatase; WBC, white blood cell; BUN, blood urea nitrogen; AST, aspartate aminotransferase; ALT, alanine aminotransferase; IU, international units.
1)Between baseline and after the 6 months in each group, continuous data, paired t-tests.
2)Between baseline and after the 6 months in each group, categorical data, χ2 tests or Fisher's exact tests.
![]()
Go to :
DISCUSSION
Faltering growth is an important health issue in infancy and early childhood that affects short- and long-term outcomes, including growth and development. The prevalence of faltering growth in children varies according to the region and how it is defined. Prevalence of faltering growth ranges from 1.2% to 22% according to the criteria in a Danish cohort study [6], and the prevalence of stunting also varies between 21% to 46% in low- and middle-income countries [17]. In South Korea, the prevalence of underweight in children younger than 2 years was reported as 0.5% using data from the 2015 National Health Screening Program for Infants and Children, wherein underweight was defined as weight-for-age below the 5th percentile on the Korean National Growth Chart or on the WHO growth standards [4]. In North Korea, a region with the same ethnic background as South Korea, the prevalence of underweight (defined as weight-for-age z-score < −2.0) and stunting (defined as height-for-age z-score < −2.0, following the criteria of WHO standards [5]) in children under 5 years was reported as 15.2% and 27.9%, respectively, according to the survey by the United Nations Children's Fund (UNICEF) World Food Program in 2012 [18].
In the present study, we defined “faltering growth” strictly as body weight-for-age below the 5th percentile on the Korean National Growth Charts, decreased body weight-for-age crossing more than 2 curves, or a weight-for-height z-score below −2. Since the Korean National Growth Chart was recently updated to agree with the WHO Growth Standards in children younger than 36 months [4], we used this new growth chart to diagnose faltering growth and to analyze changes in z-scores of anthropometric parameters for growth.
Numerous studies have demonstrated that faltering growth is rarely due to organic causes [1920], and that most children with faltering growth had nutritional deficiencies and feeding difficulties [2122]. As for the practical management of children with nonorganic faltering growth, some physicians have tried interventions such as increasing calories, avoiding grazing, and structuring meals and snacks, which resulted in significant weight gain [20]. However, to date most studies have been conducted in infants born premature or small for gestational age. Linear growth and head circumference in term infants with weight below the 10th percentile improved after receiving nutrient-enriched formula (that provided 30% more protein) during the first 9 months of life and the effects persist beyond the study period [23]. The criterion to define faltering growth of weight below the 10th centile was less strict than typical. In the UK, infants less than the 3rd centile for weight and height-for-age, and/or with weight gain that was less than 50% of expected received either a nutrient dense formula (providing 4.2 kJ/mL, which was an increase in energy up to 52%, and up to 73% more protein) or an energy supplemented formula for 6 weeks [24]. In that study, the infants receiving the nutrient dense formula did not have a significant decrease in length-for-age z-score, as was seen in the infants receiving the energy-supplemented formula.
There are only a few studies of nutritional interventions using supplement formula in young children with faltering growth, and most of them were done in children older than 3 years [151625]. To our knowledge, intervention studies in toddlers aged 12–36 months are rare. Moreover, some studies applied unclear definitions of faltering growth. In a previous study of 14 children with disabilities who received nutritional formula for 90 days, anthropometric parameters but not biochemical measurements improved [25]. In another study, young children aged 36–60 months whose weight-for-height was below the 25th percentile and who displayed picky eating behaviors gained weight and height after 90 days of nutritional counselling and nutritional supplementation with Pediasure® (Abbot Nutrition, Chicago, IL, USA; a supplement that provides 1.0 kcal/mL with 12%, 43.8%, and 44.8% of calories from protein, carbohydrates, and fat, respectively) [26]. This study did not define ‘faltering growth’ in the study protocol [26]. Similarly, a double-blind placebo-controlled study in the Institute for Endocrinology in Israel revealed that 6 months of supplementation with formula (that provided 28%, 47%, and 25% of calories from protein, carbohydrates, and fat, respectively) improved weight-standard deviation score (SDS) and height-SDS, with no change in body mass index-SDS, in otherwise healthy children aged 3–9 years whose height and weight were less than the 10th percentile for age and sex [15]. An additional year of the intervention in the same study promoted linear growth [16]. The study showed that nutritional supplement formula is a feasible and effective approach to promote linear growth in small and lean prepubertal children; however, the criteria for poor growth were less stringent in that intervention study than what is typically used.
In our study, based in pediatric gastroenterology outpatient clinics in tertiary hospitals in South Korea, we clearly defined faltering growth in the study protocol. While agreeing with the guidelines of the 2017 Korean National Growth Charts about ‘underweight’ in children [4] and of the UNICEF/WHO [518] we defined the criteria more stringently, as a previous study suggested [6]. To ensure the study protocol thorough, we enrolled healthy growth-faltered young children aged 12–36 months and excluded small for gestational aged or premature infants.
The nutritional supplement formula used in the current study provided energy of 1.0 kcal/mL with 12% and 32% of calories from protein and fat, respectively, and contained more vitamins and minerals compared to other formula. Therefore, the formula in this study contained similarly high amount of protein but less fat contents than other pediatric nutritional formula [26]. Our study design was basically set up to provide 400 mL of nutritional formula to each study subject. Because additional 20–50% of calorie intake is recommended for catch-up growth in children with faltering growth [2], more than 60% consumption of supplied nutritional formula, which means additional 240–400 kcal provision in growth faltered children with different body weights may have its rationale.
In the present study, baseline anthropometric and laboratory parameters were not different between the 2 study groups. However, after the 6-month nutritional intervention, children in the good consumption group, whose nutritional intake was sufficient, significantly gained weight and improved their weight-for-age z-score compared to children in the poor consumption group. The good consumption group also revealed a significant trend for increased weight and weight z-score during the intervention period compared to the poor consumption group. Nutritional supplementation with pediatric formula had some positive effects on growth parameters in growth-faltered young children aged 1–3 years when participants' compliance is good. This result is consistent with other previous intervention studies performed in children older than 3 years [1526].
As for micronutrients, in the present study, the proportion of children with abnormal laboratory findings was relatively small, and laboratory parameters did not show significant changes in most cases. In a previous meta-analysis, zinc deficiency contributed to poor growth even in mild to moderate zinc deficiency [27], and zinc supplementation trials had produced positive effect on weight and height [2728]. Iron deficiencies may also affect growth but only when the deficiency is severe [27]. As such, some micronutrients may affect growth in children; however, micronutrient deficiencies alone might not be critical issues in children with faltering growth, as shown in our study.
Many parents are concerned about the growth of their children [1]. They may want advice from health care professionals including doctors and dietitians. As previous studies reported, although home- and community-based growth monitoring did not improve the children's height, growth monitoring did improve parental efforts to improve their children's feeding practices [29]. Therefore, along with nutritional supplementation, age-appropriate programs consisting of nutritional and behavioral education for growth-faltered children and their parents provided by pediatricians and clinical dietitians is important for better outcome.
There are some limitations in this study. First, we designed the study as a single arm study. It would be more ideal to compare the complete consumption group with the control group. However, we could not divide participants into the complete consumption or no consumption groups because of different compliance to the formula. Despite this limitation, we were able to analyze and determine the adequate dose of nutritional supplement (≥ 240 mL/day in this study) required for catch-up growth. Second, the intervention period was relatively short to evaluate the effect on catch-up of linear growth. Thus, changes in height indexes did not reveal a significant difference between the 2 groups after 6 months of short-term follow-up. When linear growth is delayed in addition to faltered weight gain, the catch-up of linear growth occurs more slowly than that of weight. According to a previous study, ever after the catch-up of weight began, the peak velocity for the catch-up of linear growth was not achieved for 1 to 3 months [30].
In conclusion, nutritional supplementation with a concentrated, balanced pediatric nutritional formula along with dietary education might be an effective and safe approach to promote catch-up growth in young children with non-organic growth faltering in developed countries. A future study in a larger group and with a longer-term follow-up is needed.
Go to :
 XML Download