

 PDF
PDF Citation
 Print
Print


INTRODUCTION
Cardiac troponin (cTn) is a specific marker of myocardial injury and an independent predictor of cardiovascular mortality in patients with or without cardiovascular disease.1)2) After the development of a high-sensitivity assay, the new-generation cTn I test not only lowered the number of potentially missed coronary artery disease cases but also provided prognostic information in the context of noncoronary artery disease.3)4) In surgical patients, the postoperative elevation of cTn I has recently been accepted as a strong predictor of 30-day mortality.5)6) Mortality at 30 days in patients with postoperative cTn I elevation is at a concerning rate of 10%, which represents a five-fold increase from the background risk.7)
The prognostic role of cTn I is not only limited to defining the group of patients at increased risk but can also be helpful in stratifying the individual risk of the patients as well. In patients with ST-segment–elevation myocardial infarction, cTn I level offers a good estimation of infarct size, which directly affects prognosis.8)9) The mortality of surgical patients also increases exponentially according to the peak postoperative cTn I concentration.5) On the other hand, cTn I below the 99th-percentile upper range of limit (URL) has mostly been regarded as normal and gained less attention. This was justified largely based on relatively firm evidence demonstrating a sharp increase in mortality when exceeding this threshold.10) However, in the general population, even a mild elevation of cTn I below the URL was significantly associated with increased mortality.11) Therefore, in this study, we sought to evaluate mortality according to cTn I level after noncardiac surgery within normal range by comparing 30-day mortality between patients with postoperative cTn I at the lowest limit of detection and those above the limit of detection but below the URL.
METHODS
Study population and data collection
Data for this study were extracted from the Samsung Medical Center Troponin in Noncardiac Operation (SMC-TINCO) registry which was registered at https://cris.nih.go.kr before patient enrollment (KCT0004244). The SMC-TINCO registry is a large, single-center cohort of deidentified patients. A total of 43,019 consecutive patients with cTn I level measured before or within 30 days after noncardiac surgery between January 2010 and June 2019 at SMC, Seoul, Korea, were enrolled. As the entire data were initially extracted as deidentified, the Institutional Review Board at SMC waived the need for approval for this study and the requirement for written informed consent for access to the registry (SMC 2019-08-048).
The data in the SMC-TINCO registry were extracted using the “Clinical Data Warehouse Darwin-C” of SMC, which was built for investigators to search and retrieve deidentified medical records from the institutional electronic archive system. SMC operates as a paperless hospital, and our institutional electronic archive system contains the data of more than four million patients including records of more than two million surgeries, 900 million laboratory findings, and 200 million prescriptions. In addition to institutional data, reports of mortalities in this system are consistently updated and confirmed by the National Population Registry of the Korea National Statistical Office using a unique personal identification number. After extracting the data from the preoperative evaluation sheets, the baseline characteristics of the patients were organized into a standardized form by independent investigators who were blinded to mortalities or cTn I level.
From our registry, we initially identified 6,824 adult patients with a normal preoperative cTn I level and an available postoperative cTn I level within 30 days after surgery. The patients with postoperative elevation above the 99th-percentile URL were excluded from the primary analysis, and the remaining patients were divided according to the peak postoperative cTn I level within the normal range, as follows: a no-elevation group having postoperative peak cTn I at the lowest limit of detection and a minor elevation group having postoperative peak cTn I above the lowest limit of detection but below the 99th-percentile URL. For further analysis, the minor elevation group was divided according to the median value of cTn I, and each subgroup was compared with the no-elevation group. For additional analyses, the same analyses were conducted after excluding patients with preoperative cTn I above the lowest limit of detection to minimize the effect of preoperative level. The patients who were excluded from the primary analysis for having postoperatively elevated cTn I above the URL were also compared with the no-elevation group in further analysis.
Study endpoints and definitions
The primary endpoint was 30-day mortality, and in-hospital mortality was also compared. Past medical history was determined based on preoperative evaluation sheets and admission notes from the extracted electronic medical records. Hypertension was self-reported or defined by the prescription of antihypertensives or a systolic blood pressure of more than 140 mmHg at rest. Diabetes mellitus was defined as a history of treatment such as medication and lifestyle intervention or a diagnosis of type 1 or type 2 diabetes mellitus. A history of stroke was defined as a history of neurological function loss caused by an ischemic or hemorrhagic event with residual symptoms at least 24 hours after onset. Chronic kidney disease was defined as any condition with a gradual loss of kidney function with a serum creatinine level consistently over 2.0 mg/dL or being on dialysis. Heart failure included diastolic heart failure with preserved left ventricular function and was defined as a history of heart failure or the use of loop diuretics accompanied by symptoms. Active cancer was defined as a histologic diagnosis of cancer within the previous six months.12) High-risk surgery was defined according to the 2014 European Society of Cardiology/European Society of Anesthesiology (ESC/ESA) guidelines.13) Postoperative acute kidney injury was stratified according to pre- to postoperative change of creatinine level based on the Kidney Disease Improving Global Outcomes (KDIGO) criteria.14)
Perioperative management and cardiac troponin I
Perioperative management of patients followed institutional protocols, which were based on the current guidelines. According to the institutional guideline, perioperative cTn I was measured in patients with more than moderate risk or undergoing moderate- to high-risk surgeries.13) It was also measured at the discretion of attending clinician in patients with mild risks. An automated analyzer (Advia Centaur XP; Siemens Healthcare Diagnostics, Erlangen, Germany) with a highly sensitive immunoassay was used for cTn I measurement. The lowest limit of detection was 6 ng/L. The 99th-percentile URL was 40 ng/L, as provided by the manufacturer.
Statistical analysis
Differences between each group were evaluated by using the t-test or Mann-Whitney U test, as applicable and were presented as means±standard deviations (SD) or medians with interquartile ranges (IQRs) for continuous variables. Categorical data were compared by using the chi-squared or Fisher's exact test. Kaplan-Meier estimates were used to construct survival curves and compared with the log-rank test. Cox regression was used to compare 30-day and in-hospital mortalities. To further reduce selection bias and maximize study power while maintaining balanced confounding variables between the two groups, we used a propensity score-matching method. An appropriate balance between the groups with an absolute standard mean deviation (SMD) of less than 10% suggested successful propensity score-matching. In the propensity score-matched population, we compared hazard ratios (HRs) with 95% confidence intervals (CIs) for outcomes using a Cox regression model with a frailty model. To estimate an optimal cutoff value of cTn I to predict 30-day mortality within the 99th-percentile URL, Pearson's correlation coefficient and receiver operating characteristic (ROC) plots were constructed to estimate the threshold and compute the specificity and sensitivity. The least absolute shrinkage and selection operator (LASSO) model, regression analysis that fits a generalized linear model via penalized maximum likelihood and select variables, was used to evaluate variables associated with minor elevation of postoperative cTn I.15) The power of the study regarding the sample size was calculated using Spearman's rank correlation.16) To analyze sensitivity of the result, the observed association was separately evaluated in patients with cTn I measurement within 12 hours after surgery, male patients, in patients with diabetes or hypertension, and in patients without history of ischemic heart disease. We also estimated the potential impact of unmeasured confounders.17) Statistical analyses were performed using R 3.5.3 (http://www.R-project.org/; The R Foundation, Vienna, Austria). All tests were 2-tailed, and p<0.05 was considered to be statistically significant.
RESULTS
After excluding 1,512 patients with the peak postoperative elevation of cTn I above the URL, a total of 5,312 patients were stratified into the two groups: the no-elevation group (n=2,582; 48.6%), defined as patients with the peak cTn I within the lowest limit of detection (6 ng/L), and the minor elevation group (n=2,730; 51.4%), defined as patients with the peak cTn I level of more than 6 ng/L but less than 40 ng/L. The flowchart of study patients is shown in Supplementary Figure 1.
During 30 days after operation, the mean number of cTn I measurements was two for each group. The median durations of operation to the peak postoperative cTn I level were 1.92 hours (IQR, 1.2–4.08) in the no-elevation group and 16.56 hours (IQR, 3.12–44.64) in the minor elevation group (p<0.001). The incidences of major bleeding that occurred in the critical sites (intracranial, intraspinal, intra-articular, intraocular, pericardial, retroperitoneal, or intramuscular with compartment syndrome) based on International Classification of Diseases, Tenth Revision codes were 1.5% (39/2,582) in the no-elevation group and 1.8% (50/2,730) in the minor elevation group. The baseline characteristics are summarized in Table 1. The minor elevation group tended to be older and showed a higher incidence of male sex; hypertension; current alcohol use; chronic kidney disease; and a history of ischemic heart disease, heart failure, stroke, arrhythmia, or heart valve disease. The incidence of active cancer was lower in the minor elevation group. During preoperative management, the minor elevation group more frequently relied on the intensive care unit, continuous renal replacement therapy, and ventilators. Regarding the preoperative medications used such as statins, antiplatelet agents, beta-blockers, calcium channel blocker, renin–angiotensin–aldosterone system inhibitors, and warfarin, the minor elevation group also showed a higher rate. High-risk surgery according to the ESC/ESA guidelines, emergency operations, general anesthesia, and intraoperative red blood transfusions were more frequently found in the minor elevation group. The types of surgery performed are summarized in Supplementary Table 1.
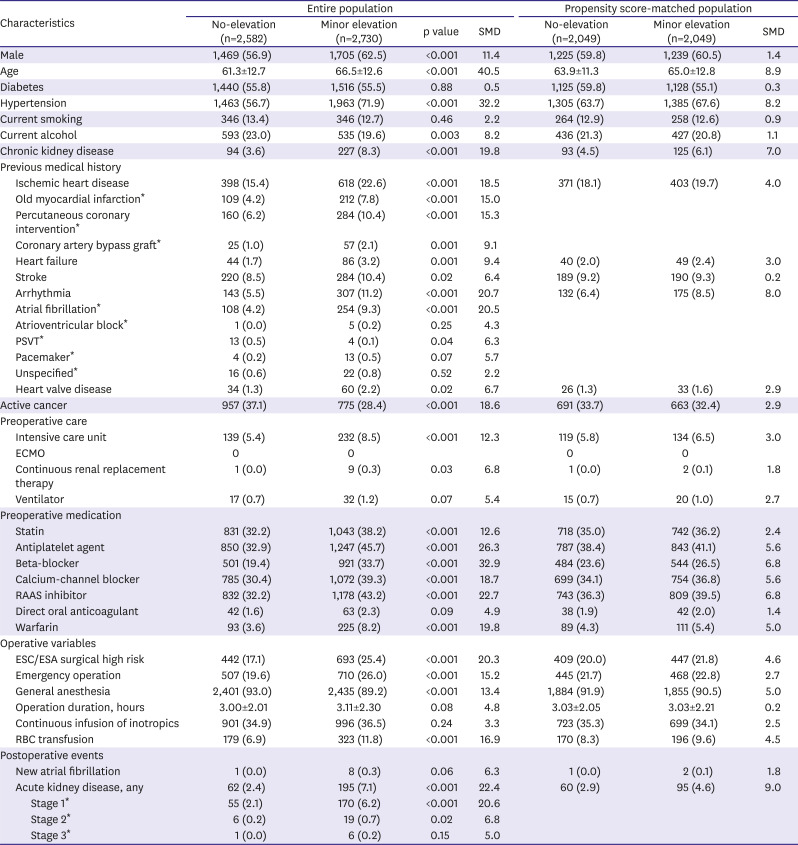
Table 1
Baseline characteristics between no-elevation and minor elevation population
Data are presented as number (%) or mean±standard deviation.
ECMO = extracorporeal membrane oxygenation; ESA = European Society of Anaesthesiology; ESC = European Society of Cardiology; PSVT = paroxysmal supraventricular tachycardia; RAAS = renin-angiotensin-aldosterone system; RBC = red blood cell; SMD = standardized mean difference.
*Variables are not retained in propensity score matching.
![]()
After an adjustment, the risk of 30-day mortality was significantly higher in the minor elevation group (0.5% vs. 2.2%; HR, 3.77; 95% CI, 2.05–6.94; p<0.001). Separately, the median durations of in-hospital stay were eight days (IQR, 5–12) in the no-elevation group and nine days (IQR, 6–17) days in the minor elevation group. In-hospital mortality was also significantly higher in the minor elevation group (0.8% vs. 2.6%; HR, 1.81; 95% CI, 1.19–3.40; p=0.03) (Table 2). Survival curves for the entire population are shown in Figure 1.
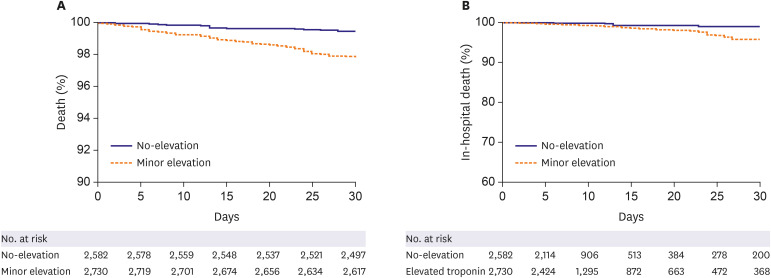
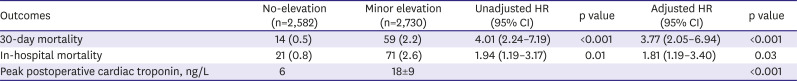
Figure 1
The Kaplan-Meier curves of the entire population. Graph (A) for 30-day mortality and graph (B) for in-hospital mortality during 30 days.
![]()
Table 2
Clinical outcomes between no-elevation and minor elevation population in the entire population
Data are presented as number (%) or mean±standard deviation.
Variables retained for multivariable analysis adjustment include male, age, hypertension, chronic kidney disease, ischemic heart disease, arrhythmia, active cancer, preoperative intensive care unit, preoperative statin, antiplatelet agent, beta-blocker, calcium-channel blocker, RAAS inhibitor, and warfarin, ESC/ESA surgical high risk, emergency operation, and general anesthesia.
ESA = European Society of Anaesthesiology; ESC = European Society of Cardiology; CI = confidence interval; HR = hazard ratio; RAAS = renin-angiotensin-aldosterone system.
![]()
After propensity score-matching, a total of 2,049 pairs of data were generated by 1:1 individual matching without replacement. No significant imbalance in the baseline characteristics were observed between the matched data pairs (Table 1). Clinical outcomes in the propensity score-matched population showed similar results with the entire population (0.5% vs. 2.3%; HR, 4.30; 95% CI, 2.23–8.29; p<0.001 for 30-day mortality and 0.8% vs. 2.4%; HR, 1.84; 95% CI, 1.04–3.25; p=0.04 for in-hospital mortality) (Table 3). Survival curves for the propensity score-matched population are shown in Figure 2.
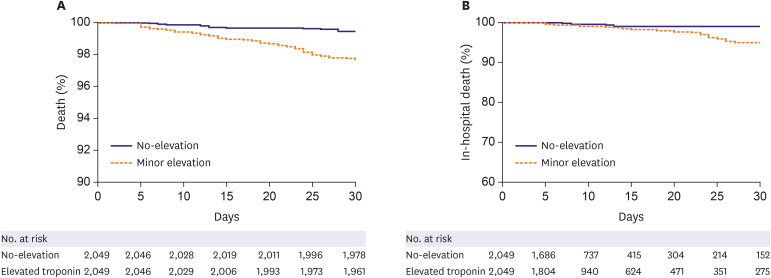

Figure 2
The Kaplan-Meier curves of the propensity score-matched population. Graph (A) for 30-day mortality and graph (B) for in-hospital mortality during 30 days.
![]()
Table 3
Clinical outcomes between no-elevation and minor elevation population in the propensity score matched population
Data are presented as number (%) or mean±standard deviation.
CI = confidence interval; HR = hazard ratio.
![]()
The minor elevation group was further divided by the median value of the postoperative peak cTn I level, which was 15 ng/L. The characteristics of both subgroups were compared with those of the no-elevation group, revealing significantly higher 30-day mortality rates (0.5% vs. 2.0%; HR, 3.68; 95% CI, 1.94–6.98; p<0.001 for the below-median group and 0.5% vs. 2.4%; HR, 4.38; 95% CI, 2.33–8.23; p<0.001 for the above-median group). The comparison between the below and above median groups showed no significant difference in 30-day mortality (2.0% vs. 2.4%; HR, 1.19; 95% CI, 0.71–1.99; p=0.50) (Table 4). In the propensity score-matched population, the median value of postoperative peak cTn I level was also 15 ng/L. The 30-day mortality in the propensity score-matched population showed similar results (0.5% vs. 2.3%; HR, 4.33; 95% CI, 2.12–8.83; p<0.001 for the below-median group and 0.5% vs. 2.4%; HR, 4.27; 95% CI, 2.08–8.77; p<0.001 for the above-median group) (Table 4). Survival curves for three group comparisons in the entire and propensity score-matched populations are shown in the Figure 3. Within the 99th-percentile URL, the optimal cutoff value of cTn I to predict 30-day mortality was 6 ng/L with the area under the ROC curve 0.657. Using this value, the sensitivity and specificity were 80.8% and 49.0%, respectively (Figure 4).
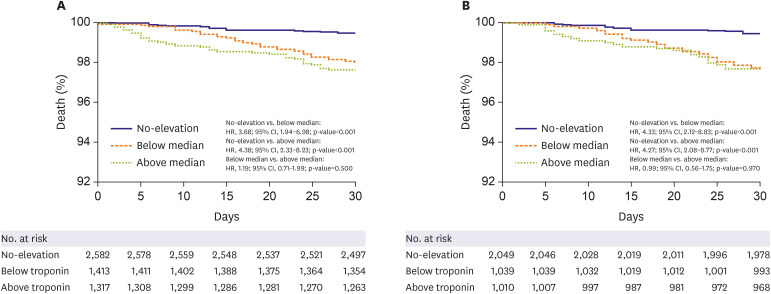
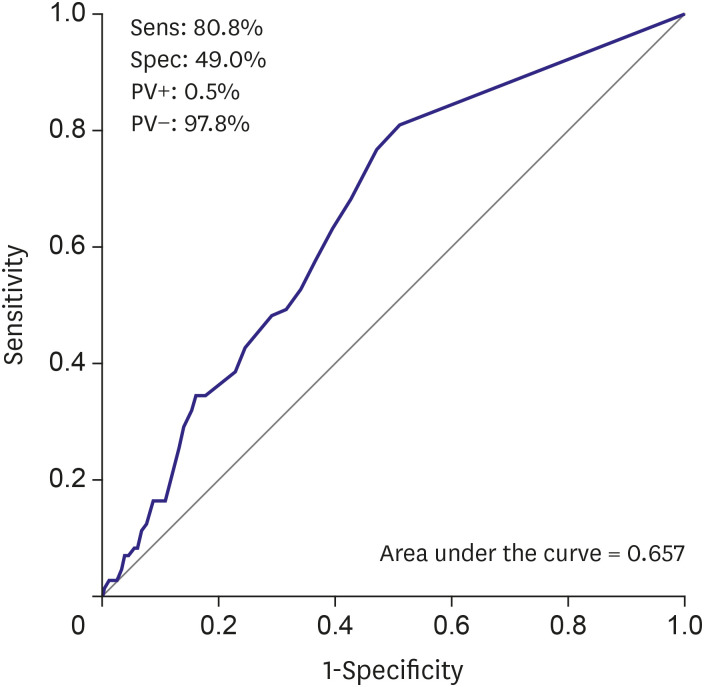
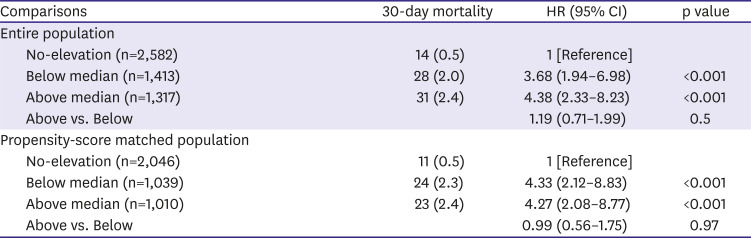
Figure 3
The Kaplan-Meier curves of 30-day mortality according to three groups: no-elevation group, below the median value group, and above the median value group. Additionally, values (A) for the entire population and (B) for the propensity score-matched population can be noted.
![]()
Figure 4
Receiver operating characteristic curves for postoperative cardiac troponin within the 99th-percentile upper reference limit associated with 30-day mortality.
PV+ = positive predictive value; PV− = negative predictive value; Sens = sensitivity; Spec = specificity.
![]()
Table 4
30-day mortalities after 3 group stratifications
![]()
The baseline characteristics and clinical outcomes after excluding the patients with preoperative cTn I above the lowest limit of detection are summarized in Supplementary Tables 2 and 3. Survival curves for these patients were presented in Supplementary Figures 2 and 3. Separately, the clinical outcomes of the patients who were excluded from the primary analysis because of postoperative elevations of cTn I above the URL are presented in Supplementary Table 4. In the LASSO model, variables that were significantly associated with postoperative minor elevation of cTn I included preoperative cTn I level (16.99), old myocardial infarction (0.0183), male (0.012), age (0.00544), hypertension (0.00514), preoperative continuous renal replacement therapy (0.18), beta-blocker (0.0422), surgical high risk (0.0543), emergency operation (0.0033), operation duration (0.00667), intraoperative red blood cell transfusion (0.0163), acute kidney disease (0.0784), and active cancer (−0.0221) (Supplementary Figures 4).
Regarding the sample size, the power of this study was 0.99. The results of sensitivity analysis are summarized in Supplementary Figure 5 and Supplementary Table 5. We estimated the effect of an unmeasured confounder with an assumed prevalence of 40%, and the observed association was all significant.
DISCUSSION
The main finding of this study was that, in the patients with normal cTn I levels before and after noncardiac surgery, postoperative mild elevation of cTn I below the 99th-percentile URL was associated with an increased 30-day mortality rate compared with cTn I below the lowest limit of detection. The increased risks for mortality were similar between the patients with postoperative cTn I level findings above and below the median value of 15 ng/L, and estimated cutoff value within the 99th-percentile URL to predict 30-day mortality was 6 ng/L. Our findings raise a question of the clinical feasibility of interpreting postoperative cTn I as a binary value to predict mortality and suggest that applying the 99th-percentile URL of cTn I as a threshold in surgical patients may require more complex interpretation.
Studies about cTn in noncardiac surgery have recently been published,3)5)18)19) and an elevated cTn I level after noncardiac surgery has emerged as the most common contributing factor of death during the first 30 days postoperative.7) The 99th-percentile URL is currently suggested as the threshold of postoperative elevation, mostly based on previous studies demonstrating an increased risk among patients over this threshold.20)21) However, postoperative mortality within patients with cTn I level below the 99th-percentile URL has not been accurately evaluated, but commonly regarded as normal. The results of this study showed that even mildly elevated cTn I below the 99th-percentile URL was significantly associated with increased risk of 30-day mortality after noncardiac surgery when compared with the lowest limit of detection. These findings suggest some important points in the clinical application of postoperative cTn I. Interestingly, in the diagnosis of myocardial infarction, robust evidence supports the use of “negative” cTn I level below the 99th-percentile URL to rapidly and confidently “rule out”.22)23) Meanwhile, the postoperative elevation of cTn I level in noncardiac surgery was shown to be effective in “ruling in” a risk of mortality.20)21) The results of our study add that using the 99th-percentile URL of postoperative cTn I to “rule out” the risk might even be misleading, because the risks of patients within the normal range might be discrete according to the cTn I level.
The clinical feasibility of the 99th-percentile URL is an issue to mention. An elevation of cTn I above this level reflects an injury of the myocardium, and numerous studies in a wide variety of clinical settings of noncoronary artery disease have shown a prognostic efficacy.5)24)25)26)27) However, an elevation does not indicate any underlying pathophysiological mechanisms, because the 99th-percentile URL is derived from apparently normal individuals.28) Moreover, the unconditional application of cTn I with a single specific cut-off value represents a potential challenge because the cTn I assays lack supporting expert opinions or consensus in the context of several conditions such as in the elderly, in relation to sex, or in those undergoing surgery.29) In addition, all of the previous studies on postoperative elevation used cTn T, and no study has yet established optimal thresholds for cTn I.21) Although the current guidelines recommend the 99th-percentile URL as a definition of elevation for every cTn I assay,10) our results might have been driven by the use of cTn I, and a more tailored threshold may be needed.
Less likely explanations include the presence of a graded association and the effect of preoperative cTn I level. A previous meta-analysis showed that the basal elevated cTn I level, below the 99th-percentile URL, is associated with an increased mortality in the general population,11) In our further analysis, the increased risk was numerically higher for the patients above the median value compared with those below the median value of cTn I, but it was not significantly different. In addition, the optimal cutoff value of cTn I within the 99th-percentile URL to predict mortality was estimated to be 6 ng/L, the lowest limit of detection.
The preoperative level of cTn I should also be taken into account considering the half-life of the biomarker.21) There is a possibility that some patients in the minor elevation group were in the process of a decreasing phase of cTn I, and consequently, patients who preoperatively had cTn I elevation may have been included in the minor elevation group. This may have caused the poor outcomes of the minor elevation group. In this study, preoperative cTn I level appeared to be the strongest predictor of postoperative minor elevation of cTn I, but in the analysis including only the patients with cTn I in the lowest limit of detection, minor elevation was still associated with increased mortality.
Another interesting result was found during additional analysis. The incidence of 30-day mortality in patients who were excluded from the primary analysis for postoperative cTn I elevation was enormously higher than in both groups with cTn I values below the URL. This result correlates well with those of previously reported studies.3)5)18)19) Therefore, this study does not deny the validity of the currently used threshold of the 99th-percentile URL but rather suggests an extended interpretation of postoperative cTn I be made, even when it is regarded as within the normal range. The sensitivity analysis also showed that a mild elevation of cTn I below the 99th-percentile URL was associated with increased mortality, regardless of whether cTn I was measured within or beyond 12 hours after surgery. Additional studies are needed to confirm our findings. One of the strengths of this study is that all of the data were collected using our unified electric system. Such enabled the extraction of comprehensive data including basic characteristics of the patients and medical treatments from the general ward, intensive care unit, operating theater, and outpatient department, leaving minimal space for human error during the data curation.
Our results should be appraised in the light of the following limitations. First, this was a single-center, observational study, and the results might have been affected by confounding factors. Despite an adjustment with multivariate and propensity score-matched analysis, unmeasured variables were not able to be corrected. Second, a pre- and postoperative cTn I test for noncardiac surgery is not routinely measured in all patients at our institution. Generally, the patients with a high cardiovascular risk underwent the test and, consequently, the results of the present study may have been exaggerated. Third, a detailed preoperative cardiac evaluation was not performed in all patients. Hence, several preoperative variables such as left ventricular ejection fraction or coronary artery stenosis that affect postoperative prognosis were not available in the present study. Lastly, the need for further medical treatment or intervention in patients with a mild postoperative cTn I elevation could not be determined in this study. Despite these limitations, this is the first study to our knowledge to investigate the association between mild elevation of cTn I below the 99th-percentile URL and 30-day mortality with robust propensity score matching. The results of the present study may affect future clinical practice for prognosis prediction in patients undergoing noncardiac surgery.
After noncardiac surgery, a normal cTn I level showed significantly different risks of 30-day mortality between patients with the lowest level of detection and mildly elevation below the 99th-percentile URL, respectively.
 XML Download