

 PDF
PDF Citation
 Print
Print


INTRODUCTION
Atherosclerosis, characterized by luminal thrombus formation on a ruptured atherosclerotic plaque, is a leading cause of acute coronary syndromes and cardiovascular disease in men and women.1) Pathologic alteration of the atherosclerotic plaque, such as thinning of the fibrous cap and the development of a large necrotic core, predisposes the plaque to rupture, which then triggers thrombosis.2) Established antithrombotic drugs, including thrombin inhibitors3) and tissue plasminogen activator (t-PA),4) are provided to patients in atherosclerosis therapeutic strategies to prevent restenosis after angioplasty and endarterectomy.
Thrombin plays a critical role in the coagulation cascade. On the one hand, thrombin has been suggested to increase endothelium-dependent vasorelaxation, whereas, on the other hand, thrombin may increase vascular inflammation, alter endothelial cell phenotype thus decreasing endothelial function, cause contraction and proliferation of vascular smooth muscle cells, and thereby accelerate atherogenesis. Dabigatran etexilate has been developed as a candidate oral anticoagulant5) for long-term administration. This drug is already used to treat cases of nonvalvular atrial fibrillation, and its clinical application is extending with its application as an inhibitor of activated coagulation factor X6) in second-generation anticoagulant therapy to replace warfarin.
Conversely, retaining thrombolytic potential after fibrinolytic therapy of atherothrombosis is crucial. Altered expression of proteases associated with thrombolysis has been implicated in the expansion of atherosclerotic plaque and hemorrhage.7) However, the underlying mechanism is not understood in detail, although decreased fibrinolytic activity is recognized as a risk factor in ischemic cardiovascular disease.
Despite the need to understand fibrinolytic homeostasis in the context of ischemic diseases, few reports describe the fibrinolytic activities associated with atherosclerotic diseases. This deficiency is due, in part, to the lack of an appropriate experimental approach for evaluating thrombolysis. For example, whereas some studies indicate that upregulation of the blood plasminogen activator inhibitor 1 (PAI-1) level is closely associated with cardiovascular risk,8) others report the lack of direct evidence linking the blood PAI-1 level to coronary artery disease.9) In this regard, an effective in vivo model of thrombolysis is urgently needed to investigate thrombolytic activity during the progression of atherosclerosis.
In the present study, we evaluated the effects of long-term thrombin inhibition due to treatment with dabigatran etexilate on spontaneous thrombolytic activity during the progression of atherosclerosis in apolipoprotein E (ApoE)–/––low density lipoprotein receptor (LDLR)–/– double-knockout mice.
Go to : 
METHODS
Experimental animals and drug administration
Double-homozygous Apo-E−/−-deficient and LDLR−/−-deficient mice (DKO mice, 129 × C57BL/6J background) were obtained originally from The Jackson Laboratory (Bar Harbor, ME, USA). The mice subsequently were bred through brother-sister mating. For the control group of atherosclerotic analysis, immunohistochemical analysis, C57BL/6 mice (age, 10 to 13 weeks) were obtained from SLC (Hamamatsu, Japan). All animals were maintained at Kobe Gakuin University in air-conditioned rooms (22.5±0.5°C; humidity, 50±5%) on a 12:12-h light:dark photocycle. Only male mice were used in the present study. Animals had free access to chow and drinking water. All procedures were conducted in compliance with the Guiding Principles for the Care and Use of Animals in the Field of Physiological Science of the Physiological Society of Japan.
Two groups (placebo, dabigatran-treated) of 28-week-old mice (n=38 overall) were included in the study. After preliminary breeding for 6 weeks, all mice (6-week-old mice) were given either placebo chow or dabigatran-supplemented chow (BIBR1048MS 7.5 mg dabigatran etexilate/g) as the experimental chow for 22 weeks. C57BL/6 mice were fed placebo chow and served as the control group of atherosclerotic analysis, immunohistochemical analysis. Dabigatran-supplemented chow (0 mg drug/g-chow, 7.5 mg drug/g-chow) was kindly provided by the manufacturer (Boehringer Ingelheim, Ingelheim am Rhein, Germany) and has been adjusted based on high-fat diet (ER R/M acc D122451(II)mod, ssniff Spezialdiäten GmbH, Soest, Germany). Dabigatran-supplemented and control chows were provided for a total of 22 weeks, after which we evaluated all mice. The dose of dabigatran that we used here reflects the low bioavailability of dabigatran in mice (about 6.5%), thus necessitating a relatively high dose for oral administration.10)11)
Effectiveness and plasma concentration of dabigatran
After the mice had been fed the experimental chow for 22 weeks, we collected blood from the abdominal aorta of each mouse into 3.14% sodium citrate by using a 23-gauge needle. All samples of citrated plasma were stored at −80°C until analysis. The plasma concentrations of dabigatran were measured by using the Hemoclot Thrombin Inhibitors assay (Hyphen Biomed, Neuville-sur-Oise, France) according to the manufacturer's instructions with slight modifications. In brief, mouse plasma samples were diluted 1:8 by using 0.9% NaCl solution; 37.5 µL of this dilution was mixed with 75 µL of normal human plasma. After incubation for 1 minute at 37°C, 75 µL of a thrombin solution were added to the mixture, and clotting times was measured using a coagulometer (CA-101, Sysmex, Kobe, Japan). For quantification purposes, dilutions of Dabigatran Calibrator Low (Hyphen Biomed), covering the range 0 to 500 ng/mL, were run in parallel. All experiments were performed in duplicate.
Determination of PAI-1 in plasma
After 22 weeks of feeding the experimental chow, blood was drawn from the abdominal aorta of mice into 3.14% sodium citrate by using a 23-gauge needle. All samples (citrated plasma) were stored at −80°C until analysis. Plasma PAI-1 levels were determined by using a commercial ELISA kit (IMPAIKT-TOT, Innovative Research, Novi, MI, USA).
Bleeding time
Mice were anesthetized by using sodium pentobarbital (60 mg/kg, intraperitoneal), and bleeding time was determined. In brief, a 3-mm tail-tip transection was made, and blood drops were removed every 15 seconds by using filter paper. If blood flow did not reoccur within 30 seconds of wiping away a blood drop, bleeding was considered stopped. Experiments were terminated after 30 minutes if blood flow had not ceased.
Measurement of atherosclerosis
We assessed the progression of atherosclerosis by estimating the area of an atherosclerotic region as a percentage of the entire surface area of the aorta, as previously described.12) Briefly, hearts were exposed through abdominal incision, and phosphate-buffered saline (PBS; pH 7.4) followed by 10% neutral-buffered formalin (Nacalai Tesque, Tokyo, Japan) was infused through an indwelling 20-gauge butterfly needle (Top Kasei, Tokyo, Japan). In addition, the major blood vessels were washed with PBS and fixed with 10% neutral-buffered formalin solution by reflux through a femoral artery. Connective tissue and minor branching blood vessels were removed from the aortic arch. The extracted vessels were kept in 10% neutral-buffered formalin until processed, when they were incised along the longitudinal plane and pinned flat. The tissue was washed with distilled water for 30 seconds, treated with 60% isopropyl alcohol for 1 minute, and stained with Oil Red O (to identify atherosclerotic plaques) at 37°C for 15 minutes. Finally, the tissue was washed with 60% isopropyl alcohol and distilled water.
Stained specimens were photographed (Pentax K-7, Ricoh, Tokyo, Japan); images were transferred to a personal computer and analyzed by using image analysis software (Image-Pro Plus, Media Cybernetics, Rockville, MD, USA). The whole area (W) of the dissected aorta and the portion that stained positively with Oil Red O (R) were calculated; the resulting ratio [(R÷W)×100%] was used as an index of atherosclerotic progression.
Experimental thrombolysis model
Our model for evaluating thrombolysis in vivo was based on a previously described model.13) Briefly, mice were anesthetized with sodium pentobarbital (60 mg/kg, intramuscular), and femoral blood vessels were exposed through a median incision. Cannulae (PE 50, Becton Dickinson, Franklin Hills, NJ, USA) were introduced into a femoral vein and artery for administering Evans blue dye and monitoring blood pressure, respectively. The blood vessel on the cremaster muscle was isolated, placed on a Perspex plate, and an O-ring was placed around the tissue to prevent vessel movement. The Perspex plate then was attached to the stage of a microscope (BX51, Olympus, Tokyo, Japan) and the preparation viewed by using a long working-distance objective. Arterioles (diameter, 30 to 35 µm) were selected for irradiation. The He–Ne laser beam was introduced into the microscope by using a dichroic mirror and focused on the center of the selected vessels. The diameter of the laser spot on the focal plane was 15 µm with a power of 25 mW. Evans blue (1.6 mg/kg; E. Merck, Darmstadt, Germany) was injected through the cannula; 5-second irradiation was repeated every 30 seconds until a mural thrombus that occluded 90% of the vessel lumen was formed. After stabilization for 10 minutes, images of the formed thrombus were captured for 60 minutes and stored in the computer.
Analysis of thrombus volume
Changes in thrombus volume were analyzed by using image analysis software (Image-Pro Plus, Media Cybernetics) as previously described.14) Briefly, 2D images of thrombi were captured in situ at 5-minute intervals. Subsequently, 3D images were constructed by establishing optical density values relative to that of an area of the blood vessel lumen not involved in thrombus formation. Integrative optical density (IOD) values corresponding to thrombus volume were computed. Changes in thrombus volume were calculated according to the following formula: relative thrombus volume = IODn÷IODo (IODn, IOD at a particular time interval during thrombolysis; IODo, IOD immediately after the stabilization of thrombus). The extent of thrombolysis was expressed as a percentage of the initial thrombus volume (that is, IODo).
Histological analysis
For immunohistochemistry, the heart was exposed, and a butterfly catheter was inserted into the left ventricle. The heart was flushed with 10 mmol/L PBS (pH 7.4) for about 3 minutes, to remove all blood. Blood vessels then were perfusion-fixed with 4% paraformaldehyde in PBS (Wako Pure Chemical Industries, Osaka, Japan).
The aortic root, aortic arch, and brachiocephalic artery were analyzed by immunohistochemistry and histology, and data from the aortic arch are shown. To this end, the blood vessels of interest were fixed in OCT Compound (Tissue-Tek, Sakura, Japan) and frozen by using a dry ice-acetone mixture or liquid nitrogen. Frozen OCT-embedded tissue blocks were cut into 6-µm sections, which were placed on poly-L-lysine-coated microscope slides (Muto Pure Chemicals, Tokyo, Japan). These slides were examined after immunoperoxidase staining with anti-PAI-1 antibody (dilution, 1:100; PAI-1 Rabbit PAb, LabVision, Fremont, CA, USA), anti-t-PA antibody (1:100; t-PA Rabbit PAb, LabVision), anti-Thrombin activatable fibrinolysis inhibitor (anti-TAFI) antibody (1:100; TAFI Rabbit PAb, GeneTex, Irvine, CA, USA), and anti-endothelial nitric oxide synthase (anti-eNOS) antibody (1:100; eNOS Rabbit PAb, LabVision). Epitopes recognized by the primary antibody were visualized by labeling with streptavidin and biotinylated horseradish peroxidase (LSAB2 Kit, Dako, Kyoto, Japan). The slides then were counterstained with Mayer's hematoxylin (TA-125-MH, LabVision) according to standard protocols. During histology, cross-sections were obtained from at least three sections (luminal side, intraplaque, and intimal side) of each plaque.
For the evaluation of the relative concentration of the stained area, the staining intensity was quantified by digital image analysis software (Image Pro Plus Version; Media Cybernetics) followed by immunochemistry data analysis protocol. the staining intensity was determined by modified reciprocal intensity method. The reciprocal intensity was determined in a constant area which contains atherosclerotic plaque per section and then we averaged the results per mouse.
Statistical analysis
Results were expressed as mean ± standard error of the mean. Comparisons among groups were made by using factorial analysis of variance. Differences between groups of each determined parameters were analyzed using Student's t-test. The p value of <0.05 was defined as statistically significant. No adjustments were made. All analyses were accomplished by the statistical package JMP (JMP 13, SAS Institute, Tokyo, Japan).
Go to :
RESULTS
Body weight and food intake
After eating the experimental and control chows for 22 weeks, control mice weighed 36.7±1.0 g (mean±standard error of the mean; n=14), those in the placebo group weighed 49.5±1.3 g (n=32), and dabigatran-fed mice weighed 48.0±1.4 g (n=23). Body weight did not differ significantly between the placebo and dabigatran groups, both of which were on a high-fat diet. Feed intake did not differ between the control group and mice fed dabigatran-supplemented chow.
Plasma concentration of dabigatran
The plasma concentration of dabigatran in the mice fed the supplemented diet was 64.5±8.1 ng/mL (n=9). The inhibitory effect of dabigatran was calculated from thrombin time in international normalized ratio (placebo vs. dabigatran group, 3.2±0.1 [n=8] vs. 6.6±0.5 [n=9]).
Development of atherosclerosis
Representative images of the blood vessels and aortic root dissected from mice in the placebo and dabigatran-fed groups are shown in Figure 1A. In both groups, we evaluated the extent of atherosclerosis after 22 weeks of the experimental chow feeding. The atherosclerotic area in the aorta at 22 weeks was 22.8±1.4% (n=9) in the placebo group compared with 11.2±0.7% (n=8) in the dabigatran-fed group. The atherosclerotic area was significantly (p<0.001) decreased in the mice given dabigatran.
 | Figure 1Progression of atherosclerosis after 22 weeks of high-fat chow feeding in the placebo and dabigatran groups. (A) Representative images of atherosclerotic regions identified by Oil Red O staining of the entire aortic tree. (B) Comparison of atherosclerotic area (mean ± standard error of the mean).
|
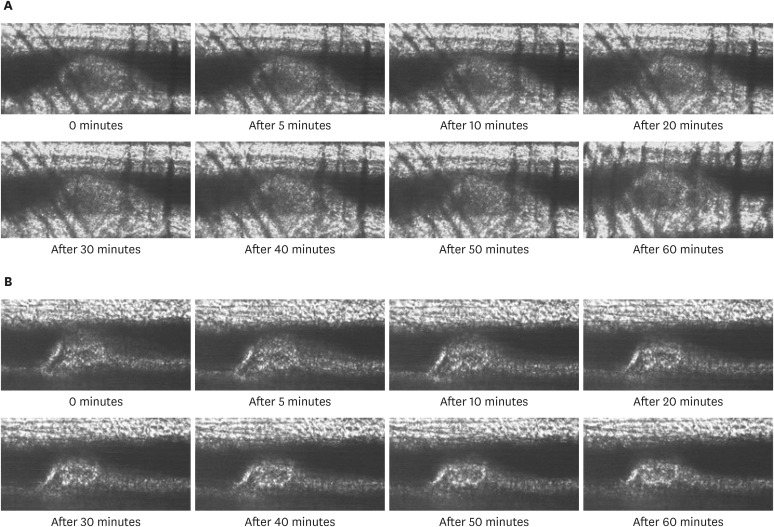
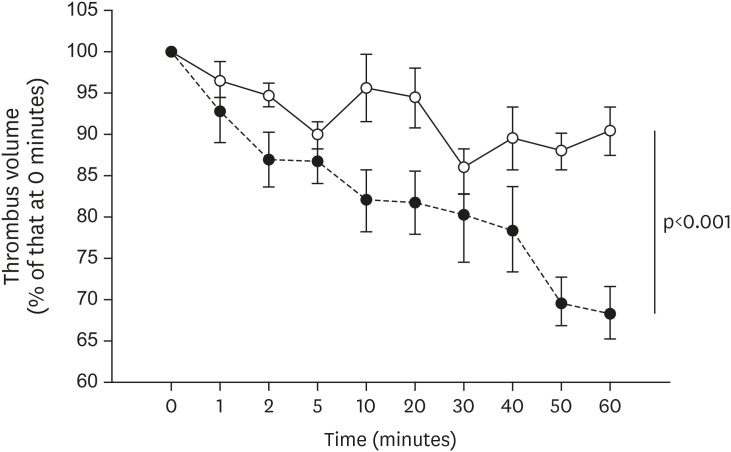
Spontaneous thrombolytic activity
Representative images of the spontaneous thrombolysis in each group are shown in Figure 2. The spontaneous thrombolytic activity, evaluated as the change in thrombus volume over time, in the placebo and dabigatran groups is shown in Figure 3. The thrombus volume at 60 minutes relative to that immediately after thrombus stabilization (that is, time 0) at 22 weeks was 90.3±3.0% (n=8) in the placebo group compared with 68.2±3.1% (n=8) in the dabigatran group. At both time points, relative thrombus volume was greater (p<0.001) in the placebo group than in the dabigatran group.
Plasma PAI-1 level
The plasma PAI-1 concentration was 1.58±0.37 ng/mL (n=9) in placebo group and 1.54±0.28 ng/mL (n=9) in dabigatran group (Data not shown). These values did not differ significantly between both groups.
Histological analysis
The expression of t-PA (Figure 4A and B) did not differ between the placebo and dabigatran groups (p=0.239, n=6). In contrast, expression levels of PAI-1 and TAFI (Figure 5) were decreased (PAI-1: p<0.001, n=6; TAFI: p<0.001, n=6) and that of eNOS (Figure 4C and D) was increased in the dabigatran group compared with the placebo group (p=0.0132, n=6).
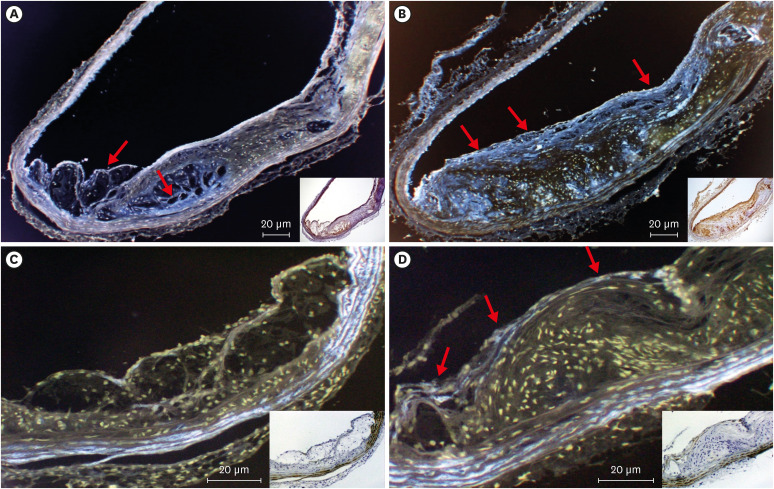 | Figure 4Immunochemistry and pseudo-color treatment of the aortic arch from mice in (A, C) the placebo and (B, D) dabigatran groups after 22 weeks of experimental chow feeding. (A, B) Anti-t-PA. (C, D) Anti-eNOS. Red arrows indicate positive areas (magnification: 100–200×).eNOS = endothelial nitric oxide synthase; t-PA = tissue plasminogen activator.
|
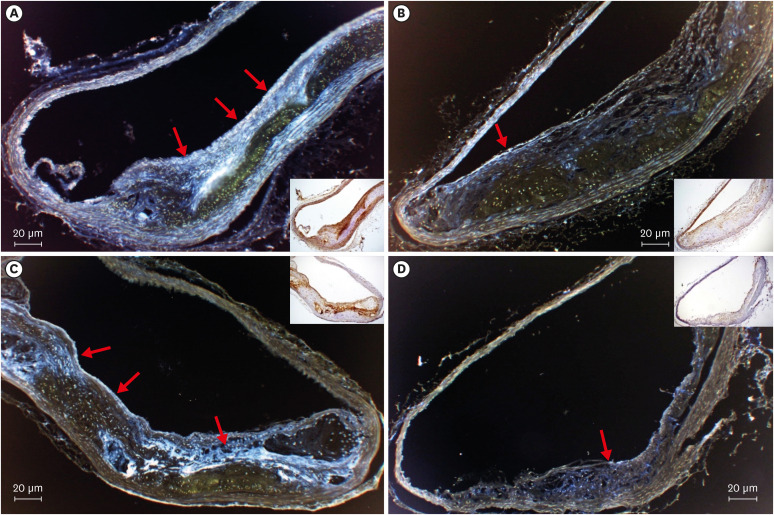 | Figure 5Immunochemistry and pseudo-color treatment of the aortic arch from mice in the (A, C) placebo and (B, D) dabigatran groups after 22 weeks of high-fat chow feeding. (A, B) Anti-PAI-1. (C, D) Anti-TAFI. Red arrows indicate positive areas (magnification: 100×).PAI-1 = plasminogen activator inhibitor-1; TAFI = thrombin activatable fibrinolysis inhibitor.
|
Go to :
DISCUSSION
Fissure or rupture of atherosclerotic plaque initiates the thrombotic process by exposing platelets to the aforementioned thrombogenic cellular and acellular components of plaque. These triggers lead to thrombin formation, with subsequent thrombus development and luminal occlusion.15) Many new oral anticoagulants, such as dabigatran etexilate, have been approved for anticoagulation therapy in patients with nonvalvular atrial fibrillation; in addition, dabigatran may reduce the risk of bleeding during anticoagulation therapy.16) The opportunity to specifically address the key factor—thrombin—through an easy-to-apply treatment option, such as a novel oral thrombin antagonist, prompted us to examine whether anticoagulation accelerates spontaneous thrombolytic activity during the progression of atherosclerosis. However, only scant research data about spontaneous thrombolytic activity are available. In these situations, the pharmacokinetics of thrombolytic activity are highly important, but how changes in thrombolytic activity affect atherosclerotic progression is unknown. In the current study, we established an in vivo murine model of thrombolysis by using double-knockout mice so that we could investigate the changes of thrombolytic activity during atherosclerotic progression. In addition, we assessed the endothelial cell expression of PAI-1, TAFI, t-PA, and eNOS as indicators of spontaneous thrombolytic activity. Furthermore, we used the whole-aorta method to follow atherosclerotic progression in our control and double-knockout mice. This procedure enabled us to investigate not only atherosclerotic progression but also the site of plaque development.
Dabigatran shows high anticoagulant activity in the plasma of humans and other animal species. In addition, the drug inhibits not only the solid-phase thrombin that binds to fibrin but also separated, liquid-phase thrombin. In addition, the anticoagulant action and the antithrombotic efficacy (model of thrombosis) of dabigatran in vitro and ex vivo are dose-dependent.17) Among 18,113 patients with atrial fibrillation in one study, the rate of major bleeding was 3.36% annually in the warfarin-treated group compared with 2.71% annually in the group receiving 110 mg of dabigatran (p=0.003) and 3.11% per year in patients who received 150 mg of dabigatran (p=0.31).18) In addition, the bleeding and thrombin times in dabigatran group were about twice those of the control and placebo groups.
In the current study, the treated mice had about the same frequency of hemorrhagic side effects as those in humans, although we did increase the dosage to account for the decreased absorptivity of dabigatran in mice compared with in humans.10) We consider that the dosage we used was appropriate because plasma levels of dabigatran etexilate was not high compared with other reports.19) However, hemorrhagic side effect obtained in this study is a result for the 26-week old mice. Therefore, the investigation for senile mouse will be necessary in the future.
Here we examined the influence of long-term inhibition of thrombin on thrombolysis by using a model of in vivo thrombolysis. During the first 60 minutes after thrombus formation, the thrombus volume varied significantly in the dabigatran group but not the placebo group (Figures 2 and 3). This result shows that the spontaneous thrombolytic activity in the dabigatran group was higher than that in the placebo group. Thrombolysis is induced when the plasmin activity exceeds the inhibition of plasmin or plasminogen activators because thrombolysis depends on a dynamic balance between plasmin activity compared with plasmin inhibition. Therefore, we felt it necessary to examine the expression of various fibrinolytic factors.
The high-fat-fed groups both expressed t-PA in regions of endothelium that were associated with plaque, and the expression levels did not differ between the groups (Figure 4A and B). We consider that thrombin does not influence t-PA expression directly because thrombin inhibition had no effect on t-PA levels.
In addition, the plasma PAI-1 level did not differ between groups. However, PAI-1 expression was markedly greater in the placebo group than in the dabigatran group (Figure 5A and B). Furthermore PAI-1 production and release in the adipose tissue20) are considered as a cause of the accelerated PAI-1 expression in the placebo group. In addition, because blood lipoprotein(a) (Lp[a]) levels are high in double-knockout mice,21) we considered that Lp(a) induced the increased PAI-1 production in vascular endothelial cells. Moreover, PAI-1 is synthesized in liver, spleen, placenta, megalokaryocytes, adipose cells, smooth muscle cells, macrophages, platelets, and vascular endothelial cells.22) Thrombi contain large amounts of PAI-1 because they consist primarily of platelets, which contain 90% or more of the total PAI-1 in the body.23) In addition, the PAI-1 level in platelets may increase during atherosclerotic progression because lipoprotein and adipose tissue levels increase as well, thus making plaque-associated thrombi particularly difficult to dissolve. Our findings regarding PAI-1 confirm reports of increases in the PAI-1 level during myocardial infarction24) and cerebral stroke.25)
During activation, platelets secrete not only PAI-1, but also another serpin, named protease nexin-l (PN-l), which also inhibits t-PA.26) Recently, it has been established that, in addition to platelet-derived PAI-1, platelet-derived PN-l has relevant antifibrinolytic properties in both humans and mice.26) Thrombin may, in fact, activate platelets and influence the production of PAI-1. Moreover, thrombin activates the conversion of complement 5 (C5) to C5a. Thrombin mediates C5a and consequently induces PAI-1.27) Therefore, the inhibition of thrombin by dabigatran has the potential to lead to inhibition of platelet-derived PAI-1 production.
Furthermore, in the placebo group, TAFI was expressed in the same regions of endothelium that had plaque (Figure 5C and D). This expression was inhibited significantly in the dabigatran group compared with the placebo group. We consider that the decreased expression of TAFI in the dabigatran group was due to inhibition of TAFI activation.
Regarding the influence on the fibrinolysis pathway, TAFI has a greater fibrinolysis inhibitory effect than PAI-1.28) Moreover, because TAFI prevents C5a through a negative feedback loop, TAFI may be related to PAI-1 expression.27)
In addition, the NO production induced by eNOS is necessary for the homeostasis of microcirculation. In the present study, eNOS expression was apparent in vascular endothelial cells in the dabigatran group but not in the placebo group (Figure 4C and D). In addition, eNOS expression was very low in plaque-associated regions of endothelium. The negligible expression of eNOS in the placebo group suggests that NO production was diminished in atherosclerotic regions. Because of NO’s important role in homoeostasis of the microcirculation,29) atherosclerosis-associated decreases in vasodilation likely accelerate concurrent reductions in spontaneous thrombolysis. However, there is a possibility that thrombin accelerated the expression of iNOS. Thrombin induces the expression of iNOS and increases the inflammation.30) The generation of superoxides, leading to the production of peroxynitrite and hydrogen peroxide, would have an even greater effect on the progression of atherosclerosis than would the synthesis of NO. Dabigatran-induced inhibition of thrombin inhibition might prevent these greater effects on the progression of atherosclerosis. Therefore, the influence on the iNOS expression by inhibition of thrombin should be assessed in future experiments.
Prolonged administration of the oral direct thrombin inhibitor dabigatran led to the following changes. First, dabigatran significantly inhibited atherosclerosis progression. Although spontaneous thrombolytic activity decreased as atherosclerosis progressed, dabigatran significantly ameliorated the acceleration of spontaneous thrombolytic activity. We considered that thrombin did not directly influence t-PA expression because dabigatran did not significantly alter the expression of t-PA. In contrast, dabigatran significantly decreased the expression of PAI-1 and TAFI. Together, these results show that thrombin influences both PAI-1 and TAFI expression. Moreover, dabigatran accelerated the expression of eNOS in regions with plaque. This result suggests that thrombin inhibits eNOS expression.
In conclusion, these results of the current study show that thrombin has multiple biological function and pathophysiological diversity. Thrombin inhibition by dabigatran influenced the progress of atherosclerosis, and spontaneous thrombolysis activity. In addition, this decrease in the PAI-1and TAFI expression was suggested as one factor of the decrease in spontaneous thrombolysis.
Go to :
 XML Download