

 PDF
PDF Citation
 Print
Print


INTRODUCTION
Obesity and its associated conditions are fast becoming a burden on modern health care systems.1)2) Obese individuals suffer from an elevated risk of cardiovascular morbidity and mortality, including stroke, congestive heart failure, myocardial infarction and cardiovascular death, and obesity is recognized as an independent cardiovascular risk (CVR) factor.3) Of particular concern is the rising global prevalence of childhood obesity.4) On the basis of developing evidence, it is now apparent that obesity of children and adolescents is associated with CVR, similarly to adults.5) Additionally, obesity has been shown to progress from childhood into adult life, potentially augmenting the risk associated with adult obesity and eventually has an influence on adult cardiovascular diseases (CVD).6)7) Therefore the long-term health risks for obese children and adolescents can be substantial.
Body mass index (BMI) has been considered to be the classical index for defining general overweight and obesity for many years.8) However, developing clinical and epidemiological evidence indicates that markers of the central distribution of fat, such as waist circumference (WC), show a stronger correlation with CVD and CVR factors.9) Furthermore, BMI has been replaced by WC in several definitions for the clinical diagnosis of metabolic syndrome, which is associated with the risk of developing CVD. Therefore, WC, indicating central obesity, can be an important clinical indicator in the identification of individuals likely to possess CVR factors. It has been suggested that central obesity would be a better predictor of the presence of CVR factors than obesity evaluated with BMI in both the youth and adults,10) and there is increasing interest in WC as a screening tool for central adiposity in children. The International Diabetes Federation uses WC as the obesity index in its definition of pediatric metabolic syndrome.11) Therefore, WC could be considered as a potential factor for assessing the risk of obesity-related complications, such as CVD, in youth.12)
However, few studies have investigated the relationship between WC and CVR factors in childhood. Therefore, we performed a cross-sectional analysis of data from children and adolescents 10 to 18 years of age who were included in the Korea National Health and Nutrition Examination Survey (KNHANES) from 2005 to 2014 to assess the association between WC and CVR factors such as hypertension, dyslipidemia, and hyperglycemia. In order to identify when this association starts, we analyzed this relationship in different age groups.
Go to : 
METHODS
Study population
This study was based on data acquired from KNHANES, a nationwide cross-sectional survey that collects information from physical examinations, health interviews, and nutritional evaluations of Korean households. It is conducted by specially trained interviewers or examiners who are not provided with any prior information about the participants. A detailed description of the plan and operation of the survey is available on the KNHANES website (http://knhanes.cdc.go.kr/).13) For the present study, we analyzed 8,153 participants (4,319 boys and 3,834 girls) aged 10–18 years from the KNHANES conducted from 2005 to 2014. Since certain KNHANES measures have a more targeted sampling frame, specific reported measures had different sample sizes. Informed consent was obtained from the all participants in the KNHANES. The protocol of the KNHANES was approved by the Institutional Review Board (IRB) of Seoul National University Bundang Hospital (IRB No. X-1604-344-901). KNHANES participants were arbitrarily categorized based on their age at the time of interview into 3 age groups: early (10–12 years), middle (13–15 years), and late (16–18 years)–adolescence.
Anthropometric measurements
Anthropometric measurements of all participants were performed by trained personnel. Height was determined to the nearest 0.1 cm using a stadiometer (Seca 225; Seca, Hamburg, Germany). Weight was measured to the nearest 0.1 kg using an electronic balance (GL-6000-20; G-tech, Seoul, Korea). The WC was measured using a flexible tape, and determined to the nearest 0.1 cm at the midpoint between the lowest margin of the rib and the uppermost border of the iliac crest during expiration (Seca 220; Seca). Blood pressure (BP) was measured using a mercury sphygmomanometer after the participant had rested for 5 minutes in a sitting position. All BP measurements were taken 3 times using the right arm with a cuff appropriate for the arm's circumference. The average value of the second and third measurements of systolic BP (SBP) and diastolic BP (DBP) were used for subsequent analyses. The Korean Centers for Disease Control and Prevention (CDC) reference data were used to determine sex- and age-specific percentile cutoffs for WC.14) We defined the 90th percentile for WC as the cutoff for “high WC”.
Laboratory tests
Blood samples were collected the morning after the participants had fasted overnight and were analyzed in a central national laboratory. Serum total cholesterol, triglycerides, high-density lipoprotein (HDL) cholesterol, and plasma fasting glucose were measured by use of enzymatic techniques. Low-density lipoprotein (LDL) cholesterol was calculated using the Friedewald equation if the triglycerides measurement was more than 400 mg/dL.15)
Definition of cardiovascular diseases risk factors
Hypertension was defined as an SBP and/or DBP equal to or above the sex-, age-, and height-specific 95th percentile.16) We used the US CDC reference tables for defining childhood hypertension because the Korean CDC reference tables are based on BP values measured by automated oscillometric devices.14)16) We used standard cutoff values for dyslipidemia and hyperglycemia. A total cholesterol concentration of 200 mg/dL or more, an LDL cholesterol concentration of 130 mg/dL or more, and a triglyceride concentration of 130 mg/dL or more were defined as high.17) A low HDL cholesterol level and a high fasting glucose level were defined as a concentration of less than 40 mg/dL18) and a concentration of more than 100 mg/dL, respectively.
Statistical analysis
Statistical analysis was performed using SPSS version 20 (IBM, Armonk, NY, USA). Since the influence of sex on body size and CVR factors is well known, analyses were performed separately for boys and girls. We compared age adjusted means of WC, lipid profiles, fasting glucose, and age- and height-adjusted means of BP between boys and girls using analysis of covariance. We performed covariate analysis with adjustment for age in lipid profile and glucose related analysis, and for age and height in BP related analysis. Multiple linear regression analysis was performed to determine the association between WC z-score and BP adjusted for age and height, and lipid profile and fasting glucose adjusted for age. WC z-score was calculated based on Korean CDC growth chart.14) The results of the covariate analysis were presented as mean values for CVR variables and for prevalence of CVR factors in normal and high WC groups, and the differences between normal and high WC groups were examined. Logistic regression analysis was performed in order to calculate the relevant odds ratio (OR) with a 95% confidence interval (CI) for the association between high WC and CVR factors. Additionally, in order to identify when these associations begin, we performed the same analyses in the different age groups. A p-value of <0.05 was considered statistically significant.
Go to :
RESULTS
Comparison of cardiovascular risk factors between boys and girls
Data for adolescents aged 10–18 years who were included in KNHANES 2005–2014 were analyzed. Table 1 presents the comparison of age adjusted means of WC, lipid profiles, fasting glucose, and age- and height-adjusted means of BP between boys and girls.
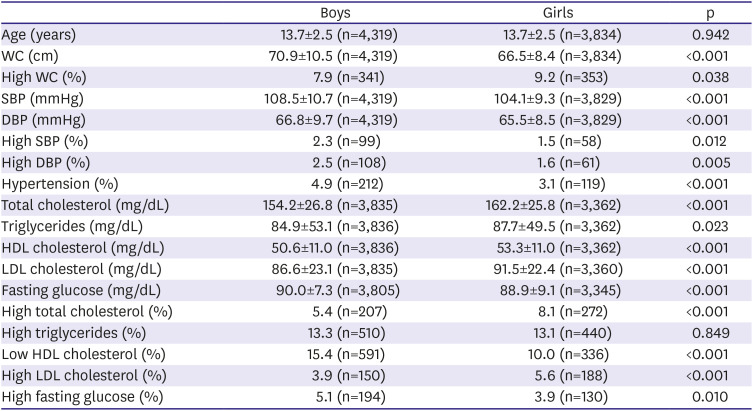
Table 1
Comparison of age adjusted means of WC, lipid profiles, fasting glucose, and age- and height-adjusted means of blood pressure between boys and girls
Data are expressed as mean±standard error.
High WC was defined as ≥90th percentile for age- and gender-specific values.
DBP = diastolic blood pressure; HDL = high-density lipoprotein; LDL = low-density lipoprotein; n = number of participants evaluated; SBP = systolic blood pressure; WC = waist circumference.
![]()
WC was higher in boys than in girls, however, girls showed a higher prevalence of sex- and age-specific high WC than boys. SBP, DBP, and fasting glucose were higher, but total cholesterol, triglycerides, HDL cholesterol, and LDL cholesterol were lower in boys than in girls. Boys exhibited a higher prevalence of high SBP, DBP, and hypertension and a lower prevalence of high total cholesterol and high LDL cholesterol than girls. Boys also had a higher prevalence of low HDL cholesterol and high fasting glucose than girls.
Relationship between waist circumference and cardiovascular risk factors
Table 2 shows the association between WC z-score and BP adjusted for age and height, and lipid profile and fasting glucose adjusted for age.
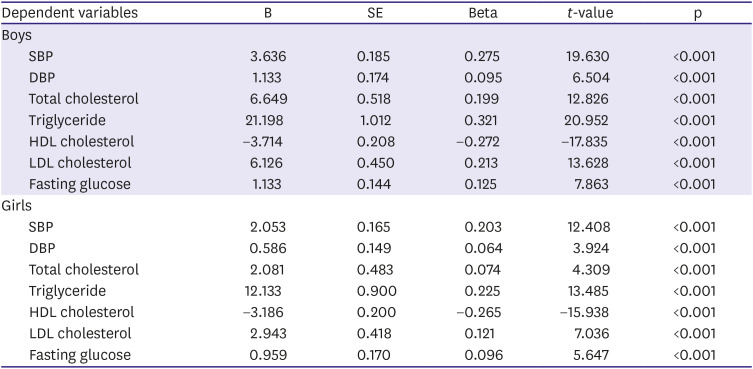
Table 2
The association between waist circumference z-score and blood pressure adjusted for age and height, and lipid profile and fasting glucose adjusted for age
B = unstandardized coefficients; Beta = standardized coefficients; DBP = diastolic blood pressure; HDL = high-density lipoprotein; LDL = low-density lipoprotein; SBP = systolic blood pressure; SE = standard error.
![]()
WC z-score have significantly association with BP adjusted for age and height, and lipid profile and fasting glucose adjusted for age in both boys and girls.
We compared age- and height-adjusted means of BP and age adjusted means of lipid profiles and fasting glucose between normal and high WC groups in boys and girls (Table 3).
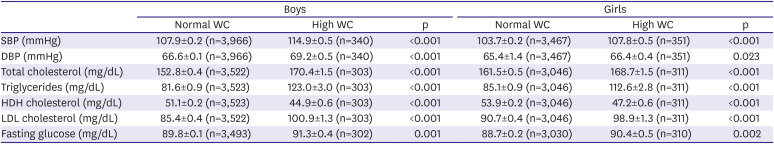
Table 3
Comparison of age- and height-adjusted means of blood pressure and age-adjusted means of lipid profiles and fasting glucose between normal and high WC groups
Data are expressed as mean±standard error. High WC was defined as ≥90th percentile for age- and gender-specific values.
DBP = diastolic blood pressure; HDL = high-density lipoprotein; LDL = low-density lipoprotein; n = number of participants evaluated; SBP = systolic blood pressure; WC = waist circumference.
![]()
Boys and girls with high WC had higher mean age- and height-adjusted-SBP and -DBP than groups with normal WC. In addition, total cholesterol, triglycerides, LDL cholesterol, and fasting glucose showed significantly greater age-adjusted means in the high WC groups than in the normal WC groups. On the other hand, HDL cholesterol in high WC groups was lower than in normal WC groups.
Figure 1 shows an analysis of the age standardized OR of hypertension, dyslipidemia and high fasting glucose for high WC group.
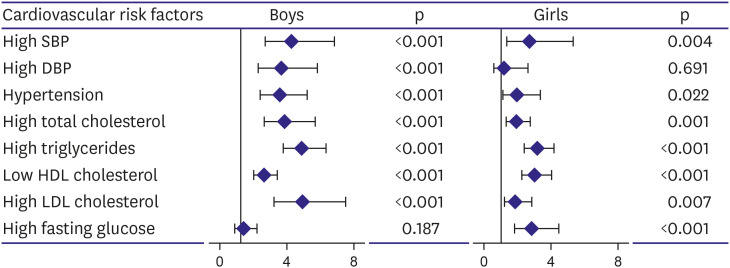
High WC was associated with an increased risk of high SBP, hypertension, high total cholesterol, high triglycerides, high LDL cholesterol, and low HDL cholesterol in both sexes. There was an increased risk of high DBP only in boys with high WC. Girls with high WC had a higher risk of high fasting glucose than girls with normal WC, but there was no significant difference in high fasting glucose between normal and high WC boys.
Correlations of waist circumference with cardiovascular diseases risk factors in the age subgroups
Figure 2 shows the differences in the OR of hypertension, dyslipidemia and high fasting glucose according to different age subgroups.
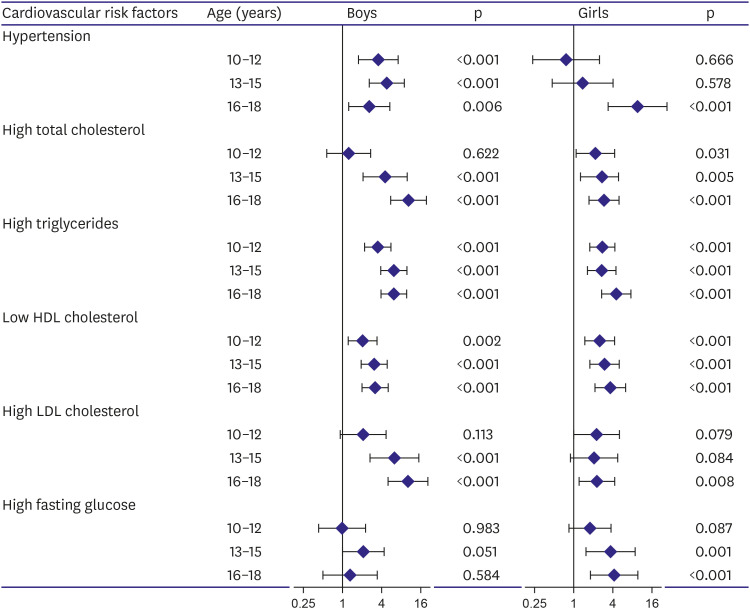
In boys, the association of high WC with hypertension, high triglycerides, and low HDL cholesterol appeared in early, middle, and late adolescences (10–12 years). High WC was shown to be associated with high total cholesterol and high LDL cholesterol in middle and late adolescences (13–15 years). There was no association between high WC and high fasting glucose. In girls, high WC appeared to correlate with high total cholesterol, high triglycerides, and low HDL cholesterol in early, middle, and late adolescences (10–12 years). High WC was shown to be associated with hyperglycemia in middle and late adolescences (13–15 years). The relationship between high WC and hypertension and high LDL cholesterol was seen in late adolescence (16–18 years).
Go to :
DISCUSSION
A recent meta-analysis of over 300,000 adults of both genders and varied ethnicities concluded that the WC to height and WC were better screening tools for cardiometabolic risk factors than BMI.19) The WC has also been proposed as an alternate measure, with performance at least comparable to BMI.20)21) Recently published results from the Bogalusa Heart Study indicated that when WC was considered with BMI, children and adolescents with a high WC were more likely to have elevated CVD risk factors than were those with a lower WC, within a given BMI category.22) Some prospective pediatric series have also confirmed the prognostic value of WC at childhood as a predictor of future CVD risk-factor clustering.23) Although some studies have shown that the waist to height ratio is associated with CVR factors such as hypertension, WC is generally used as an indicator of obesity.9)19)20) In addition, WC percentile was used in the diagnostic criteria of pediatric metabolic syndrome.11) So in this study, We used WC percentile instead of waist to height ratio.
In the present study, boys and girls with high WC had higher SBP and DBP, and had a higher incidence and risk of hypertension than the normal WC groups. Similarly, the association between elevated BP and WC has been documented among children in several previous studies. Perichart-Perera et al.24) reported that a higher risk of hypertension was observed in school-aged Mexican children with a WC ≥90th percentile. Savva et al.25) showed that subjects with a WC ≥75th percentile had an increased OR of SBP ≥125 mmHg (7.1 in boys, 2.7 in girls) in children of Greek-Cypriot origin. In Australia, Bell et al.26) showed an increase in DBP- and SBP z-score in children of both sexes with a WC >85th percentile. To the best of our knowledge, this study is the first report to show when the association between hypertension and high WC appears. In the present study, boys with a high WC have been associated with an increased risk of hypertension in early, middle, late adolescences, while the association between high WC and hypertension has been seen in late adolescence in girls, suggesting that the correlation between high WC and hypertension appears earlier in boys than in girls.
Flodmark and colleagues27) showed that WC correlates to a potentially atherogenic lipoprotein profile in obese 12–14 year-old children. Freedman's team analyzed data on approximately 3,000 children and adolescents 5–17 years of age from the Bogalusa Heart Study and concluded that WC measurement may help to identify children likely to have elevated concentrations of lipids.28) In our study, adolescents with a high WC had an increased risk of dyslipidemia, however, this association appeared differently according to gender and lipid profile variability; In boys, high WC was associated with increased risk of high triglyceride and low HDL cholesterol in early, middle, late adolescences and was associated with an increased risk of high total cholesterol and high LDL cholesterol in middle, late adolescences. In girls, the risks of high total cholesterol, high triglycerides, and low HDL cholesterol were seen to increased by high WC in early, middle, late adolescences and the association between high WC and high LDL cholesterol was seen in late adolescence.
Hirschler et al.29) suggested the use of WC to predict insulin resistance. Freedman et al.28) showed that WC measurement may help to identify children likely to have unfavorable concentrations of insulin. Furthermore, Rodríguez-Rodríguez et al.30) studied the association between different anthropometric parameters and insulin resistance in Spanish schoolchildren (9–11 years of age) and showed that the children with a WC >90th percentile for their age and sex were at greater risk of showing insulin resistance (OR, 6.94). In the present study, high fasting glucose in girls with a high WC was seen to be relevant in middle, late adolescences but there was no correlation between high WC and high fasting glucose in boys. Accordingly, hyperglycemia is not associated with a high WC in boys.
The findings in the present study showed that a high WC in adolescents had a negative effect on all CVR factors and this effect was seen to appear in as early as 10–12 years in some CVR variables. These findings suggest a need for the early identification of abnormal WC. Therefore, pediatricians may use routine WC assessment as a practical tool to identify adolescents at greater risk of CVD. Because of the high yield of high WC as a screen among adolescents, it may be useful to more closely monitor this group of adolescents for the development of CVR. In the present study, the association between a high WC and CVR was shown to appear at different ages according to sex and CVR factors. The management of central obesity in childhood is both important and recommended; however, intensive therapies, such as medically supervised meal replacement, pharmacologic treatment, and bariatric surgery, are often costly. In addition, resources are too limited to appropriately manage every child with central obesity since most clinics and programs are concentrated within tertiary-care pediatric hospitals. Therefore, identifying the age at which a high WC appears to be associated with a particular CVR factor may allow focused and targeted interventions that may be more cost-effective. When analyzing the correlation between BMI and CVR factors, BMI also had similar degree of association with CVR factors to that WC had (the results were not presented here). Thereafter, BMI also could be an important indicator for CVR factors in children and adolescents.
We studied CVR variables in a large and nationally representative population; however, our study has certain limitations. First, because this is a cross-sectional study, we were not able to show the cause-and-effect relationship between WC and CVR factors, and correlations over time. Second, although we used standard definitions of abnormal values for CVR variables, we did not examine the effects of these abnormal values on future morbidity or mortality through the cross-sectional design. Third, because this study included adolescents 10 to 18 years of age, there is no data available on children less than 10 years of age. Therefore, further research is required to find out how WC correlates with CVR factors in children less than 10 years of age.
In summary, this study demonstrated that a high WC in adolescents was associated with increased CVR factors. This association was seen at different times according to sex and CVR factors. In boys, the association of high WC with hypertension, high triglycerides, and low HDL cholesterol appeared in early, middle, and late adolescence. A high WC has been shown to be associated with high total cholesterol and high LDL cholesterol in middle, late adolescence. There was no association between a high WC and hyperglycemia. In girls, a high WC has been shown to correlate with high total cholesterol, high triglycerides, and low HDL cholesterol in early, middle, and late adolescence. A high WC has been shown to be associated with hyperglycemia in middle, late adolescence. The relationship between high WC and hypertension and high LDL cholesterol appeared in late adolescence.
Go to :
 XML Download