

 PDF
PDF Citation
 Print
Print


INTRODUCTION
Non-alcoholic fatty liver disease (NAFLD) is the most common chronic liver disease. Its estimated prevalence is about 15–30% in the general population. However, the prevalence of NAFLD is higher in patients with obesity, insulin resistance and non-insulin dependent diabetes mellitus, and metabolic syndrome.1) About 60–70% of patients have NAFLD in obese or diabetic persons.2) NAFLD is one of a multisystem disease with increased morbidity and mortality.3) There are many pieces of evidence between NAFLD and established cardiovascular risk factors including abdominal obesity, dyslipidemia, insulin resistance, and high blood pressure.4) These cardiovascular risk factors also contribute to metabolic syndrome. Besides extrahepatic malignancies and liver-related complications are common causes of death in patients with NAFLD, cardiovascular disease is the most common cause of death.5) Estimation of cardiovascular disease risk in persons with NAFLD can allow having proper medical management and improving their long-term clinical outcomes.
Hypertension is the most common cardiovascular risk factor. In Korea, the age-standardized prevalence of hypertension is about 30% among adults more than 30 years old with the definition of hypertension as systolic blood pressure (SBP) ≥140mmHg or diastolic blood pressure (DBP) ≥90mmHg.6) With new definition suggested by the American College of Cardiology/American Heart Association/American Society of Hypertension, SBP ≥130mmHg or DBP ≥ 80mmHg,7) the age-adjusted prevalence of hypertension was about 46.0% among US adults over 20 years of age in 2013 to 2016.8) Because hypertension is a major component of the metabolic syndrome which strongly linked to NAFLD, the coexistence of NAFLD and hypertension can be common.9) Although several studies showing the co-existence of NAFLD and hypertension, they showed a simple association in several cross-sectional studies. Moreover, the longitudinal studies showing the development of hypertension in patients with NAFLD have limitations of modest sample sizes and relatively short follow-up duration. Thus, we analyzed a large cohort consisting of a healthy Korean adult population without known traditional cardiovascular risk factors and co-morbidities to identify the direct association of fatty liver index (FLI), as a good marker of NAFLD, and new-onset hypertension.
METHODS
Data sources
We analyzed data set from the National Health Insurance Service-National Sample Cohort 2.0 (NHIS-NSC 2.0) which is the population-based cohort data of Korea. The NHIS-NSC 2.0 included about 2% of the total Korean population in 2006 with retrospective and prospective follow-up data from 2002 to 2015.10) Korean government stratified total population (n=48,222,537) into 2,142 classes according to their age, sex, area, eligibility status, and income level. Then, the Korean government randomly selected 2.1% of them from each stratum (n=1,021,208). Because the National Health Insurance covers about 97% of the total population of Korea, the NHIS-NSC 2.0 cohort can represent the entire Korean population. The cohort includes 4 databases: the dataset of the sociodemographic information of the population; dataset of medical claims including information on the diagnosis based on the 10th revision of the International Classification of Disease (ICD-10) codes, admission, and treatment; dataset of the National Health Screening of the cohort members; and dataset of the medical institutions. Korean government recommends the entire Korean adults to receive the National Health check-up biennially, which are composed of questionnaires on medical history, chest X-ray, physical examinations and blood tests. Health-related behaviors were collected by using standardized self-reporting questionnaires such as smoking status and alcohol consumption. A total of 72.1% of eligible population received National Health check-ups according to the 2013 National Health Insurance Service (NHIS) statistics.10) The cohort also includes mortality data from the death registration database of Statistics Korea, a central government organization for statistics.
The NHIS-NSC 2.0 is open to any researchers if the NHIS review committee approves the protocol. The Institutional Review Board (IRB) of the Chungnam National University Hospital approved this study (IRB No. 2019-10-083) and waived the requirement for informed consent.
Study population
This study included adults (≥20 years old) with National Health check-ups more than one time from 2009 to 2014. We set the first check-up as the index check-up and the year of the index check-up as the index year. We excluded all subjects who had the pre-specified exclusion criteria; 1) those who diagnosed with hypertension before the index year, 2) those who with rheumatic or non-rheumatic valvular heart diseases, 3) those who diagnosed with arrhythmia, heart failure, diabetes, cerebrovascular disease, ischemic heart disease, liver disease, or peripheral artery disease, 4) those who with increased baseline SBP ≥140mmHg or DBP ≥90mmHg, and fasting blood glucose ≥126mg/dL at the index check-up, 5) those who with missing data in the index check-up. We assessed each diagnosis based on the 1-year claim data before the index year. When we used the claims data, we defined each diagnosis as the first occurrence during at least two different days of hospital visits (outpatient) or on the first admission, as a likely diagnosis of hypertension. We used the ICD-10 codes to define each diagnosis.
Definition of data
We calculated body mass index (BMI) from body weight (kg) and height (m). The definition of obesity was done with a BMI of ≥25 kg/m2 by following the World Health Organization guideline for the Asian population.13) The survey evaluated alcohol consumption using standardized self-reporting questionnaires. They categorized smoking status into 3 categories: non-smoker, ex-smoker, and current smoker.
The primary outcome of this study was finding the incidence of hypertension. We defined the hypertension incidence as the first occurrence during at least 2 different days of hospital visits, admission for hypertension, or death with a diagnosis of hypertension. Data were censored at the time of hypertension occurrence, disqualification of the NHIS (death or immigration), or the end of the study (December 31th, 2015).
Calculation of fatty liver index
We used FLI, a well-validated surrogate marker of NAFLD,11) which was calculated with 4 variables (triglycerides [TG], BMI, gamma-glutamyl transferase [GGT], and waist circumference [WC]) with the following equation:
FLI = (e0.953×loge
[TG] + 0.139×BMI + 0.718×loge
[GGT] + 0.053×WC − 15.745)/(1 + e0.953×loge
[TG] + 0.139×BMI + 0.718×loge
[GGT] + 0.053×WC − 15.745)×100
The original study showed that the FLI more than 60 as the cutoff for the diagnosis of fatty liver disease with a positive likelihood ratio of 4.3. Although the FLI is simple to obtain and screen fatty liver disease, there has been insufficient evidence regarding the diagnosis of fatty liver disease in Asians with the FLI because of lower BMI and WC than other ethnic populations.12) We categorized our study population into quartile groups according to their FLI value.
Statistical analysis
We presented continuous variables as mean±standard deviation and categorical parameters as a number with a percentage. All statistical analyses were performed with R software version 3.3.3 (R Foundation for Statistical Computing, Vienna, Austria; www.r-project.org). We used chi-square test and one-way analysis of variance tests to check statistical differences among the FLI quartiles. The comparison of cumulative event rates according to the FLI quartiles was done with the Kaplan-Meier method and log-rank test. Adjusted hazard ratios (HRs) and 95% confidence interval (CI) for hypertension incidence were estimated with Cox proportional hazard regression analysis. In the multivariate analysis, we adjusted age and sex in the model 1, and clinical characteristics associated with new-onset hypertension of borderline statistical significance (p<0.100) along with age and sex in the model 2. The p values of <0.05 were considered statistically significant.
RESULTS
Baseline characteristics of the participants
Out of the total population of the NHIS-NSC 2.0 cohort, we analyzed 334,280 subjects after the exclusion of the subjects who met with the pre-specified exclusion criteria. Figure 1 depicted the number of subjects matching each exclusion criterion. We divided our study population into 4 groups according to the FLI quartile values; Q1, 0–4.9; Q2, 5.0–12.5; Q3, 12.6–31.0; and Q4, >31.0. Table 1 compared baseline clinical characteristics according to the FLI quartiles. The subjects with higher FLI had a trend to higher age and higher incidence of males. BMI, WC, blood pressures, the amount of alcohol consumption and the proportion of current smokers tended to increase from Q1 to Q4. Fasting glucose, total cholesterol, triglyceride, and low-density lipoprotein (LDL) cholesterol were increasing along with the increase of FLI quartiles.
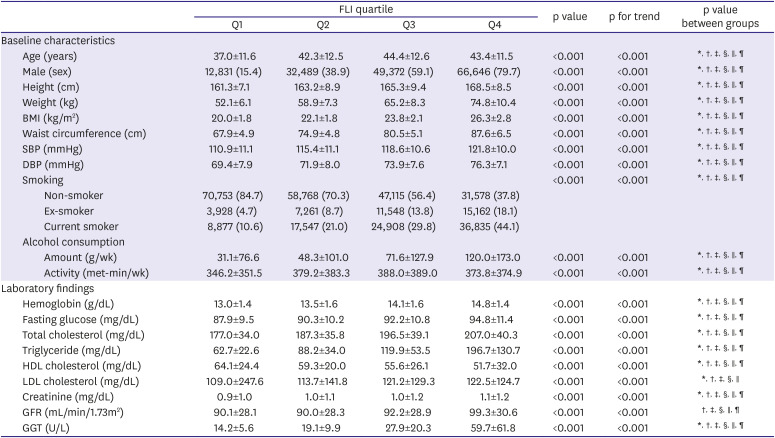
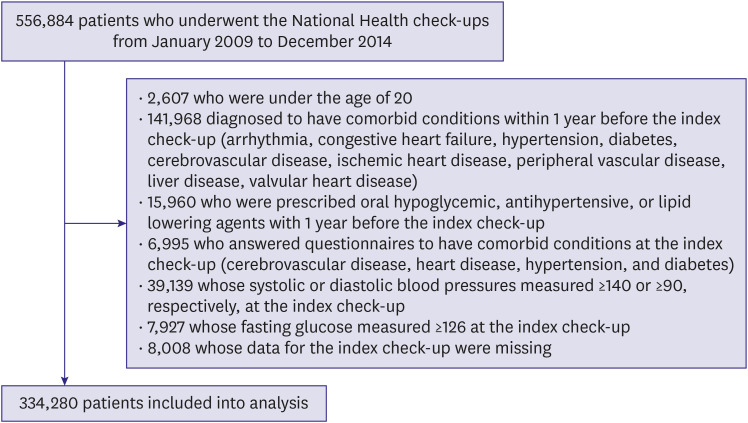
Table 1
Baseline characteristics and laboratory findings according to FLI quartiles
Data are shown as mean±standard deviation or number (%).
BMI = body mass index; DBP = diastolic blood pressure; FLI = fatty liver index; GFR = glomerular filtration rate; GGT = gamma-glutamyl transferase; HDL = high-density lipoprotein; LDL = low-density lipoprotein; SBP = systolic blood pressure.
*p value less than <0.05 between Q1 and Q2; †p value less than <0.05 between Q1 and Q3; ‡p value less than <0.05 between Q1 and Q4; §p value less than <0.05 between Q2 and Q3; ∥p value less than <0.05 between Q2 and Q4; ¶p value less than <0.05 between Q3 and Q4.
![]()
Association between fatty liver index and the incidence of hypertension
During the total follow-up duration of a median of 5.2 years (interquartile range, 3.5–6.3), 24,678 subjects (7.4%) had new-onset hypertension. Table 2 shows the result of the univariate analysis of new-onset hypertension. The incidence of new-onset hypertension was higher in the group with male gender, older age, higher BMI, higher atherogenic cholesterol profiles. Figure 2 demonstrates the cumulative incidences of new-onset hypertension according to the FLI quartiles. The incidence of hypertension was significantly higher in subjects with higher FLIs, compared to those with lower FLIs (Q1, 2,277 [2.7%]; Q2, 4,858 [5.8%]; Q3, 7,575 [9.1%]; and Q4, 9,968 [11.9%]). In multivariate models that were adjusted for age and sex in model 1 and clinical characteristics with borderline statistical significance in model 2, the association between FLI quartile and hypertension incidence remained statistically significant (Table 3). Instead of FLI quartiles, the continuous value of FLI was also statistically significant in the multivariate analysis model 1 and 2. When we used various cutoff-points were tried to categorize the study population, which were suggested by the previous studies (0≤FLI<30, 30≤FLI<60, and FLI≥60, by Bedogni et al.11); 0≤FLI<25, 25≤FLI<35, and FLI≥35 for male, 0≤FLI<10, 10≤FLI<20, and FLI≥20 for female, by Yang et al.13)). Regardless of the cutoff-points used, groups with the highest FLI were observed to be at the highest risk for new-onset hypertension (Supplementary Table 1).
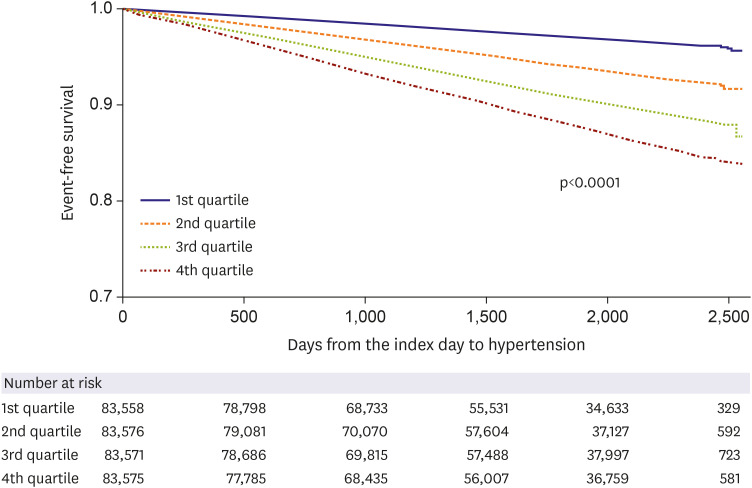
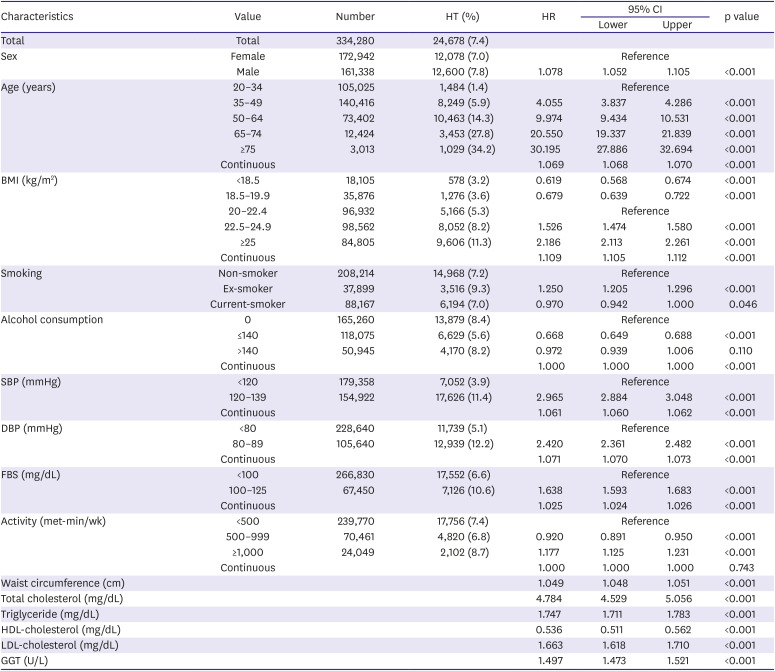
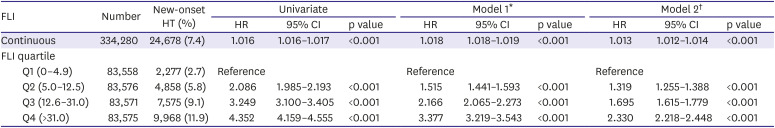
Figure 2
Cumulative incidence of new-onset hypertension according to their quartiles. Statistical significance was determined using the log-rank test.
![]()
Table 2
Univariate analysis of new-onset hypertension
BMI = body mass index; CI = confidence interval; DBP = diastolic blood pressure; FBS = fasting blood glucose; GGT = gamma-glutamyl transferase; HDL = high-density lipoprotein; HR = hazard ratio; HT = hypertension; LDL = low-density lipoprotein; SBP = systolic blood pressure.
![]()
Table 3
Association between FLI and new-onset HT
CI = confidential interval; FLI = fatty liver index; HR hazard ratio; HT = hypertension.
*Cox proportional hazard models including age, and sex as covariates; †Cox proportional hazard models including age, sex, smoking, drinking, activity, systolic and diastolic blood pressure, fasting blood glucose, and cholesterol.
![]()
According to the change of FLI after 2 years, more than 20% increase of FLI than the baseline had increased risk of new-onset hypertension in Q1 and Q2 (Q1: HR, 1.175; 95% CI, 1.052–1.312; p=0.004 and Q2: HR, 1.113; 95% CI, 1.033–1.200; p=0.005; Table 4). In Q3 and Q4, the decrease of FLI more than 20% had decreased risk of new-onset hypertension (Q3: HR, 0.874; 95% CI, 0.819–0.933; p<0.001 and Q4: HR, 0.871; 95% CI, 0.871–0.977; p=0.006; Table 4). The increase of FLI was associated with increased risk of new-onset hypertension in all quartiles.
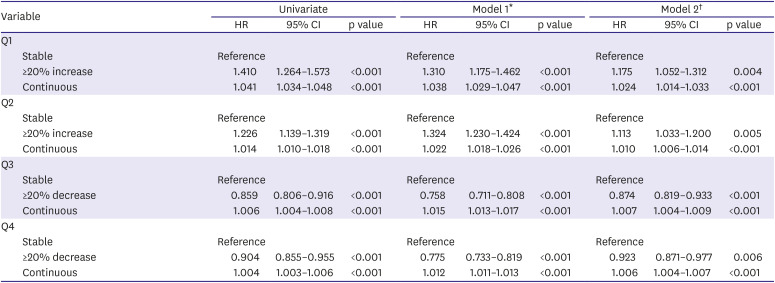
Table 4
Association between the change of fatty liver index after 2 years and new-onset hypertension
CI = confidential interval; HR = hazard ratio.
*Cox proportional hazard models including age, and sex as covariates; †Cox proportional hazard models including age, sex, drinking, activity, systolic and diastolic blood pressure, fasting blood glucose, and cholesterol.
![]()
DISCUSSION
In this study, higher FLI, not the presence of fatty liver disease, was associated independently with an increased risk for new-onset hypertension. Moreover, the increase of FLI after 2 years was associated with an increased risk of new-onset hypertension.
Several studies proved the association between NAFLD and hypertension. Donati et al.14) reported the higher prevalence of NAFLD in 55 non-obese, non-diabetic, non-alcohol drinking hypertensive patients compared with healthy subjects. In their study, hypertensive patients had significantly higher insulin resistance and higher BMI along with increased prevalence of NAFLD by ultrasonography. Aneni et al.15) showed the statistically significant association of BP with the presence and severity of NAFLD by ultrasonography in 5,362 healthy middle-aged Brazilian cohorts. Wang et al.16) presented that the increased prevalence of NAFLD by transient elastography in 836 Chinese who underwent health check-ups. However, these cross-sectional studies show no causal relationship between hypertension and NAFLD, but only simple association.
There have been a few longitudinal studies which evaluated the association between NAFLD and new-onset hypertension.9) Sung et al.17) reported that developing incident fatty liver was associated with incident hypertension during 5 years in the multivariate analysis (adjusted odds ratio [OR], 1.60; 95% CI, 1.10–1.67; p<0.001) in a retrospective cohort including 11,448 patients. They also showed the resolution of the fatty liver at the follow-up, the risk of incident hypertension was similar to the reference group (adjusted OR, 1.21; 95% CI, 0.90–1.63; p=0.21). NAFLD assessed by ultrasonography was prospectively associated with new-onset hypertension in a large cohort of 22,090 Korean men.9) In their study, mild NAFLD (HR, 1.07; 95% CI, 1.00–1.15) and moderate to severe NAFLD (HR, 1.14; 95% CI, 1.00–1.30) had a significantly higher incidence of hypertension during 5 years of the follow-up. Another study by Huh et al.18) revealed increased FLI was significantly associated with higher incidence of hypertension (HRs in FLI <30 vs. 30–59 vs. ≥60 = 1 vs. 1.83 [95% CI, 1.16–2.88] vs. 2.09 [95% CI, 1.08–4.06], respectively) in a prospective cohort including 1,521 adults with an average of 2.6 years of follow-up. If we used similar criteria of FLI, our result was like the study (HRs in FLI <30 vs. 30–59 vs. ≥60 = 1 vs. 1.458 [95% CI, 1.414–1.503] vs. 1.980 [95% CI, 1.902–2.060], respectively, Supplementary Table 1). In this study, we showed increase of FLI at the follow-up visit, along with increased FLI at the baseline, was associated with increased risk of new-onset hypertension.
Several proposed mechanisms could explain the link between NAFLD and hypertension. The first mechanism is insulin resistance. Although the role of insulin resistance in the development of hypertension has not been fully evaluated, there is clinical evidence suggesting a strong association between 2 comorbidities.19) In our study, higher fasting glucose concentration was a statistically significant determinant of new-onset hypertension in the univariate analysis. Insulin resistance may contribute to the development of hypertension through increased activation of the sympathetic nervous system and renal sodium retention.20) Increased sympathetic nervous system can also increase hepatic fibrosis through the fibrogenic effects of sympathetic nervous system neurotransmitters on hepatic stellate cells.21)
The second mechanism is activated renin-angiotensin-aldosterone system (RAAS). RASS and increased angiotensin II are important mechanisms of hypertension. Also, angiotensin II can be expressed by activated human hepatic stellate cells.22) There are pieces of evidences increased local RAAS in chronic liver diseases, and activated local RAAS promote liver injury and fibrosis through angiotensin II-mediated stimulation of fibroblast proliferation and release of inflammatory cytokines.23) In fatty liver animal models, use of RAAS inhibitors led to attenuation of the fatty liver progression.24) The third one is endothelial dysfunction which is considered to increase arterial stiffness through increased vascular tone, sympathetic overactivity, vascular remodeling and sodium retention.25) Several hepatokines, liver-derived proteins, can affect the progression of atherosclerosis by inducing endothelial dysfunction,26) and increased arterial stiffening may lead to increased pulse pressure and arterial hypertension in NAFLD patients.27) Other proposed mechanisms include increased inflammatory markers in NAFLD.28) Impaired fatty acid oxidation, increased oxidative stress, and local inflammation can be associated with excessive accumulation of triglyceride in hepatocytes. Also, they can promote a transition from simple steatosis to steatohepatitis.29)
Our study has several limitations. First, we used administrative data to identify patients with new-onset hypertension. Because these data relied on ICD-10 codes, there can be a certain number of subjects with misdiagnosis and misclassification of hypertension. Second, we did use variables in the check-up and did not adjust for other variables that need additional costs or examinations. Third, we cannot establish a causal relationship between NAFLD and increased incidence of hypertension because this study is an observational study. Finally, our study population included only Koreans. Thus, this result may have limitations in the generalization to other ethnic populations.
In conclusions, our findings demonstrated that increased FLI was independently associated with increased risk for hypertension in a healthy Korean population. Because management of hypertension along with control of metabolic syndrome remains a major step in the reduction of cardiovascular morbidity and mortality, the identification of increased hypertension risk may have important public health implications. Further studies are needed to document the effect of management of NAFLD not only on the risk of new-onset hypertension but also on the reduction of cardiovascular morbidity and mortality.
 XML Download