

 PDF
PDF Citation
 Print
Print


INTRODUCTION
Excessive sodium intake has been shown to have major impacts on blood pressure (BP) and the risk of cardiovascular (CV) disease,1)2) and to increase the risk of stroke,3) left ventricular hypertrophy,4) the progression of renal disease,5) renal stones and osteoporosis6) and possibly the risk of stomach cancer.7) Accordingly, the World Health Organization (WHO) and many countries are making efforts to reduce sodium intakes.
Nevertheless, some scientists argue reducing sodium intake to or below the recommended level is dangerous,8)9) and that there is no clear evidence that sodium intake reduction decreases the incidence of CV diseases.10) However, these studies have methodologic limitations that warrant consideration.
In this article, we review recent publications on the assessment of salt intake and on the associations between high sodium intake and BP and the risk of CV diseases.
Go to : 
MEASUREMENT OF SALT INTAKE
Sodium intake is usually measured using a dietary survey-based or urine collection methods. Dietary survey-based methods rely on food intakes determined by questionnaire or interview, and subsequently, nutrient intakes are calculated using food composition tables. Dietary surveys are commonly used in large population surveys because they are convenient and readily applicable. However, they may result in inaccurate estimations of dietary sodium intake because of their inherent limitations, such as reporting errors, inaccurate or incomplete food composition tables, missing data, and coding errors.11)12)13) In addition, the use of dietary surveys makes it difficult to compare sodium intakes between countries, studies, and surveys because of the different dietary survey methods and food composition tables used.
Therefore, measurement of 24-hour urine sodium is recommended as a gold standard method of sodium intake estimation because of its accuracy and consistency. However, multiple 24-hour urine collection is needed to obtain accurate results because of large day-to-day variations in sodium intakes.14) In a recent study, the means of three to seven 24-hour urinary sodium measurements during the study periods showed a linear association with mortality, but baseline 24-hour urinary sodium showed no relationship with mortality.15) These findings indicate multiple subsequent 24-hour urine collection should be used to assess the risk of future CV events rather that single baseline 24-hour urine sodium. However, many studies have used single or double 24-hour urine collection because multiple collection of 24-hour urine without any loss of urine in population survey is much difficult.
Because 24-hour urine collection requires skills and resources in large scaled population health survey, considerable efforts have been made to use spot urine in the estimation of sodium intake, and WHO recommend the use of spot urine to estimate sodium intake in low and middle income countries.16) Furthermore, the latest Prospective Urban Rural Epidemiology (PURE) study, which challenged the need to reduce sodium intake to or below the recommended level, used a spot urine collection method to estimate sodium intake.8)9) Many formulae have been developed and are widely used for the estimation of sodium intake, but despite its convenience and low cost, the calculation of 24-hour urine sodium based on spot urine should be considered with caution because of inaccuracy.
To explore the validity of the spot urine method, we performed a systematic review of published studies. The electronic database of PubMed from publication date of January 2014 to September 2019 was searched using applicable terms (search terms in Appendix 1). The inclusion criteria used were as follows: human, sodium intake measured by 24-hour urine collection (single or multiple), sodium intake calculated by single or multiple spot urine collection, and comparison between measured and calculated urine sodium level. Potentially eligible articles were identified, and full texts were then reviewed. Eighteen eligible studies were identified (Table 1).17)18)19)20)21)22)23)24)25)26)27)28)29)30)31)32)33)34)
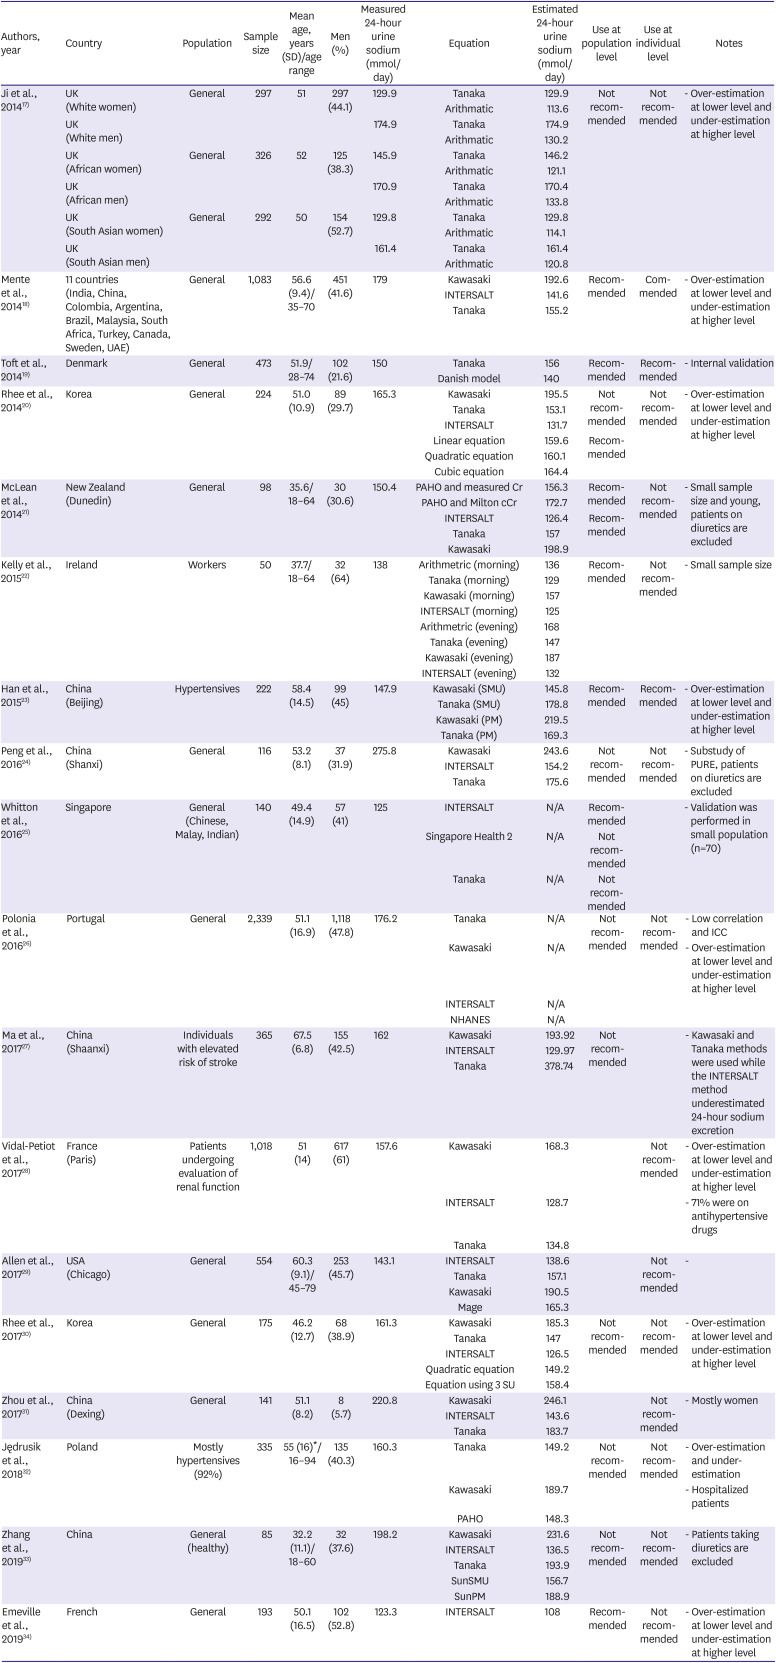
Table 1
Studies that evaluated the validity of spot urine collection method for the estimation of sodium intake
| Authors, year | Country | Population | Sample size | Mean age, years (SD)/age range | Men (%) | Measured 24-hour urine sodium (mmol/day) | Equation | Estimated 24-hour urine sodium (mmol/day) | Use at population level | Use at individual level | Notes |
|---|---|---|---|---|---|---|---|---|---|---|---|
| Ji et al., 201417) | UK (White women) | General | 297 | 51 | 297 (44.1) | 129.9 | Tanaka | 129.9 | Not recommended | Not recommended | - Over-estimation at lower level and under-estimation at higher level |
| Arithmatic | 113.6 | ||||||||||
| UK (White men) | 174.9 | Tanaka | 174.9 | ||||||||
| Arithmatic | 130.2 | ||||||||||
| UK (African women) | General | 326 | 52 | 125 (38.3) | 145.9 | Tanaka | 146.2 | ||||
| Arithmatic | 121.1 | ||||||||||
| UK (African men) | 170.9 | Tanaka | 170.4 | ||||||||
| Arithmatic | 133.8 | ||||||||||
| UK (South Asian women) | General | 292 | 50 | 154 (52.7) | 129.8 | Tanaka | 129.8 | ||||
| Arithmatic | 114.1 | ||||||||||
| UK (South Asian men) | 161.4 | Tanaka | 161.4 | ||||||||
| Arithmatic | 120.8 | ||||||||||
| Mente et al., 201418) | 11 countries (India, China, Colombia, Argentina, Brazil, Malaysia, South Africa, Turkey, Canada, Sweden, UAE) | General | 1,083 | 56.6 (9.4)/35–70 | 451 (41.6) | 179 | Kawasaki | 192.6 | Recommended | Commended | - Over-estimation at lower level and under-estimation at higher level |
| INTERSALT | 141.6 | ||||||||||
| Tanaka | 155.2 | ||||||||||
| Toft et al., 201419) | Denmark | General | 473 | 51.9/28–74 | 102 (21.6) | 150 | Tanaka | 156 | Recommended | Recommended | - Internal validation |
| Danish model | 140 | ||||||||||
| Rhee et al., 201420) | Korea | General | 224 | 51.0 (10.9) | 89 (29.7) | 165.3 | Kawasaki | 195.5 | Not recommended | Not recommended | - Over-estimation at lower level and under-estimation at higher level |
| Tanaka | 153.1 | ||||||||||
| INTERSALT | 131.7 | ||||||||||
| Linear equation | 159.6 | Recommended | |||||||||
| Quadratic equation | 160.1 | ||||||||||
| Cubic equation | 164.4 | ||||||||||
| McLean et al., 201421) | New Zealand (Dunedin) | General | 98 | 35.6/18–64 | 30 (30.6) | 150.4 | PAHO and measured Cr | 156.3 | Recommended | Not recommended | - Small sample size and young, patients on diuretics are excluded |
| PAHO and Milton cCr | 172.7 | ||||||||||
| INTERSALT | 126.4 | Recommended | |||||||||
| Tanaka | 157 | ||||||||||
| Kawasaki | 198.9 | ||||||||||
| Kelly et al., 201522) | Ireland | Workers | 50 | 37.7/18–64 | 32 (64) | 138 | Arithmetric (morning) | 136 | Recommended | Not recommended | - Small sample size |
| Tanaka (morning) | 129 | ||||||||||
| Kawasaki (morning) | 157 | ||||||||||
| INTERSALT (morning) | 125 | ||||||||||
| Arithmetric (evening) | 168 | ||||||||||
| Tanaka (evening) | 147 | ||||||||||
| Kawasaki (evening) | 187 | ||||||||||
| INTERSALT (evening) | 132 | ||||||||||
| Han et al., 201523) | China (Beijing) | Hypertensives | 222 | 58.4 (14.5) | 99 (45) | 147.9 | Kawasaki (SMU) | 145.8 | Recommended | Recommended | - Over-estimation at lower level and under-estimation at higher level |
| Tanaka (SMU) | 178.8 | ||||||||||
| Kawasaki (PM) | 219.5 | ||||||||||
| Tanaka (PM) | 169.3 | ||||||||||
| Peng et al., 201624) | China (Shanxi) | General | 116 | 53.2 (8.1) | 37 (31.9) | 275.8 | Kawasaki | 243.6 | Not recommended | Not recommended | - Substudy of PURE, patients on diuretics are excluded |
| INTERSALT | 154.2 | ||||||||||
| Tanaka | 175.6 | ||||||||||
| Whitton et al., 201625) | Singapore | General (Chinese, Malay, Indian) | 140 | 49.4 (14.9) | 57 (41) | 125 | INTERSALT | N/A | Recommended | - Validation was performed in small population (n=70) | |
| Singapore Health 2 | N/A | Not recommended | |||||||||
| Tanaka | N/A | Not recommended | |||||||||
| Polonia et al., 201626) | Portugal | General | 2,339 | 51.1 (16.9) | 1,118 (47.8) | 176.2 | Tanaka | N/A | Not recommended | Not recommended | - Low correlation and ICC |
| Kawasaki | N/A | - Over-estimation at lower level and under-estimation at higher level | |||||||||
| INTERSALT | N/A | ||||||||||
| NHANES | N/A | ||||||||||
| Ma et al., 201727) | China (Shaanxi) | Individuals with elevated risk of stroke | 365 | 67.5 (6.8) | 155 (42.5) | 162 | Kawasaki | 193.92 | Not recommended | - Kawasaki and Tanaka methods were used while the INTERSALT method underestimated 24-hour sodium excretion | |
| INTERSALT | 129.97 | ||||||||||
| Tanaka | 378.74 | ||||||||||
| Vidal-Petiot et al., 201728) | France (Paris) | Patients undergoing evaluation of renal function | 1,018 | 51 (14) | 617 (61) | 157.6 | Kawasaki | 168.3 | Not recommended | - Over-estimation at lower level and under-estimation at higher level | |
| INTERSALT | 128.7 | - 71% were on antihypertensive drugs | |||||||||
| Tanaka | 134.8 | ||||||||||
| Allen et al., 201729) | USA (Chicago) | General | 554 | 60.3 (9.1)/45–79 | 253 (45.7) | 143.1 | INTERSALT | 138.6 | Not recommended | - | |
| Tanaka | 157.1 | ||||||||||
| Kawasaki | 190.5 | ||||||||||
| Mage | 165.3 | ||||||||||
| Rhee et al., 201730) | Korea | General | 175 | 46.2 (12.7) | 68 (38.9) | 161.3 | Kawasaki | 185.3 | Not recommended | Not recommended | - Over-estimation at lower level and under-estimation at higher level |
| Tanaka | 147 | ||||||||||
| INTERSALT | 126.5 | ||||||||||
| Quadratic equation | 149.2 | ||||||||||
| Equation using 3 SU | 158.4 | ||||||||||
| Zhou et al., 201731) | China (Dexing) | General | 141 | 51.1 (8.2) | 8 (5.7) | 220.8 | Kawasaki | 246.1 | Not recommended | - Mostly women | |
| INTERSALT | 143.6 | ||||||||||
| Tanaka | 183.7 | ||||||||||
| Jędrusik et al., 201832) | Poland | Mostly hypertensives (92%) | 335 | 55 (16)*/16–94 | 135 (40.3) | 160.3 | Tanaka | 149.2 | Not recommended | Not recommended | - Over-estimation and under-estimation |
| Kawasaki | 189.7 | - Hospitalized patients | |||||||||
| PAHO | 148.3 | ||||||||||
| Zhang et al., 201933) | China | General (healthy) | 85 | 32.2 (11.1)/18–60 | 32 (37.6) | 198.2 | Kawasaki | 231.6 | Not recommended | Not recommended | - Patients taking diuretics are excluded |
| INTERSALT | 136.5 | ||||||||||
| Tanaka | 193.9 | ||||||||||
| SunSMU | 156.7 | ||||||||||
| SunPM | 188.9 | ||||||||||
| Emeville et al., 201934) | French | General | 193 | 50.1 (16.5) | 102 (52.8) | 123.3 | INTERSALT | 108 | Recommended | Not recommended | - Over-estimation at lower level and under-estimation at higher level |
Cr = creatinine; ICC = intraclass correlation coefficient; INTERSALT = International Cooperative Study on Salt, Other Factors, and Blood Pressure; Milton = age- and sex-specific measured 24-hour creatinine excretion from 24-hour urine samples collected in the New Zealand Milton Study; N/A = not available; PAHO = Pan American Health Organization; PM = post meridiem; PURE = Prospective Urban Rural Epidemiology; SD = standard deviation; SMU = second morning urine; SU = spot urine.
*Age before exclusion.
![]()
Thirteen studies concluded that calculation result from spot urine could not be recommended in the estimation of 24-hour urine sodium estimation at an individual level because of tendencies of underestimation at high sodium intake and over-estimation at low sodium intake.17)20)21)22)24)26)28)29)30)31)32)33)34) Even the study of Mente et al.18) showed a tendencies to over-estimate at low sodium intake and under-estimate at high sodium intake although they did not comment about that finding. In terms of 24-hour urine sodium estimation at a population level, eight studies suggested the use of spot urine collection method for the estimation of sodium intake at the population level.18)19)20)21)22)23)25)34) However, the result of calculated sodium intake from spot urine may be inappropriate at the population level as the various formulae produced inconsistent bias between measured and estimated 24-hour urine. For example, the bias between measured and estimated 24-hour urine sodium (as determined using Kawasaki formula) ranged from −32.2 to 84.5 mmol/day. Even in the largest study conducted on this topic by Mente et al.,18) the bias between measured and estimated 24-hour urine sodium level (calculated using the Kawasaki formula) was not small (bias=13.6 mmol/day, 7.8% of average 24-hour urine sodium of study population).
Inaccurate estimation of 24-hour urine sodium level by formulae using spot urine sodium concentration may have inherent problem considering the method to develop formulae. Most of these formulas were developed using regression models in specific populations. Therefore, estimated 24-hour urine sodium values may depend on the mean of 24-hour urine sodium in the population used for formula development, and thus, calculated 24-hour urine sodium do not accurately reflect values in populations with different characteristics from the formula development population.
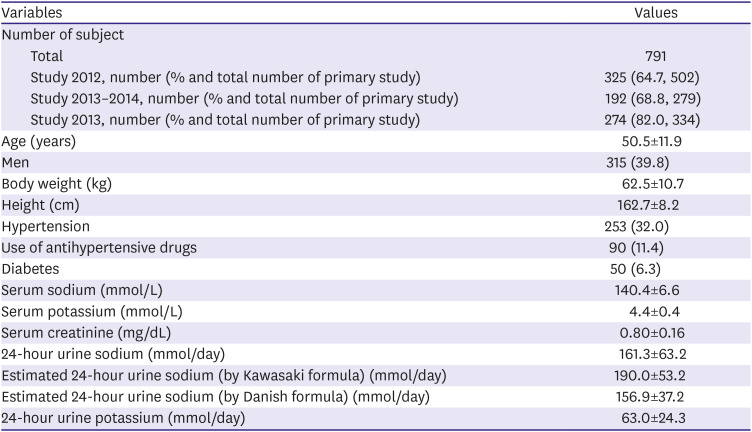
We evaluated this hypothesis. Populations of studies that were conducted in year 2012,20) 2014,30) and from 2013 to 201435) were combined and analyzed. The method to determine the completeness of 24-hour urine collection was described elsewhere.20)30)35) Among 1,115 participants, 791 had a valid 24-hour urine collection and spot urine sample (Table 2). Study population was divided by septiles of 24-hour urine sodium level. The means of measured 24-hour urine sodium and estimated 24-hour urine sodium (calculated using the Kawasaki and Danish formula) were compared (Figure 1). When the 24-hour urine sodium excretion is calculated by applying the formulas to groups with smaller 24-hour urine sodium excretion than that of formula development population, there is a tendency of overestimation of 24-hour urine sodium. On the other hands, in groups with greater 24-hour urine sodium than that of the development population, there is a tendency of underestimation of 24-hour urine sodium. This phenomenon has been observed in many studies that validated spot urine collection methods. Some studies that validated the Kawasaki formula showed if mean measured 24-hour urine sodium in the validation population was lower than that in the population used to develop Kawasaki formula (209 mmol/day), mean estimated 24-hour urine sodium in the validation population was higher than mean measured 24-hour urine sodium,.18)20)21)22)27)28)29)30)32)33) and conversely, if mean measured 24-hour urine sodium in the validation population was higher than that in development population, mean estimated 24-hour urine sodium in the validation population was lower than mean measured 24-hour urine sodium.24) However, many large studies are needed to verify our hypothesis and find method for accurate estimation of 24-hour urine from spot urine in a population level.
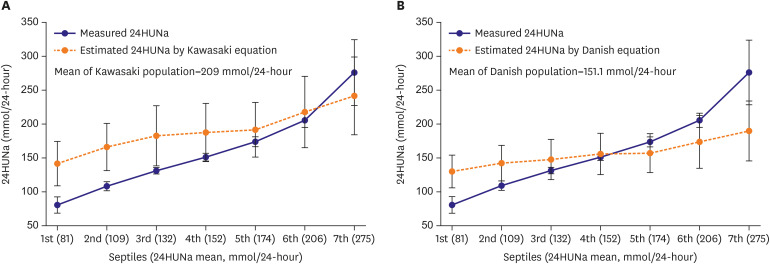 | Figure 1Comparison between measured and estimated 24HUNa in septile groups divided according to measured 24HUNa. Estimated 24-hour urine sodium was calculated by using previously suggested equations. (A) Kawasaki, and (B) Danish equation. When the 24HUNa is calculated by applying the formulas to groups with smaller 24HUNa than that of formula development population, there is a tendency of overestimation of population mean 24-hour urine sodium. On the other hands, in groups with greater 24-hour urine sodium than that of the formula development population, there is a tendency of underestimation of 24-hour urine sodium.24HUNa = 24-hour urine sodium excretion.
|
Table 2
Demographic and clinical characteristic of study population
Populations of study in 2012, 2013–2014 and 2014 were combined. Data are expressed as mean±standard deviation or number (%) not otherwise specified.
![]()
Go to :
SODIUM INTAKE AND BLOOD PRESSURE
Many intervention studies have reported sodium intake reduction lowers BP and has a profound effect in individuals with hypertension.36) Furthermore, this effect was observed even after modest sodium intake reduction.37) However, the majority of intervention studies were conducted over the short- or medium-term and few long-term studies have been undertaken, presumably because long-term dietary intervention studies are much more difficult to perform. In a previous study,38) we found 5 dietary intervention studies performed over more than 6 months.39)40)41)42)43) Four of these studies reported lowering sodium intake significantly lowered BP.39)40)41)42) In the Trials of Hypertension Prevention (TOHP) II study, the effect of sodium intake reduction on BP was observed, and although the effect declined with time, it remained significant until 36 months and reduced the incidence of hypertension.41) On the other hand, a study performed in young healthy nulliparous pregnant women concluded a low sodium diet had no effect on BP or on the incidence of gestational hypertension.43)
The International Cooperative Study on Salt, Other Factors, and Blood Pressure (INTERSALT) was a representative population-based cross-sectional study that evaluated the relationship between salt intake and blood pressure.44) This study showed that 24-hour urine sodium and BP were significantly related, but unfortunately, did not determine whether BP reductions were dose-dependently related to 24-hour urine sodium levels.
To investigate the dose-dependent effect of sodium intake on BP in population-based epidemiological studies, we searched PubMed from January 2009 to September 2019 for cross-sectional studies that evaluated the relationship between BP and sodium intake (search terms in Appendix 2). The inclusion criteria used were as follows: human, sodium intake measured by 24-hour urine collection (single or multiple), and BP data (casual or ambulatory). We identified 374 articles. Studies used spot urine collection to estimate 24-hour urine sodium or a dietary survey-based method were excluded for the reasons mentioned above. Titles and abstracts were screened, potentially eligible articles were identified, and the full text were reviewed. As a result, 15 studies were eligible for analysis (Table 3).45)46)47)48)49)50)51)52)53)54)55)56)57)58)59) Of these 15 studies, 9 reported a significant association between sodium intake and BP,45)46)47)48)49)50)51)52)53) and 6 studies found no significant association.54)55)56)57)58)59) Jackson et al. analyzed data obtained from 766 participants in the National Health and Nutrition Examination Survey (2014) conducted in the United States,51) and reported significant, dose-dependent associations between BP and 24-hour urine sodium (positive association) and potassium (negative association). On the other hand, a study by Mente et al.55) performed as part of the Prospective Urban Rural Epidemiological (PURE)-Canadian study found no linear association between BP and 24-hour urine sodium excretion. The differences between these studies were; 1) determination method of complete 24-hour urine collection, 2) 24-hour urine potassium excretion, and 3) ethnicity. Mente et al.55) used para-aminobenzoic acid to determine complete 24-hour urine collection but did not use it in individual over 65 years old, and thus, it was not clear whether complete 24-hour urine collection was performed in those over 65-years old. The most obvious difference between the 2 studies was that the study population of Mente's study55) had a higher potassium intake and a lower urine sodium-to-potassium ratio than those of Jackson's study had51) (sodium-to-potassium ratios were 1.93 vs 2.98, respectively). In a study by Xu et al.49) on 2,281 Chinese individuals, a significant linear association was observed between BP and 24-hour urine sodium excretion. In this study, average 24-hour urine potassium was 25.3 mmol/day and the urine sodium-to-potassium ratio was 6.8. In a previous study, we found a significant association between urinary sodium-to-potassium ratio and BP.53) These findings suggest that high potassium intake and a low sodium-to-potassium ratio may reduce the effect of sodium intake on BP. Furthermore, ethnicity may have contributed to result disparities. The population studied by Jackson et al. included more than 10% African-Americans, but the population studied by Mente et al.55) included 9.1% non-Europeans (the proportion of Black people was not reported). BP response to sodium intake is not as uniform as response to antihypertensive drugs, which can be explained by sodium sensitivity. In general population, 20–50% of individuals exhibit sodium sensitivity,60) and the condition is highly prevalent in Black people, those with hypertension or metabolic syndrome, and in older people and women.61) Therefore, the inclusion of a large number of sodium resistant individuals might blur the dose-dependent effect of sodium intake on BP. As an example, Mohammadifard et al.57) included young and healthy individuals without diabetes, hypertension, a history of diuretic use, or renal insufficiency (i.e. large number of sodium resistant individuals may be included), and reported no association between sodium intake and BP. In terms of statistical analysis, we used multiple regression with restricted cubic splines,53) and found a non-linear (curvilinear) association between 24-hour urine sodium excretion and BP, which contrasts with that found by Mente et al.55) and others. In addition, BP measurement methods might have contributed to result disparities. We previously reported a significant linear association between 24-hour urine sodium and nighttime BP and a curvilinear association with daytime BP in older individuals (≥55 years old).53) Accordingly, the different relations between sodium intake and BP in cross-sectional studies might be caused by study population, statistical method, and/or BP measurement differences.
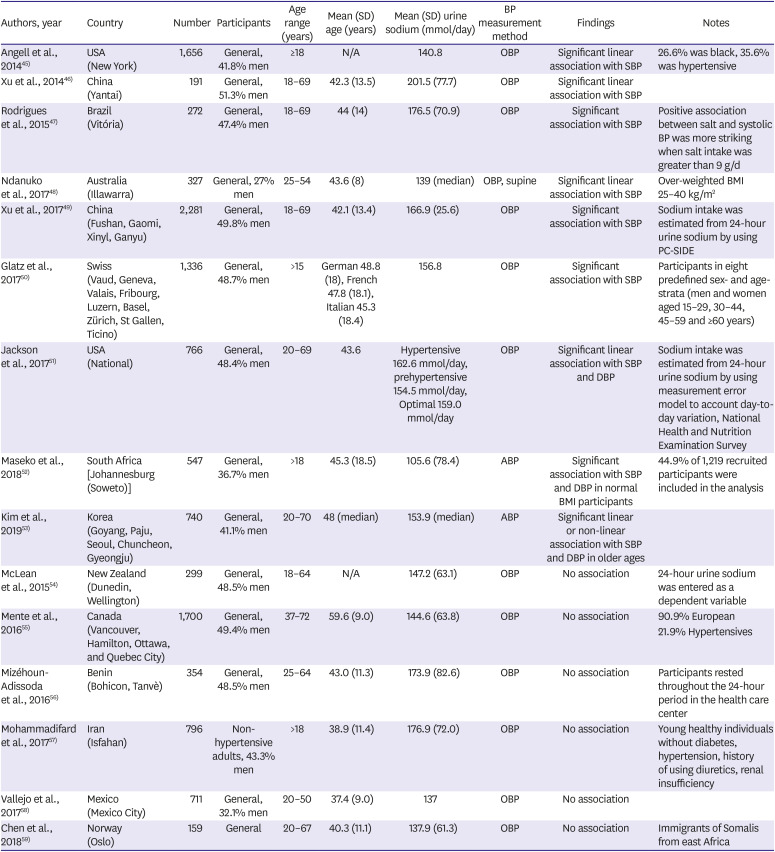
Table 3
Cross-sectional epidemiologic studies that evaluated the association between sodium intake and blood pressure
| Authors, year | Country | Number | Participants | Age range (years) | Mean (SD) age (years) | Mean (SD) urine sodium (mmol/day) | BP measurement method | Findings | Notes |
|---|---|---|---|---|---|---|---|---|---|
| Angell et al., 201445) | USA (New York) | 1,656 | General, 41.8% men | ≥18 | N/A | 140.8 | OBP | Significant linear association with SBP | 26.6% was black, 35.6% was hypertensive |
| Xu et al., 201446) | China (Yantai) | 191 | General, 51.3% men | 18–69 | 42.3 (13.5) | 201.5 (77.7) | OBP | Significant linear association with SBP | |
| Rodrigues et al., 201547) | Brazil (Vitória) | 272 | General, 47.4% men | 18–69 | 44 (14) | 176.5 (70.9) | OBP | Significant association with SBP | Positive association between salt and systolic BP was more striking when salt intake was greater than 9 g/d |
| Ndanuko et al., 201748) | Australia (Illawarra) | 327 | General, 27% men | 25–54 | 43.6 (8) | 139 (median) | OBP, supine | Significant linear association with SBP | Over-weighted BMI 25–40 kg/m2 |
| Xu et al., 201749) | China (Fushan, Gaomi, Xinyl, Ganyu) | 2,281 | General, 49.8% men | 18–69 | 42.1 (13.4) | 166.9 (25.6) | OBP | Significant association with SBP | Sodium intake was estimated from 24-hour urine sodium by using PC-SIDE |
| Glatz et al., 201750) | Swiss (Vaud, Geneva, Valais, Fribourg, Luzern, Basel, Zürich, St Gallen, Ticino) | 1,336 | General, 48.7% men | >15 | German 48.8 (18), French 47.8 (18.1), Italian 45.3 (18.4) | 156.8 | OBP | Significant association with SBP | Participants in eight predefined sex- and age-strata (men and women aged 15–29, 30–44, 45–59 and ≥60 years) |
| Jackson et al., 201751) | USA (National) | 766 | General, 48.4% men | 20–69 | 43.6 | Hypertensive 162.6 mmol/day, prehypertensive 154.5 mmol/day, Optimal 159.0 mmol/day | OBP | Significant linear association with SBP and DBP | Sodium intake was estimated from 24-hour urine sodium by using measurement error model to account day-to-day variation, National Health and Nutrition Examination Survey |
| Maseko et al., 201852) | South Africa [Johannesburg (Soweto)] | 547 | General, 36.7% men | >18 | 45.3 (18.5) | 105.6 (78.4) | ABP | Significant association with SBP and DBP in normal BMI participants | 44.9% of 1,219 recruited participants were included in the analysis |
| Kim et al., 201953) | Korea (Goyang, Paju, Seoul, Chuncheon, Gyeongju) | 740 | General, 41.1% men | 20–70 | 48 (median) | 153.9 (median) | ABP | Significant linear or non-linear association with SBP and DBP in older ages | |
| McLean et al., 201554) | New Zealand (Dunedin, Wellington) | 299 | General, 48.5% men | 18–64 | N/A | 147.2 (63.1) | OBP | No association | 24-hour urine sodium was entered as a dependent variable |
| Mente et al., 201655) | Canada (Vancouver, Hamilton, Ottawa, and Quebec City) | 1,700 | General, 49.4% men | 37–72 | 59.6 (9.0) | 144.6 (63.8) | OBP | No association | 90.9% European |
| 21.9% Hypertensives | |||||||||
| Mizéhoun-Adissoda et al., 201656) | Benin (Bohicon, Tanvè) | 354 | General, 48.5% men | 25–64 | 43.0 (11.3) | 173.9 (82.6) | OBP | No association | Participants rested throughout the 24-hour period in the health care center |
| Mohammadifard et al., 201757) | Iran (Isfahan) | 796 | Non-hypertensive adults, 43.3% men | >18 | 38.9 (11.4) | 176.9 (72.0) | OBP | No association | Young healthy individuals without diabetes, hypertension, history of using diuretics, renal insufficiency |
| Vallejo et al., 201758) | Mexico (Mexico City) | 711 | General, 32.1% men | 20–50 | 37.4 (9.0) | 137 | OBP | No association | |
| Chen et al., 201859) | Norway (Oslo) | 159 | General | 20–67 | 40.3 (11.1) | 137.9 (61.3) | OBP | No association | Immigrants of Somalis from east Africa |
ABP = ambulatory blood pressure; BMI = body mass index; BP = blood pressure; DBP = diastolic blood pressure; N/A = not available; OBP = office measured blood pressure; SBP = systolic blood pressure; SD = standard deviation; PC-SIDE = PC Software for Intake Distribution Estimation.
![]()
Go to :
SODIUM INTAKE AND CARDIOVASCULAR DISEASE
Although the association between sodium intake and BP is generally accepted, relations between the effects of sodium intake on CV events and mortality have been debated. Few long-term intervention trials have evaluated the effect of sodium intake on CV outcomes and studies conducted have lacked the statistical power to access the relation between CV events and sodium intake. A long-term maintenance of dietary sodium intakes in large populations is difficult for cost and ethical reasons, especially in high risk patients. Although the phase I and II TOHP did not include CV outcomes as primary efficacies, they did perform long-term follow-ups (over 20 years) to determine CV outcomes, after the original studies had been terminated.62) This long-term study showed a linear increase in all-cause mortality of 12% for every 1 g/day increase in sodium consumption and no evidence of a J-shaped or nonlinear relation.63) On the other hand, the Trial of Nonpharmacologic Intervention in the Elderly (TONE) study showed no difference between the CV event rates in a reduced sodium intervention group and a usual lifestyle intervention group.64) However, a meta-analysis that included data from the TOHP I, TOHP II, and TONE studies showed sodium intake reduction significantly reduced CV events.65) Stolarz-Skrzypek et al.66) reported an inverse association between 24-hour urine sodium and risk of CV mortality in a general population and in individuals with hypertension without CV disease. Actually, several cohort studies have reported different associations between sodium intake and CV outcomes.
We searched cohort studies that evaluated association between sodium intake and CV outcomes in PubMed from 2009 to 2019 (search terms in Appendix 3) and initially identified 619 articles. We included studies that used 24-hour urine collection method to determine sodium intakes and excluded studies that used spot urine collection or a dietary survey. Titles and abstracts were screened and potentially eligible articles were identified and reviewed full text in detail. Of the 10 studies included (Table 4), 5 studies66)67)68)69)70) used single 24-hour urine sodium measurements at baseline and the other 5 studies63)71)72)73)74) used averages of subsequently measured multiple 24-hour urine sodium measurements to estimate sodium intake. The five studies performed using single 24-hour urine sodium measurements showed inverse,66) J- or U-shaped associations,67)70) a positive association,68) or no association69) with CV outcomes. However, in the 5 studies that used average of subsequently measured multiple 24-hour urine sodium,63)71)72)73)74) high 24-hour urine sodium excretion was associated with a higher risk of CV outcomes and 24-hour urine sodium excretion and CV outcomes were found to be linearly associated.
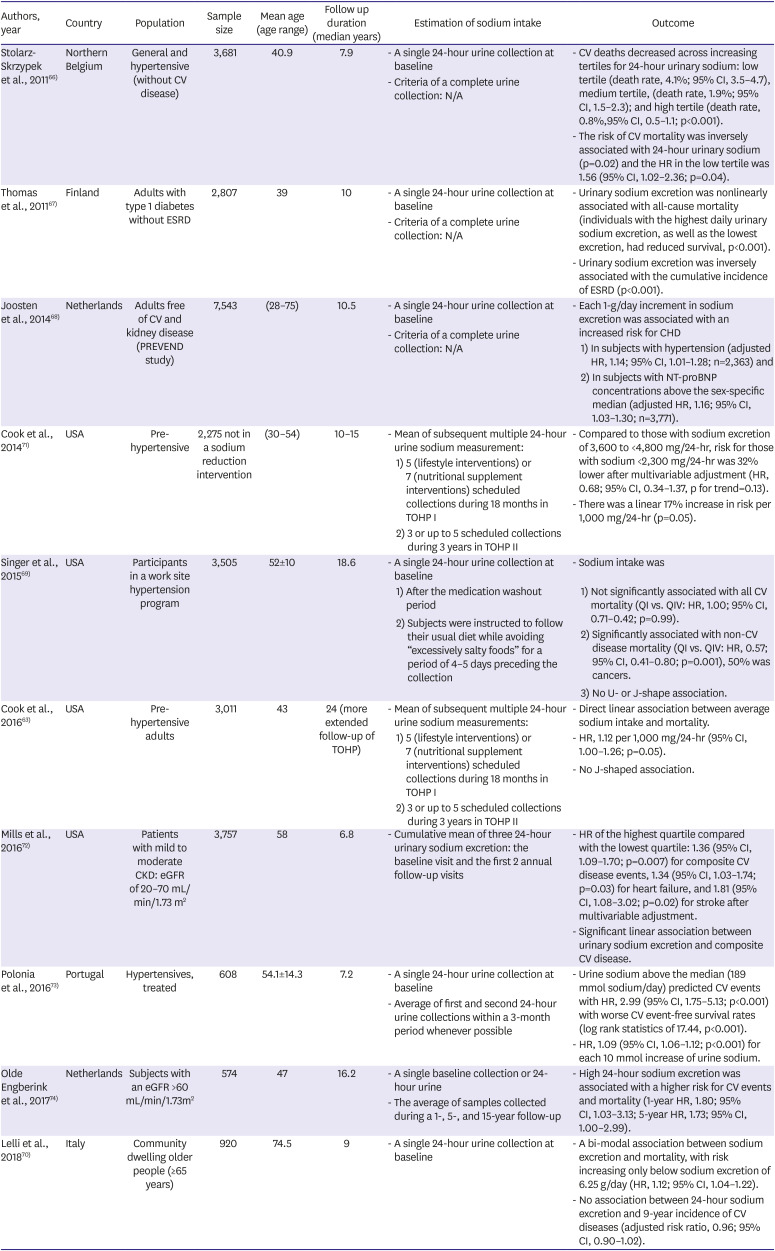
Table 4
Cohort studies that evaluated the association between sodium intake and cardiovascular outcomes
| Authors, year | Country | Population | Sample size | Mean age (age range) | Follow up duration (median years) | Estimation of sodium intake | Outcome | ||
|---|---|---|---|---|---|---|---|---|---|
| Stolarz-Skrzypek et al., 201166) | Northern Belgium | General and hypertensive (without CV disease) | 3,681 | 40.9 | 7.9 | - A single 24-hour urine collection at baseline | - CV deaths decreased across increasing tertiles for 24-hour urinary sodium: low tertile (death rate, 4.1%; 95% CI, 3.5–4.7), medium tertile, (death rate, 1.9%; 95% CI, 1.5–2.3); and high tertile (death rate, 0.8%,95% CI, 0.5–1.1; p<0.001). | ||
| - Criteria of a complete urine collection: N/A | - The risk of CV mortality was inversely associated with 24-hour urinary sodium (p=0.02) and the HR in the low tertile was 1.56 (95% CI, 1.02–2.36; p=0.04). | ||||||||
| Thomas et al., 201167) | Finland | Adults with type 1 diabetes without ESRD | 2,807 | 39 | 10 | - A single 24-hour urine collection at baseline | - Urinary sodium excretion was nonlinearly associated with all-cause mortality (individuals with the highest daily urinary sodium excretion, as well as the lowest excretion, had reduced survival, p<0.001). | ||
| - Criteria of a complete urine collection: N/A | - Urinary sodium excretion was inversely associated with the cumulative incidence of ESRD (p<0.001). | ||||||||
| Joosten et al., 201468) | Netherlands | Adults free of CV and kidney disease (PREVEND study) | 7,543 | (28–75) | 10.5 | - A single 24-hour urine collection at baseline | - Each 1-g/day increment in sodium excretion was associated with an increased risk for CHD | ||
| - Criteria of a complete urine collection: N/A | 1) In subjects with hypertension (adjusted HR, 1.14; 95% CI, 1.01–1.28; n=2,363) and | ||||||||
| 2) In subjects with NT-proBNP concentrations above the sex-specific median (adjusted HR, 1.16; 95% CI, 1.03–1.30; n=3,771). | |||||||||
| Cook et al., 201471) | USA | Pre-hypertensive | 2,275 not in a sodium reduction intervention | (30–54) | 10–15 | - Mean of subsequent multiple 24-hour urine sodium measurement: | - Compared to those with sodium excretion of 3,600 to <4,800 mg/24-hr, risk for those with sodium <2,300 mg/24-hr was 32% lower after multivariable adjustment (HR, 0.68; 95% CI, 0.34–1.37, p for trend=0.13). | ||
| 1) 5 (lifestyle interventions) or 7 (nutritional supplement interventions) scheduled collections during 18 months in TOHP I | - There was a linear 17% increase in risk per 1,000 mg/24-hr (p=0.05). | ||||||||
| 2) 3 or up to 5 scheduled collections during 3 years in TOHP II | |||||||||
| Singer et al., 201569) | USA | Participants in a work site hypertension program | 3,505 | 52±10 | 18.6 | - A single 24-hour urine collection at baseline | - Sodium intake was | ||
| 1) After the medication washout period | 1) Not significantly associated with all CV mortality (QI vs. QIV: HR, 1.00; 95% CI, 0.71–0.42; p=0.99). | ||||||||
| 2) Subjects were instructed to follow their usual diet while avoiding “excessively salty foods” for a period of 4–5 days preceding the collection | 2) Significantly associated with non-CV disease mortality (QI vs. QIV: HR, 0.57; 95% CI, 0.41–0.80; p=0.001), 50% was cancers. | ||||||||
| 3) No U- or J-shape association. | |||||||||
| Cook et al., 201663) | USA | Pre-hypertensive adults | 3,011 | 43 | 24 (more extended follow-up of TOHP) | - Mean of subsequent multiple 24-hour urine sodium measurements: | - Direct linear association between average sodium intake and mortality. | ||
| 1) 5 (lifestyle interventions) or 7 (nutritional supplement interventions) scheduled collections during 18 months in TOHP I | - HR, 1.12 per 1,000 mg/24-hr (95% CI, 1.00–1.26; p=0.05). | ||||||||
| 2) 3 or up to 5 scheduled collections during 3 years in TOHP II | - No J-shaped association. | ||||||||
| Mills et al., 201672) | USA | Patients with mild to moderate CKD: eGFR of 20–70 mL/min/1.73 m2 | 3,757 | 58 | 6.8 | - Cumulative mean of three 24-hour urinary sodium excretion: the baseline visit and the first 2 annual follow-up visits | - HR of the highest quartile compared with the lowest quartile: 1.36 (95% CI, 1.09–1.70; p=0.007) for composite CV disease events, 1.34 (95% CI, 1.03–1.74; p=0.03) for heart failure, and 1.81 (95% CI, 1.08–3.02; p=0.02) for stroke after multivariable adjustment. | ||
| - Significant linear association between urinary sodium excretion and composite CV disease. | |||||||||
| Polonia et al., 201673) | Portugal | Hypertensives, treated | 608 | 54.1±14.3 | 7.2 | - A single 24-hour urine collection at baseline | - Urine sodium above the median (189 mmol sodium/day) predicted CV events with HR, 2.99 (95% CI, 1.75–5.13; p<0.001) with worse CV event-free survival rates (log rank statistics of 17.44, p<0.001). | ||
| - Average of first and second 24-hour urine collections within a 3-month period whenever possible | - HR, 1.09 (95% CI, 1.06–1.12; p<0.001) for each 10 mmol increase of urine sodium. | ||||||||
| Olde Engberink et al., 201774) | Netherlands | Subjects with an eGFR >60 mL/min/1.73m2 | 574 | 47 | 16.2 | - A single baseline collection or 24-hour urine | - High 24-hour sodium excretion was associated with a higher risk for CV events and mortality (1-year HR, 1.80; 95% CI, 1.03–3.13; 5-year HR, 1.73; 95% CI, 1.00–2.99). | ||
| - The average of samples collected during a 1-, 5-, and 15-year follow-up | |||||||||
| Lelli et al., 201870) | Italy | Community dwelling older people (≥65 years) | 920 | 74.5 | 9 | - A single 24-hour urine collection at baseline | - A bi-modal association between sodium excretion and mortality, with risk increasing only below sodium excretion of 6.25 g/day (HR, 1.12; 95% CI, 1.04–1.22). | ||
| - No association between 24-hour sodium excretion and 9-year incidence of CV diseases (adjusted risk ratio, 0.96; 95% CI, 0.90–1.02). | |||||||||
CHD = coronary heart disease; CI = confidence interval; CKD = chronic kidney disease; CV = cardiovascular; eGFR = estimated glomerular filtration rate; ESRD = end-stage renal disease; HR = hazard ratio; N/A = not available; Q = quintile; TOHP = Trials of Hypertension Prevention.
![]()
The different results may be explained by the difference in measurement methods of sodium intake, a single measurement of 24-hour urine sodium or subsequently multiple measurement of 24-hour urine sodium. A single 24-hour urine sodium measurement at baseline cannot reflect day-to-day variations in sodium intake. For example, many people change their dietary habits during follow-up in cohort studies. In a study by Olde Engberink et al.,74) 50% of subjects showed more than 0.8 g (34 mmol) difference between sodium intake at baseline and averages of subsequent measurements taken over 5 years, and 50% subjects were classified into different sodium intake groups when long-term 24-hour urine sodium measurements were used to classify sodium intake groups rather than single baseline measurements. Similarly, the hazard ratios of CV events and mortality were altered by up to 85% when average of subsequently measured long-term 24-hour urine sodium measurements were used.
In the present review, we excluded studies that estimated sodium intakes from spot urine measurements using formulae, although the estimation of 24-hour urine sodium from spot urine is inexpensive and easily performed in large populations. Several large-scale studies have evaluated the association between sodium intake and CV outcomes and mortality using estimated 24-hour urine sodium values calculated in this manner, and these studies have consistently found paradoxical J- or U-shaped associations between sodium intake and CV outcomes and mortality.8)9)75) However, in addition to the reasons as mentioned above, a recently published study demonstrated the inappropriateness of using estimated dietary sodium intake from spot urine when investigating the association between sodium intake and mortality.76) In this study, a significant linear association was reported between the averages of subsequently measured 24-hour urine sodium and mortality, but J- or U-shaped relationships were found between estimated 24-hour urine sodium levels using spot urine and mortality.
Go to :
CONCLUSION
The findings of the present systematic review can be summarized as follows:
1) The spot urine collection method is inaccurate and should not be recommended to measure sodium intake at the individual level, and further studies for its use to measure sodium intake at the population level are required.
2) High sodium intake is positively associated with BP.
3) Associations between high sodium intake and CV outcomes are significant, but reverse causality cannot be ruled out.
Although many studies have reported no, inverse, or J- or U-shaped associations of sodium intake with BP, CV outcomes, and mortality, these studies used biased methods to determine sodium intakes. This review convincingly shows sodium intake is associated with BP, CV outcomes, and mortality and invalidates the argument that reducing sodium intake is dangerous and unnecessary. Therefore, we conclude that sodium intake reduction should be generally recommended and not limited to patients with hypertension or CV disease.
Go to :
 XML Download