Journal List > Healthc Inform Res > v.26(3) > 1144869

Otokiti, Williams, and Warsame: Impact of Digital Divide on the Adoption of Online Patient Portals for Self-Motivated Patients

Abstract

Objectives

Our study aimed to determine the effect of the digital divide in the adoption of online patient portals by motivated patients who wish to improve their health outcomes through the use of the Internet and information technology to assess determinants of low adoption rates of online portals and to explore social media use as a correlation to patient portal use.

Methods

We utilized data from the Health Information National Trends Survey (HINTS) 2017 and 2018. We performed a cross-sectional study analyzing the outcome variable of patient portal use with several predictor variables, namely, age, marital status, gender, mental health, education, Medicaid, income, number of people in household, trust, social media, chronic disease, and health app use. Basic descriptive statistics and logistic regression were performed using SPSS version 25.

Results

Our study found that low adoption rates go beyond the digital divide. A correlation exists between social media use and patient portal use, and the impact of previously identified factors on patients with self-motivation for health improvement.

Conclusions

Self-motivation is an important factor in patient portal use and access. Behavioral and motivational interventions geared towards the adoption of health information technology tools, such as online portals, can assist with improving the public health significance of these tools.

I. Introduction

Online patient portals are web-based applications that give patients direct and secure 24-hour access to their Electronic Health Records. Through such portals, they can view information like laboratory results, medication history, and discharge summaries. Patients can also perform various activities, such as securely message their providers, request prescription refills, and schedule appointments [1]. Patient portal use can increase patient engagement [24] and thereby improve the quality of care provided to individual patients [5]. Patient engagement is a set of behaviors by patients, family members, health professionals, and a set of organizational policies and procedures that foster the inclusion of patients and family members as active members of a collaborative healthcare team in partnership with providers and provider organizations [6]. Patient engagement translates to public health benefits on a larger scale because it results in increased levels of screening and preventive care, efficient utilization of health resources, and reduction in overall healthcare cost [5,7]. Linking patient portals to the aggregated data stored in Health Information Exchange systems, organizations can increase access to comprehensive patient records and improve population health surveillance and management [8].
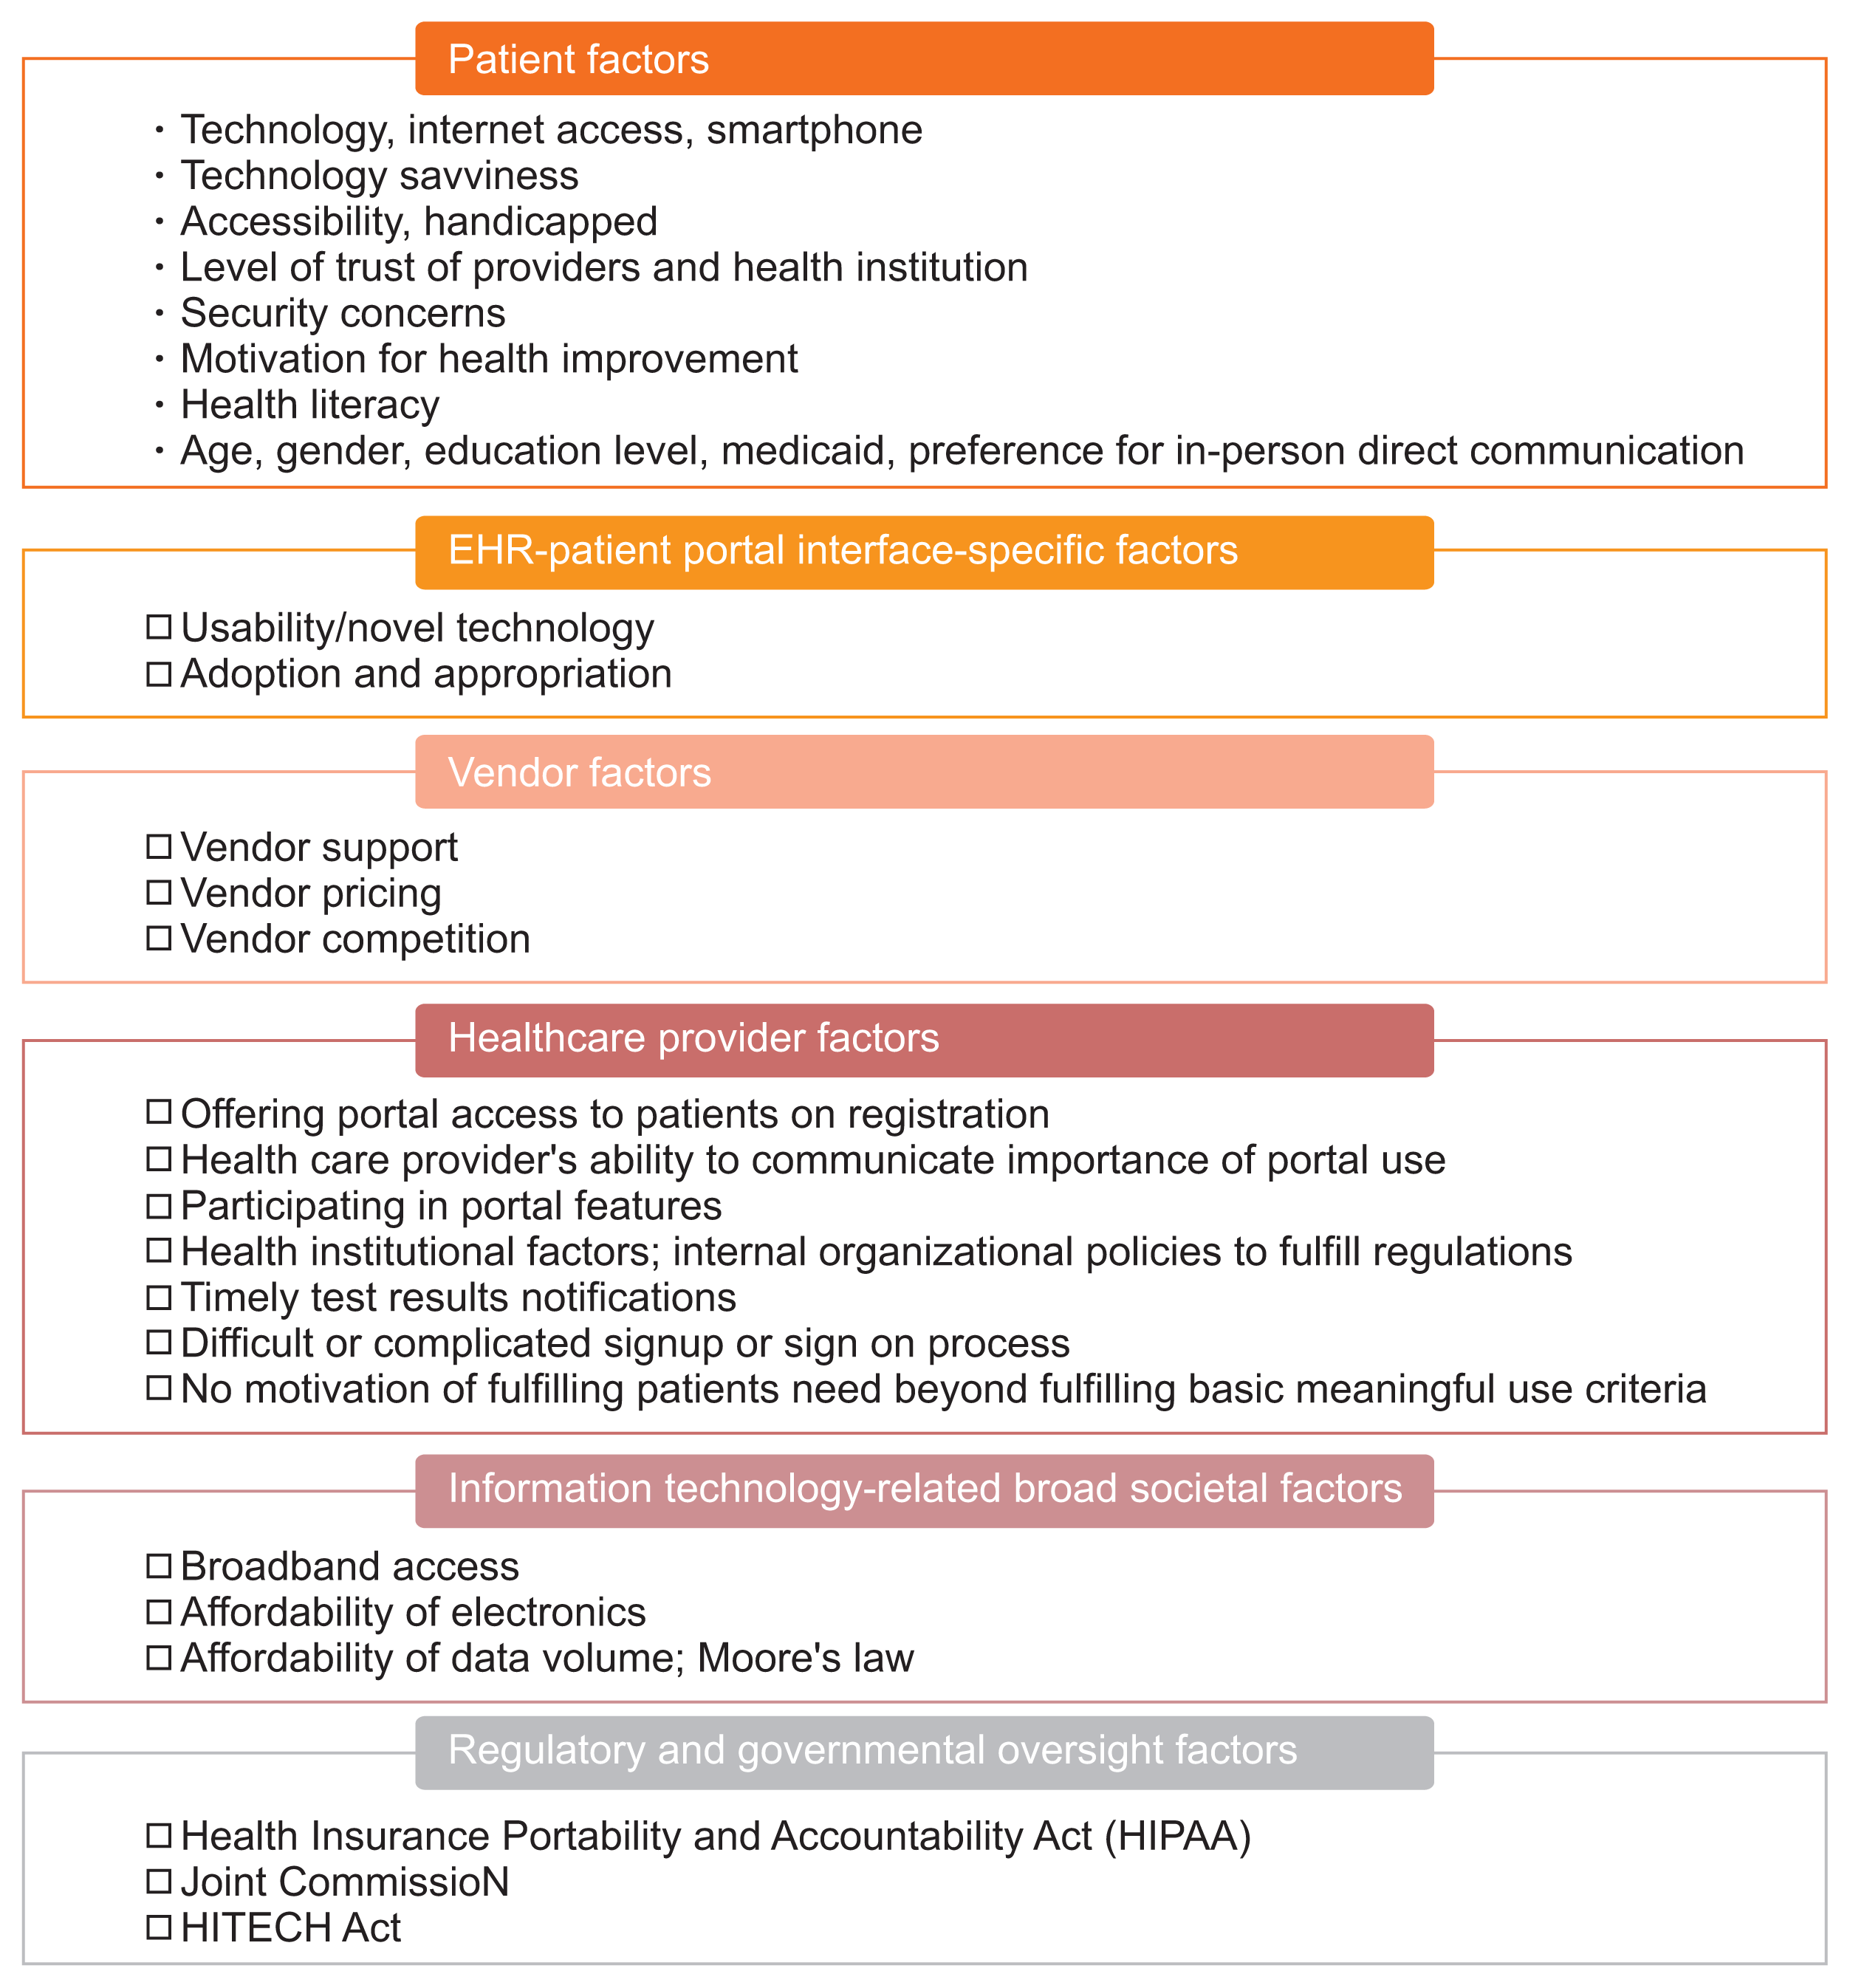
Proliferation and addition of online portals to Electronic Health Records by health institutions across the USA occurred due to the Meaningful Use Stage 2 incentive mandated by the implementation of the 2009 Health Information Technology for Economic and Clinical Health Act [3,4]. Despite the huge investment in patient portals and their assumed benefits to public health, adoption rates have been low [9], with studies showing rates between 28% and 47% [3,4,9]. Previous studies have identified various factors and/or barriers for this low adoption rate and the determinants of patient portal adoption are summarized in Figure 1 [3,4,10]. Patient portal adoption is impacted by health inequity and disparity in socioeconomic status (income, education level, insurance type, chronic disease status, health literacy, age), and consequently, the digital divide [11]. The digital divide is the uneven distribution of access to, use of, and impact of information technologies between demographics and regions [2,7]. Low patient portal use in vulnerable populations may result in intervention-generated inequity, which is a situation whereby an intervention inadvertently worsens existing health disparities instead of improving them [11,12]. Significant factors associated with patient portal use include having received a higher education level; being female, Caucasian, and non-Medicaid patients; having Internet access, higher income, and patient trust in healthcare providers and the healthcare system [3,4,13]. Factors with significant negative impacts on patient portal use include privacy, security concerns, and user-friendliness [14].
Self-motivation is a cornerstone of behavioral change for positive health outcome [1517]. The importance of self-motivation in ensuring the initiation and maintenance of favorable individual health behavior has been well established by behavioral psychology theories [18]. Studies show that a high proportion of US adults are motivated to use health information technology (HIT) for self-improvement by searching for health information online and downloading health applications onto their phones [19,20]. The ubiquity of Internet access [21] and the presence of a sizable proportion of individuals with self-motivation to use HIT for their health improvement prompted us to find which factors are associated with patient portal utilization in this subpopulation.
Social media is defined as a form of electronic communication by users to create online communities and share messages, content, and ideas with others [22]. Seven out of 10 Americans use social media [21]. The widespread success and adoption of social media have many contributing factors: ease of connectivity with an estimated 90% of US with access to the Internet and 81% with a smartphone [21], ability to “go viral” or have content spread quickly across multiple social networks, relatively low operating costs, instant and scalable form of information transmission, and ease of building and maintaining networks because of user-based schema [23]. Social media scores highly in terms of its perceived usefulness and usability, which are determinants of adopting new technology proposed by the Technology Adoption Model [24]. Also, social media services manifest standard system acceptability and usability principles [24]. Social media’s widespread adoption based on these two principles also involves learnability and memorability [24,25]. It is considered the least complex Internet-enabled technology, and it is easy to learn without the need for advanced training [25]. High memorability allows users the ability to continue using the technology even after a prolonged period of absence [25]. In addition to its perceived usefulness and the aspect of entertainment, peer influence and network externalities play a big role in the widespread adoption of social media [26].

1. Study Justification and Study Question

Studies have identified factors that can lead to patient portal adoption in the general population, but no studies have examined the factors and degree of patient portal adoption specifically in patients who demonstrate the motivation to use IT for self-health improvement, have access to the Internet, and have been offered portal access by their healthcare providers or insurance company.
To overcome these gaps in the literature, our study aimed to answer the following questions in the selected patient population (i.e., patients who are motivated to use HIT and do not have the previously identified barriers to portal adoption, that is, the lack of Internet access and healthcare provider not offering portal access to a patient) [3]:
  1. Is there a health disparity/digital divide in the adoption of online patient portals in our selected patient population in comparison to the general population?

  2. Is there a correlation between the level of patient trust and patient portal adoption in our selected patient population? [13]

  3. Are usability and adoption issues likely the key determinant for the low rate of patient portal use?

  4. Considering the ubiquity of social media use, we were also interested to determine whether social media use correlates with patient portal utilization in our selected patient population.

Our study utilized data from the nationally representative Health Information National Trends Survey (HINTS) administered by the National Cancer Institute to identify changes in health communication and IT. This survey aims to understand how adults (18 years and older) use various communication channels to obtain health information. The survey datasets (2003–2020) are publicly available at https://hints.cancer.gov and offer a testbed to evaluate new theories in health IT. Additional information about survey design, stratified sampling method to reduce bias, and other survey methodologies can be found on the HINTS website (https://hints.cancer.gov).

II. Methods

1. Design and Sample

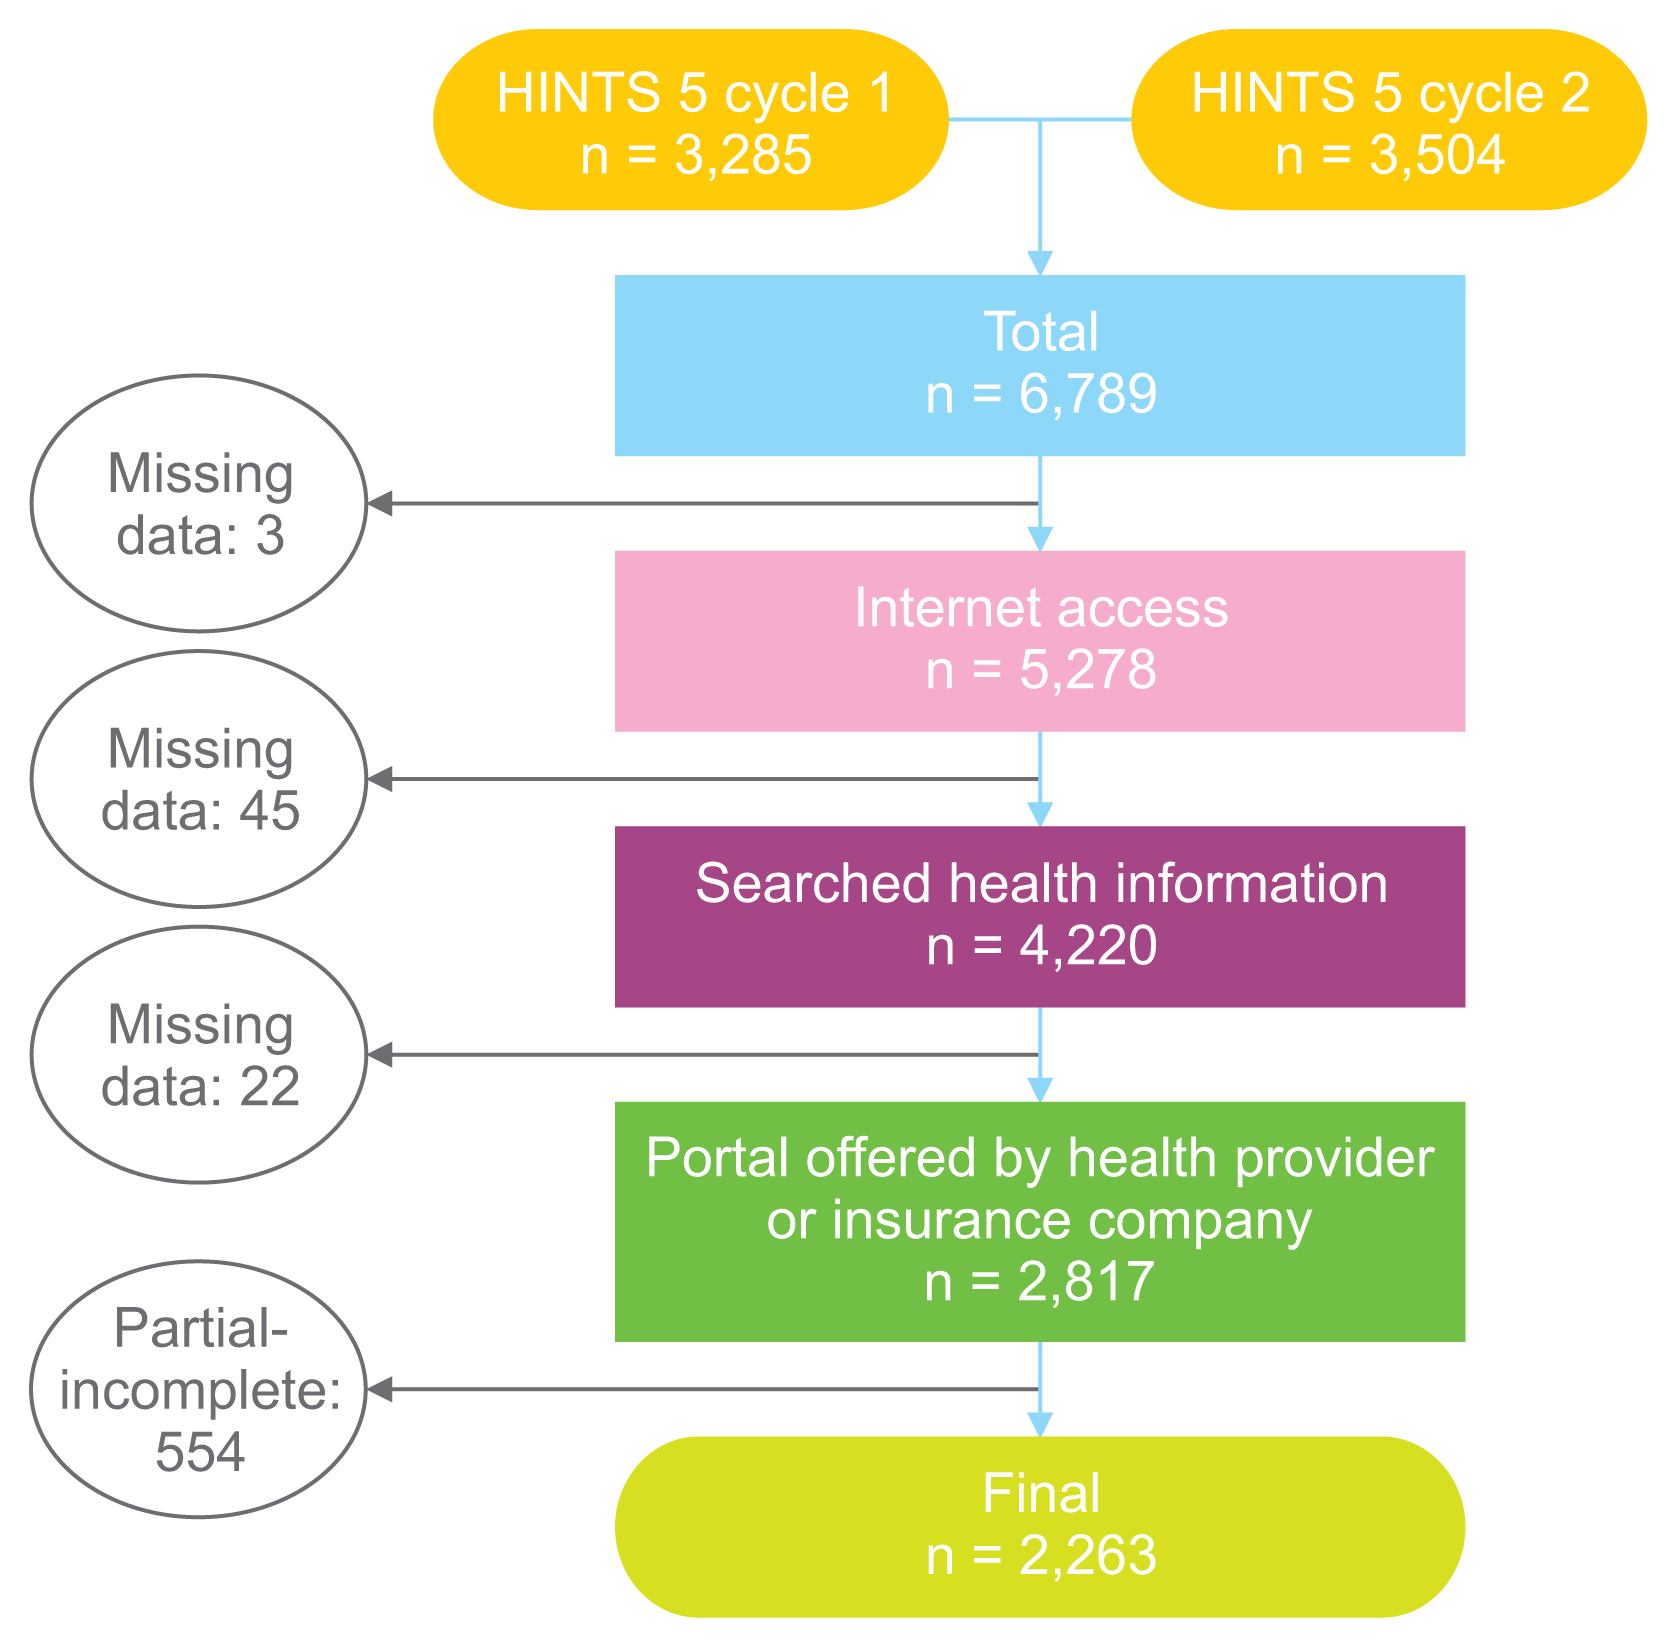
We analyzed a combination of the HINTS survey in two iterations, namely, HINTS 5 cycle 1 (November 2017, total respondents n = 3,285) and HINTS 5 cycle 2 (November 2018, total respondents n = 3,504). The final combined sample size was 6,789. We restricted our analysis to patients who had demonstrated self-motivation for using IT for health improvement, had Internet access, and had been offered access to a patient portal by a healthcare provider or health insurance company. Only patients who fit these three criteria were included in our analysis. After these inclusion criteria were applied, our sample size was 2,817. Almost 20% of the data consisted of partial responses or incomplete responses. After the partial and incomplete responses were omitted from the dataset, we had 2,263 complete responses as our final sample size. This was 80% of our population meeting pre-set criteria. See the study flow chart of the included survey and final sample size in Figure 2.

2. Measures and Variables

1) Inclusion criteria variables

Based on our literature search, there is no standard definition for self-motivation toward HIT use. We have operationalized self-motivation for this study as respondents who answered “yes” to the following question: “In the past 12 months, have you used a computer, smartphone, or other electronic means to look for health or medical information for yourself?” (Question B4a HINTS 5 cycle 1, B5a HINTS 5 cycle 2). For respondents with Internet access, we included patients who answered “yes” to, “Do you ever go online to access the Internet or worldwide web, or to send and receive e-mail?” (Question B1). Respondents who had been offered online access to their medical records by a healthcare professional or health insurance company, answered “yes” to “Have you ever been offered online access to your medical records by your healthcare provider or health insurance company?” (Question D2A and D2B HINTS 5 cycle 1, D4 HINTS 5 cycle 2).

2) Outcome variable

Patient portal access in the past year was assessed using the survey question, “How many times did you access your medical record in the past 12 months” (Question D4 HINTS 5 cycle 1, D6 HINST 5 cycle 2). We re-coded the response to greater than or equal to one as “yes” to access online medical records and zero as ‘no’ to those who did not access online their medical records.

3) Predictor variables

Predictor variables added to the analysis were deduced from factors associated with patient portal use as reported by previously reviewed literature, except social media use, the number of members of household, health app use, and history of mental disorder. These factors are important to the study because they assist in characterizing the digital divide and its impact on the adoption of online patient portals.
  • (1) Variables of interest

    • Social media use in the past 12 months (Question B10) was coded as yes or no.

    • No trust of health information from multiple sources (Question A6): This variable was re-coded to capture the essence of trust from multiple sources. The question was “How much do you trust health information from (1) family/friend, (2) newspaper, (3) radio, (4) doctor, (5) Internet, (6) charity organization, (7) government agencies, (8) religious source, and (9) television”. The survey responses were ordinal (4 “not at all”, 3 “a little”, 2 “some”, and 1 “a lot”). For a respondent, a total score of 36 (no trust at all), 27 (a little), 18 (some trust), and 9 (full trust). This was recoded as a binary variable of trust (some/full trust < 18) and no trust (a little/no trust > 18).

  • (2) Confounding variables

    • Age (Question O1) was re-coded as an ordinal variable: 18–49, 50–74, >75 years.

    • Gender (Question O14) was re-coded as male or female.

    • Marital status (Question O5) was re-coded as married (married and living as married) or not married (single, widowed, divorce, other).

    • Education (Question O6) used the question, “What is the highest level of education you completed?” This response was re-coded as high school or less, some college, and college degree or more.

    • Income (Question O19 HINTS 5 cycle 1, O17 HINTS 5 cycle 2) was re-coded as <$35,000, $35,000–$75,000, and >$75,000.

    • Health app use (Question B6 HINTS 5 cycle 1, B7 HINTS 5 cycle 2) was re-coded as yes or no (no, don’t know, no tablet or smartphone).

    • Chronic disease status (Question G3) was re-coded as yes or no. Additionally, depression and anxiety were re-coded as an independent predictor. The question was “Has a doctor or other health professional ever told you that you had any of the following medical conditions: diabetes, hypertension, chronic lung disease, arthritis or rheumatism, a heart condition, depression or anxiety”. “Yes” was coded if a respondent chose any of the options.

    • History of mental health issues (Question G3) was used as a variable derived from the chronic medical condition question. Patients who had anxiety or depression were considered positive for mental health history.

    • People in the household (Question O13) were re-coded as one person or more than one person in the household.

    • Medicaid health insurance (Question C7D) was coded as yes, if a patient chose Medicaid from the options in the response to the question, “Are you currently covered by any of the following types of health insurance or health coverage plans?”

3. Analysis

Basic descriptive statistical analysis was performed to describe sample characteristics (chi-square). Logistic regression analysis was run to evaluate whether patient portal access (outcome variable) can be significantly projected by the predictor variables in the study. All independent and predictor variables were tested in one block to control for the effects of other predictors in the model. All the predictors were nominal or categorical. The data analysis was performed using the SPSS software version 25 (IBM Corp., Armonk, NY, USA).

III. Results

The basic demographic characteristics of our final sample population showed that 54% of our sample were in the age bracket of 50–74 years, 63% were female and married with approximately 56% reporting some college education. Of the analyzed population, 51% earned more than $75,000 annual income, 82% used social media, while only 65% used online patient portals, and 59.2% used a health app. Table 1 presents the other basic characteristics of the sample population.
Our logistic regression analysis (Table 2) showed that having a college degree in addition to earning a higher income was a significant predictor of online portal use in our population, with an odds ratio (OR) of 1.52 in people that earned $35,000 to $75,000, and there was an OR of 2.22 in individuals that earned more than $75,000. People without social media had an OR of 0.5, while people who did not utilize health applications had an OR of 0.4 in the prediction of online portal use. Patients without mental health conditions had lower odds of patient portal use than those with mental health conditions (OR = 0.8). The following predictor variables were not significantly associated with the odds of using a patient portal: age, marital status, female gender, Medicaid health insurance coverage, trust issues or mistrust of health information from multiple sources, number of individuals in the household, and chronic disease.

IV. Discussion

Although some of the factors associated with the digital divide and disparity (income, education level) were still significant predictors of portal use among our sampled population of motivated individuals with Internet access, our study underscored the importance of self-motivation as a potent force in online portal adoption. Factors like Medicaid insurance, female gender, age, and chronic disease, which had been previously identified in the literature as determinants of portal use in the general population, were not significant predictors in our motivated sampled population. This shows that for individuals who are self-motivated and have Internet access, many of the factors previously identified by the literature may not be a barrier to their patient portal use. The positive impact of self-motivation in patient engagement and patient compliance with health outcomes (i.e. smoking cessation, obesity, diet) is well established in behavioral psychology and its theories [15,18]. Our study found that self-motivation is likely an important factor in portal use for engagement beyond just the factors contributing to the digital divide [11]. Most of the digital divide factors that were found to be significant in the general population (gender, Medicaid, chronic disease, age) were nullified in our self-motivated sample. Income and education level were the only factors still found significant in our study sample.
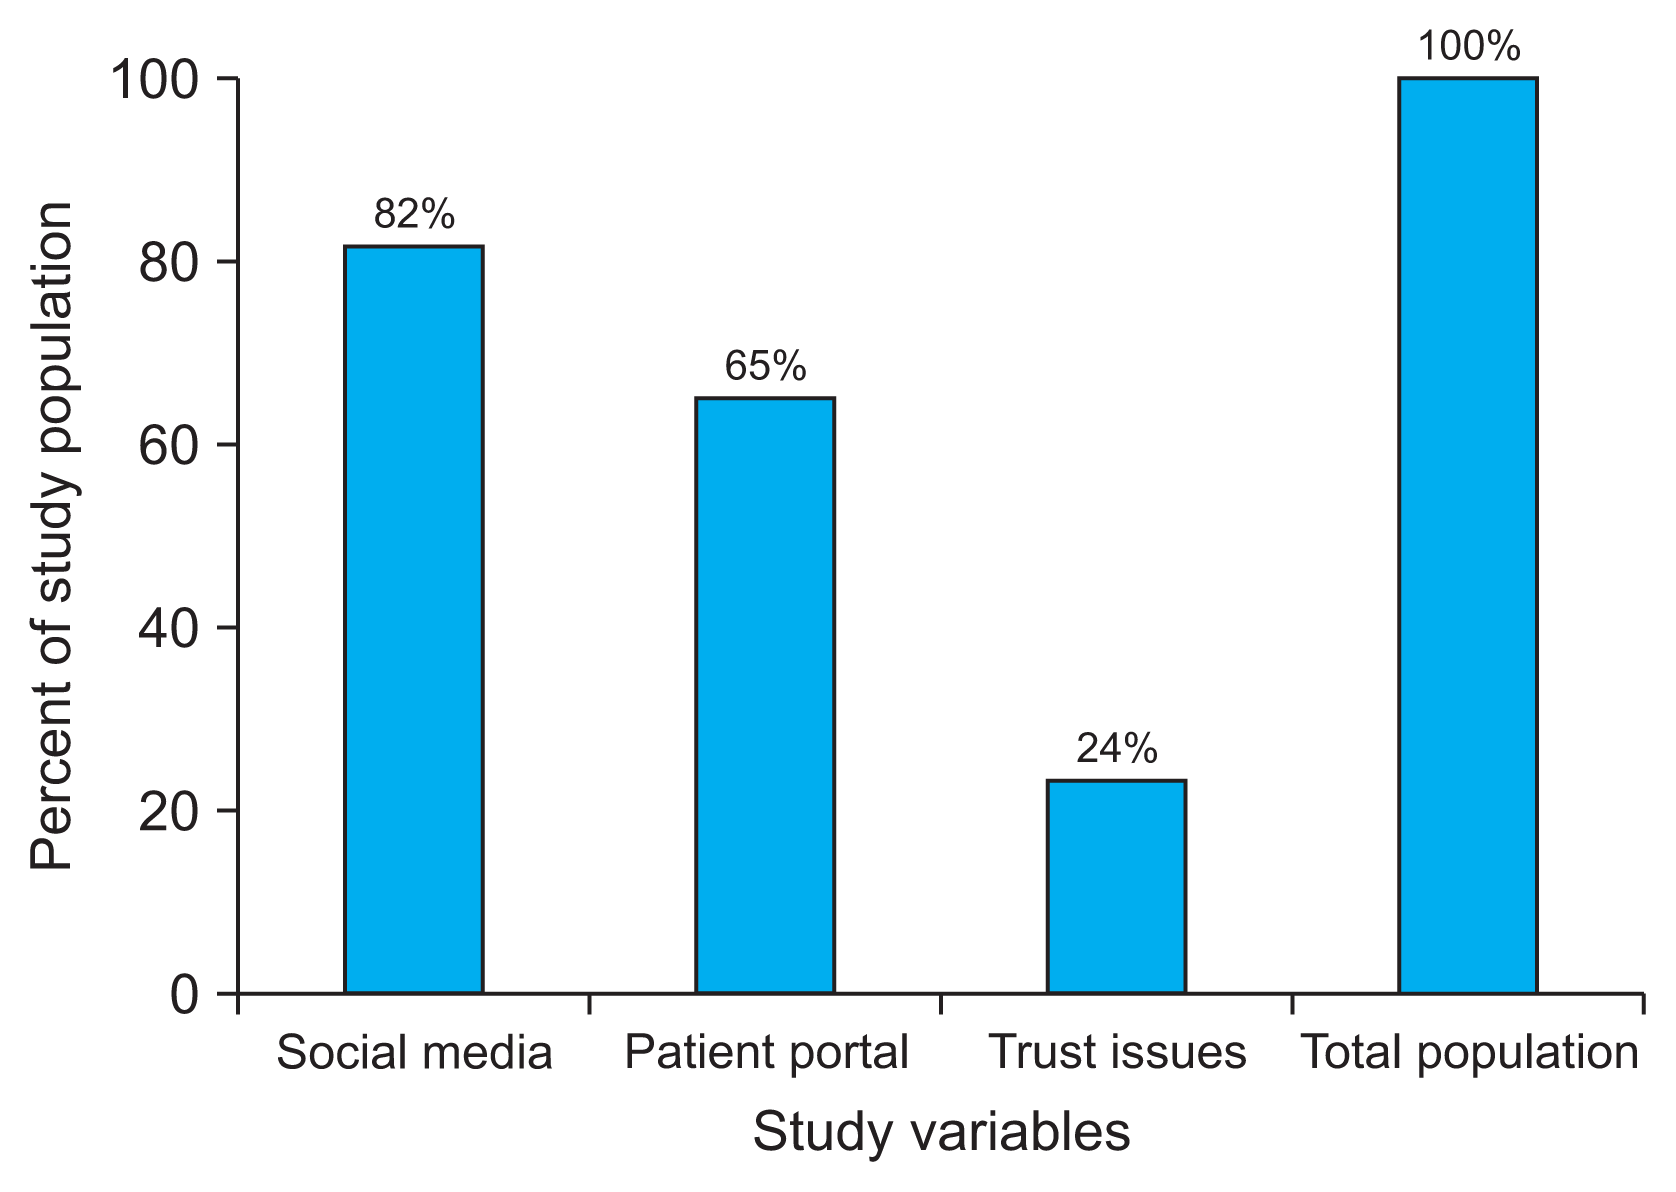
Our study also found a significant association between social media use and portal use because there were lower odds of portal use in respondents without social media. Our study showed, although all the respondents in our sample had Internet access and were offered portal access, there was a 17% higher proportion of respondents who used social media than online portal users (social media 82% vs. patient portal use 65%) (Figure 3). This notable difference between social media use and online portal use despite similar baseline characteristics (Internet access and motivation to use IT) is likely due to unfavorable factors for adoption, related to the technology itself (patient portal). The comparably distinguishing features of social media are its remarkable usability [24], leading to widespread adoption across various demographic groups. These features are summed up in its learnability, memorability, entertainment, and usefulness [24,25]. Based on this premise, we add to the existing literature that the lack of adequate usability of a patient portal is likely a significant factor in the low adoption rate of patient portals, thus hindering their public health benefit [2,27].
A limitation of our study is that we are unable to make causal claims due to the cross-sectional nature of the HINTS survey. It is also important to express caution in the interpretation and generalization of our study’s findings due to specific criteria imposed in our population sample.
This study showed the impact of previously identified factors contributing to the digital divide in the general population on patients with self-motivation for health improvement using information technology tools. Some of these factors still proved to be determinants in this group of motivated individuals. The low adoption rate of patient portals compared to the high adoption rate of social media transcends the digital divide and patient-specific factors. The usability factor of online portals is likely a hindrance to its adoption, which limits its public health benefit. More research and interventions geared towards improving and assessing the human centeredness and usability of patient portals is required for it to achieve its full public health benefit [2,28,29]. The study also found a significant correlation between social media use and online portal adoption and use.
Self-motivation to use IT for health improvement appeared to be a factor in online patient portal use and access. Most behavioral change theories and interventions are geared towards public health issues, such as obesity and smoking cessation. Considering the impact of self-motivation in the adoption of online portals, there is a need for more behavioral and motivational interventions geared towards the adoption of HIT tools with public health significance.
Just like Internet access is considered a health determinant in the general population, online portal access can be considered a health determinant in patients with Internet access. To reap the benefit of online patient portals use in the public health sector, researchers need to shift their paradigm from identifying disparities to addressing them [11]. This can be done by considering interventions that will address low patient portal use beyond the individual and instead focus on a multidimensional approach that will involve their usability, tasks, and environmental and organizational conditions.

Acknowledgments

We thank Sharad Bajpai and Simran Kaur for their assistance with our preliminary literature search during the early stages of this project.

Notes

Conflict of Interest

No potential conflict of interest relevant to this article was reported.

References

1. The Office of the National Coordinator for Health Information Technology. What is a patient portal? [Internet]. Washington (DC): The Office of the National Coordinator for Health Information Technology;c2017. [cited at 2020 Jul 20]. Available from: https://www.healthit.gov/faq/what-patient-portal.
2. Irizarry T, DeVito Dabbs A, Curran CR. Patient portals and patient engagement: a state of the science review. J Med Internet Res. 2015; 17(6):e148.
crossref
3. Hong YA, Jiang S, Liu PL. Use of patient portals of electronic health records remains low from 2014 to 2018: results from a national survey and policy implications. Am J Health Promot. 2020; 34(6):677–80.
crossref
4. Anthony DL, Campos-Castillo C, Lim PS. Who isn’t using patient portals and why? Evidence and implications from a national sample Of US Adults. Health Aff (Millwood). 2018; 37(12):1948–54.
crossref
5. Reed ME, Huang J, Brand RJ, Neugebauer R, Graetz I, Hsu J, et al. Patients with complex chronic conditions: Health care use and clinical events associated with access to a patient portal. PLoS One. 2019; 14(6):e0217636.
crossref
6. World Health Organization. Patient engagement: technical series on safer primary care [Internet]. Geneva, Switzerland: World Health Organization;2016. [cited at 2020 Jul 20]. Available from: https://apps.who.int/iris/bitstream/handle/10665/252269/9789241511629-eng.pdf;jsessionid=8627327055C471F934B5FA87EEDE3E44?sequence=1.
7. Graetz I, Huang J, Muelly ER, Fireman B, Hsu J, Reed ME. Association of mobile patient portal access with diabetes medication adherence and glycemic levels among adults with diabetes. JAMA Netw Open. 2020; 3(2):e1921429.
crossref
8. Otte-Trojel T, de Bont A, van de Klundert J, Rundall TG. Characteristics of patient portals developed in the context of health information exchanges: early policy effects of incentives in the meaningful use program in the United States. J Med Internet Res. 2014; 16(11):e258.
crossref
9. Patel V, Johnson C. Individuals’ use of online medical records and technology for health needs [Internet]. Washington (DC): The Office of the National Coordinator for Health Information Technology;2018. [cited at 2020 Jul 20]. Available from: https://www.healthit.gov/sites/default/files/page/2018-03/HINTS-2017-Consumer-Data-Brief-3.21.18.pdf.
10. Han HR, Gleason KT, Sun CA, Miller HN, Kang SJ, Chow S, et al. Using patient portals to improve patient outcomes: systematic review. JMIR Hum Factors. 2019; 6(4):e15038.
crossref
11. Grossman LV, Masterson Creber RM, Benda NC, Wright D, Vawdrey DK, Ancker JS. Interventions to increase patient portal use in vulnerable populations: a systematic review. J Am Med Inform Assoc. 2019; 26(8–9):855–70.
crossref
12. Veinot TC, Mitchell H, Ancker JS. Good intentions are not enough: how informatics interventions can worsen inequality. J Am Med Inform Assoc. 2018; 25(8):1080–8.
crossref
13. Lyles CR, Sarkar U, Ralston JD, Adler N, Schillinger D, Moffet HH, et al. Patient-provider communication and trust in relation to use of an online patient portal among diabetes patients: the Diabetes and Aging Study. J Am Med Inform Assoc. 2013; 20(6):1128–31.
crossref
14. Baldwin JL, Singh H, Sittig DF, Giardina TD. Patient portals and health apps: Pitfalls, promises, and what one might learn from the other. Healthc (Amst). 2017; 5(3):81–5.
crossref
15. Hardcastle SJ, Hancox J, Hattar A, Maxwell-Smith C, Thogersen-Ntoumani C, Hagger MS. Motivating the unmotivated: how can health behavior be changed in those unwilling to change? Front Psychol. 2015; 6:835.
crossref
16. Teixeira PJ, Going SB, Sardinha LB, Lohman TG. A review of psychosocial pre-treatment predictors of weight control. Obes Rev. 2005; 6(1):43–65.
crossref
17. Teixeira PJ, Silva MN, Mata J, Palmeira AL, Markland D. Motivation, self-determination, and long-term weight control. Int J Behav Nutr Phys Act. 2012; 9:22.
crossref
18. Thogersen-Ntoumani C, Ntoumanis N. The role of self-determined motivation in the understanding of exercise-related behaviours, cognitions and physical self-evaluations. J Sports Sci. 2006; 24(4):393–404.
19. Tan SS, Goonawardene N. Internet health information seeking and the patient-physician relationship: a systematic review. J Med Internet Res. 2017; 19(1):e9.
crossref
20. Bjarnadottir RI, Millery M, Fleck E, Bakken S. Correlates of online health information-seeking behaviors in a low-income Hispanic community. Inform Health Soc Care. 2016; 41(4):341–9.
crossref
21. Pew Research Center. Internet/Broadband Fact Sheet 2019 [Internet]. Washington (DC): Pew Research Center;2019. [cited at 2020 Jul 20]. Available from: https://www.pewresearch.org/internet/fact-sheet/internet-broadband/.
22. Merriam-Webster Inc. Definition of social media [Internet]. Springfield (MA): Merriam-Webster Inc;c2020. [cited at 2020 Jul 20]. Available from: https://www.merriam-webster.com/dictionary/social%20media.
23. Innovatemedtec. Social media in healthcare [Internet]. London, UK: Innovatemedtec;2020. [cited at 2020 Jul 20]. Available from: https://innovatemedtec.com/digital-health/health-social-media-in-healthcare.
24. Lacka E, Chong A. Usability perspective on social media sites’ adoption in the B2B context. Ind Mark Manag. 2016; 54:80–91.
crossref
25. Siamagka NT, Christodoulides G, Michaelidou N, Valvi A. Determinants of social media adoption by B2B organizations. Ind Mark Manag. 2015; 51:89–99.
crossref
26. Lin KY, Lu HP. Why people use social networking sites: an empirical study integrating network externalities and motivation theory. Comput Human Behav. 2011; 27(3):1152–61.
crossref
27. Zhao JY, Song B, Anand E, Schwartz D, Panesar M, Jackson GP, et al. Barriers, facilitators, and solutions to optimal patient portal and personal health record use: a systematic review of the literature. AMIA Annu Symp Proc. 2018; 2017:1913–22.
28. Black H, Gonzalez R, Priolo C, Schapira MM, Sonnad SS, Hanson CW 3rd, et al. True "meaningful use": technology meets both patient and provider needs. Am J Manag Care. 2015; 21(5):e329–37.
29. Haggstrom DA, Saleem JJ, Russ AL, Jones J, Russell SA, Chumbler NR. Lessons learned from usability testing of the VA’s personal health record. J Am Med Inform Assoc. 2011; 18. Suppl 1(Suppl 1):i13–7.
crossref

Figure 1
Factors associated with online portal adoption.
hir-26-3-220f1.gif
Figure 2
Study inclusion criteria flow diagram.
hir-26-3-220f2.gif
Figure 3
Comparing the total population with social media use, patient portal use, and trust issues.
hir-26-3-220f3.gif
Table 1
Study population characteristics (n = 2,263)
Characteristic n (%)
Age (yr)
 18–49 923 (40.8)
 50–74 1,224 (54.1)
 ≥75 116 (5.1)

Marital status
 Yes 1,426 (63)
 No 837 (37)

Sex
 Male 828 (36.6)
 Female 1,435 (63.4)

Mental health
 Yes 613 (27.1)
 No 1,650 (72.9)

Education
 High school or less 400 (17.7)
 Some college 1,260 (55.7)
 More than college 603 (26.6)

Medicaid
 Yes 191 (8.4)
 No 2,072 (91.6)

Income
 <$35,000 373 (16.5)
 $35,000–$74,000 723 (31.9)
 ≥$75,000 1,167 (51.6)

Number of people in household
 One person 492 (21.7)
 More than one person 1,771 (78.3)

Online portal use
 Yes 1,481 (65.4)
 No 782 (34.6)

Trust issues
 Yes 510 (22.5)
 No 1,753 (77.5)

Social media
 Yes 1,855 (82.0)
 No 408 (18.0)

Chronic disease
 Yes 1,347 (59.5)
 No 916 (40.5)

Health app use
 Yes 1,339 (59.2)
 No 924 (40.8)
Table 2
Logistic regression of online portal use associated with each variable
Characteristic Total (n = 2,263) Online portal use (D4/D6) OR (CI) p-value

Yes (n = 1,481) No (n = 782)
Age (yr)
 18–49 (ref) 923 (100) 615 (66.6) 308 (33.4) -
 50–74 1,224 (100) 791 (64.6) 433 (35.4) 1.069 (0.869–1.315) 0.527
 ≥75 116 (100) 75 (64.7) 41 (35.3) 1.456 (0.930–2.279) 0.100

Marital status
 Yes (ref) 1,426 (100) 952 (66.8) 472 (33.2)
 No 837 (100) 529 (63.2) 308 (36.8) 1.021 (0.796–1.310) 0.872

Sex
 Male (ref) 828 (100) 539 (65.1) 289 (34.9) -
 Female 1,435 (100) 942 (65.6) 496 (34.4) 0.979 (0.808–1.187) 0.832

Mental health*
 Yes (ref) 613 (100) 416 (67.9) 197 (32.1) -
 No 1,650 (100) 1,065 (64.5) 585 (35.5) 0.789 (0.638–0.976) 0.029

Education
 High school or less (ref) 400 (100) 226 (56.5) 174 (43.5) -
 Some college 1,260 (100) 821 (65.2) 439 (34.8) 1.269 (0.996–1.616) 0.054
 More than college 603 (100) 434 (72.0) 169 (28.0) 1.540 (1.155–2.052) 0.003

Medicaid
 Yes (ref) 191 (100) 110 (57.6) 81 (42.4) -
 No 2,072 (100) 1,371 (66.2) 701 (33.8) 0.921 (0.650–1.305) 0.644

Income*
 <$35,000 (ref) 373 (100) 195 (52.3) 178 (47.7) -
 $35,000–$74,000 723 (100) 450 (62.2) 273 (37.8) 1.521 (1.145–2.020) 0.004
 ≥$75,000 1,167 (100) 836 (71.6) 331 (28.4) 2.225 (1.644–3.012) 0.000

Trust issues
 Yes (ref) 510 (100) 323 (63.3) 187 (36.7) -
 No 1,753 (100) 1,158 (66.1) 593 (33.9) 1.133 (0.916–1.403) 0.250

Social media**
 Yes (ref) 1,855 (100) 1,265 (68.2) 590 (31.8) -
 No 408 (100) 216 (52.9) 192 (47.1) 0.554 (0.438–0.699) 0.000

Number of people in household
 One person (ref) 492 (100) 179 (63.6) 313 (36.4) -
 More than one person 1,771 (100) 1,168 (66.0) 603 (34.0) 0.899 (0.679–1.190) 0.457

Chronic disease
 Yes (ref) 1,347 (100) 880 (65.3) 467 (34.7) -
 No 913 (100) 601 (65.6) 315 (34.4) 0.841 (0.688–1.029) 0.093

Health app**
 Yes (ref) 1,339 (100) 957 (67.9) 382 (32.1) -
 No 924 (100) 524 (64.5) 400 (35.5) 0.495 (0.495–0.718) 0.000

Values are presented as number (%).

OR: odds ratio, CI: confidence interval, ref: reference category.

All odd ratios are significant (*p < 0.05, **p < 0.001).

TOOLS
Similar articles