Journal List > Healthc Inform Res > v.26(3) > 1144867

Syed, Baghal, Prior, Zozus, Al-Shukri, Syeda, Garza, Begum, Gates, Syed, and Sexton: Toolkit to Compute Time-Based Elixhauser Comorbidity Indices and Extension to Common Data Models

Abstract

Objectives

The time-dependent study of comorbidities provides insight into disease progression and trajectory. We hypothesize that understanding longitudinal disease characteristics can lead to more timely intervention and improve clinical outcomes. As a first step, we developed an efficient and easy-to-install toolkit, the Time-based Elixhauser Comorbidity Index (TECI), which pre-calculates time-based Elixhauser comorbidities and can be extended to common data models (CDMs).

Methods

A Structured Query Language (SQL)-based toolkit, TECI, was built to pre-calculate time-specific Elixhauser comorbidity indices using data from a clinical data repository (CDR). Then it was extended to the Informatics for Integrating Biology and the Bedside (I2B2) and Observational Medical Outcomes Partnership (OMOP) CDMs.

Results

At the University of Arkansas for Medical Sciences (UAMS), the TECI toolkit was successfully installed to compute the indices from CDR data, and the scores were integrated into the I2B2 and OMOP CDMs. Comorbidity scores calculated by TECI were validated against: scores available in the 2015 quarter 1–3 Nationwide Readmissions Database (NRD) and scores calculated using the comorbidities using a previously validated algorithm on the 2015 quarter 4 NRD. Furthermore, TECI identified 18,846 UAMS patients that had changes in comorbidity scores over time (year 2013 to 2019). Comorbidities for a random sample of patients were independently reviewed, and in all cases, the results were found to be 100% accurate.

Conclusions

TECI facilitates the study of comorbidities within a time-dependent context, allowing better understanding of disease associations and trajectories, which has the potential to improve clinical outcomes.

I. Introduction

The management of medically complex individuals, those with multiple coexisting diseases known as comorbidities, is vital to the United States healthcare system due to the significant impact of comorbidities on health outcomes, clinical management, and increased healthcare costs [1]. The term comorbidity is defined as a pre-existing medical condition unrelated to the primary reason for a patient’s hospitalization, ideally excluding complications acquired during the hospital stay or later treatment [2,3]. Treating and managing comorbidities is challenging because one comorbidity may exacerbate another, thereby increasing care complexity. When providing care for such patients for the primary condition, a balanced treatment plan that includes comorbidity management should be devised [4]. Comorbidities impact the quality of life of patients and are often associated with increased rates of functional decline and mortality [5].
Two-thirds of Medicare spending is devoted to medically complex patients with four or more chronic conditions, with costs increasing exponentially as the number of comorbidities increases [6]. Those that develop more comorbidities over time have worse health outcomes, and the rise in comorbidities is an important predictor of high-risk events [7]. To determine the trajectory of a medical condition, it is important to identify time-related disease associations in population-based studies to define the temporal relationship of comorbidity development [8]. Time-based comorbidity network identification could potentially allow for interruption of these networks at key times and improve clinical outcomes by altering the trajectory of disease [9].
Patient comorbidities are generally quantified by using diagnosis-based indices or scores, such as the Elixhauser Comorbidity Index (ECI) and Charlson Comorbidity Index (CCI) [10,11]. The ECI includes 31 conditions, and it was originally developed to predict in-hospital mortality, hospital charges, and length of stay [11,12]. The ECI is based on the International Classification of Diseases, 9th and 10th Edition codes (ICD-9, ICD-10) and the Medicare Severity Diagnosis Related Groups (MS-DRGs) found in hospital administrative data [2]. Van Walraven et al. [13] condensed the ECIs of 21 conditions into a single numeric score, known as the Van Walraven (VW) score. Each comorbidity is assigned a weight between −7 and 12, and the VW score is then calculated as the sum of the weights. The VW score has been proven to predict high-risk events, such as hospital mortality [13].
In general, ECI and VW scores are not readily available within Electronic Health Record (EHR) systems because they are not used routinely in real-time clinical care. Generally, scoring systems are only applied in retrospective studies as a means to measure population severity of illness. As medicine moves into real-time decision support, having integrated scoring systems will allow for more robust discussions of risk with patients and for better outcome prediction [2].
Typically, study specific data are extracted from EHRs, and then indices are calculated using statistical software packages, such as SAS (SAS Institute, Cary, NC, USA), or Structured Query Language (SQL) tools developed by Epstein and Dexter [2]. The Agency for Healthcare Research and Quality’s (AHRQ) Healthcare Cost and Utilization Project (HCUP) provides ASCII text versions of the SAS software to compute ECIs [2,14]. The HCUP comorbidity tool calculates indices on hospital administrative databases, such as the National Inpatient Sample (NIS) and National Readmission Database (NRD), to perform longitudinal analyses [15]. However, the comorbidity tools provided by the HCUP [14] and Epstein and Dexter [2] calculate indices based on data available at a single time-point, not accounting for the rise in scores over time that may affect the outcome of interest [1618]. Moreover, these tools are dependent on MS-DRG versions and can only be used to compute comorbidities in studies that are confined to one fiscal year.
To facilitate clinical and translational research, institutional data from EHRs and other related systems are often integrated into a common storage area, such as a clinical data repository (CDR) or clinical data warehouse (CDW). CDRs contain detailed, patient-centered information that can be used for retrospective analyses, cohort discovery, and providing data feeds to multi-institutional research data networks. The cornerstone of facilitating multi-site collaborations is to enhance data sharing, which is often achieved using common data models (CDMs). CDMs are used to standardize shared data by specifying the format, structure, and content to simplify exchange, pooling, or storage of data from multiple sources [19].
Within the last decade, several CDMs, such as the Informatics for Integrating Biology and the Bedside (I2B2) and Observational Medical Outcomes Partnership (OMOP) models, have been collaboratively developed for multi-organization research [19]. Each of these models is an improvement from the wide variety of non-standard CDRs [20]. The OMOP CDM offers the highest domain coverage by representing and analyzing EHR data [19]. The I2B2 is the most widely adopted CDM due to the flexibility of representing non-standard and local data [20,21]. Extending CDMs to accommodate ECIs will provide the ability to easily identify clinical comorbidities and complications in multi-site studies. To the best of our knowledge, not previous study has extended ECIs into CDMs. In addition, real-time availability of the indices in EHRs will aid clinicians in making evidence-based decisions by providing another measure for real-time risk stratification.
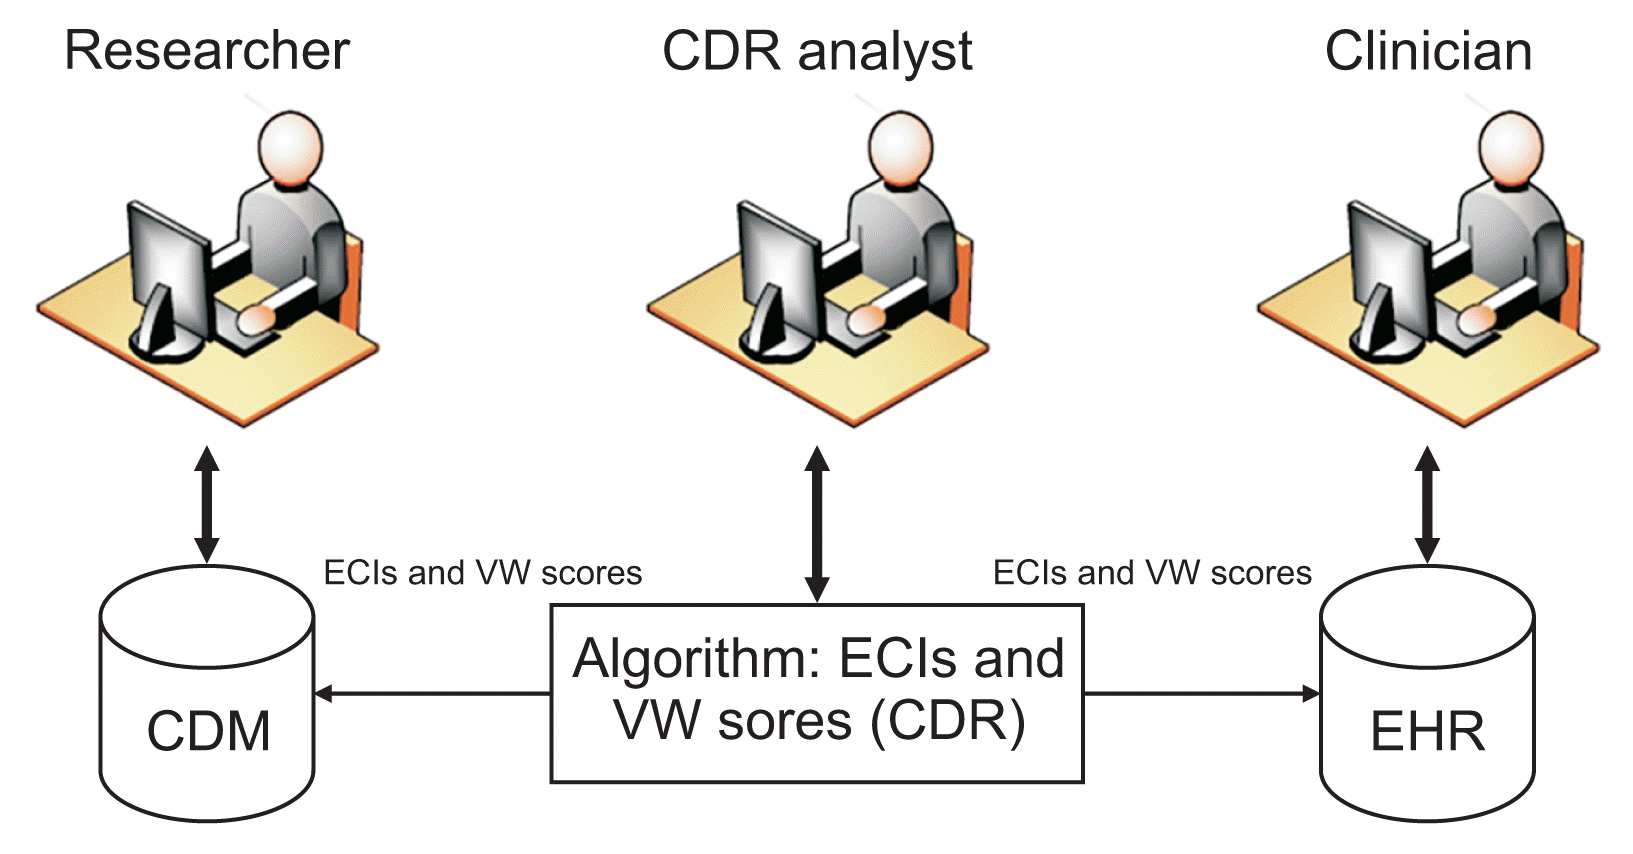
In this paper, we describe the development and validation of an ECI toolkit (TECI, time-based Elixhauser Comorbidity Index) for computing time-specific ECIs and VW scores. In addition, we propose a strategy to expand and integrate the comorbidity indices into the I2B2 and OMOP CDMs. The scores can be incorporated into Electronic Medical Records (EMRs) for real-time medical decision-making as shown in Figure 1. For quick implementation and distribution to the larger research community, we have made the TECI toolkit available through GitHub (https://github.com/UAMS-DBMI/TECI-Toolkit).

II. Methods

The Institutional Review Board (IRB) classified this study as exempt and approved this project. Patients data used were obtained under IRB approval (No. 260989) at the University of Arkansas for Medical Sciences (UAMS). Resources for this study was provided by the Arkansas Clinical Data Repository (AR-CDR) maintained by the Department of Biomedical Informatics in the College of Medicine at the UAMS.
We built the TECI toolkit to calculate time-based ECIs and VW scores, and extended its application to two commonly used CDMs in the AR-CDR. The AR-CDR was created in 2011 to fulfill organizational research needs. Two self-service cohort estimation tools, I2B2 and TriNetX (http://www.trinetx.com), were deployed shortly thereafter. The design of the toolkit was based on the AHRQ’s HCUP ECI software (SAS algorithm, v2020.1) [14] and the ECI algorithm (SQL code) developed by Epstein and Dexter [2]. Functionality was extended to compute time-based comorbidity scores.
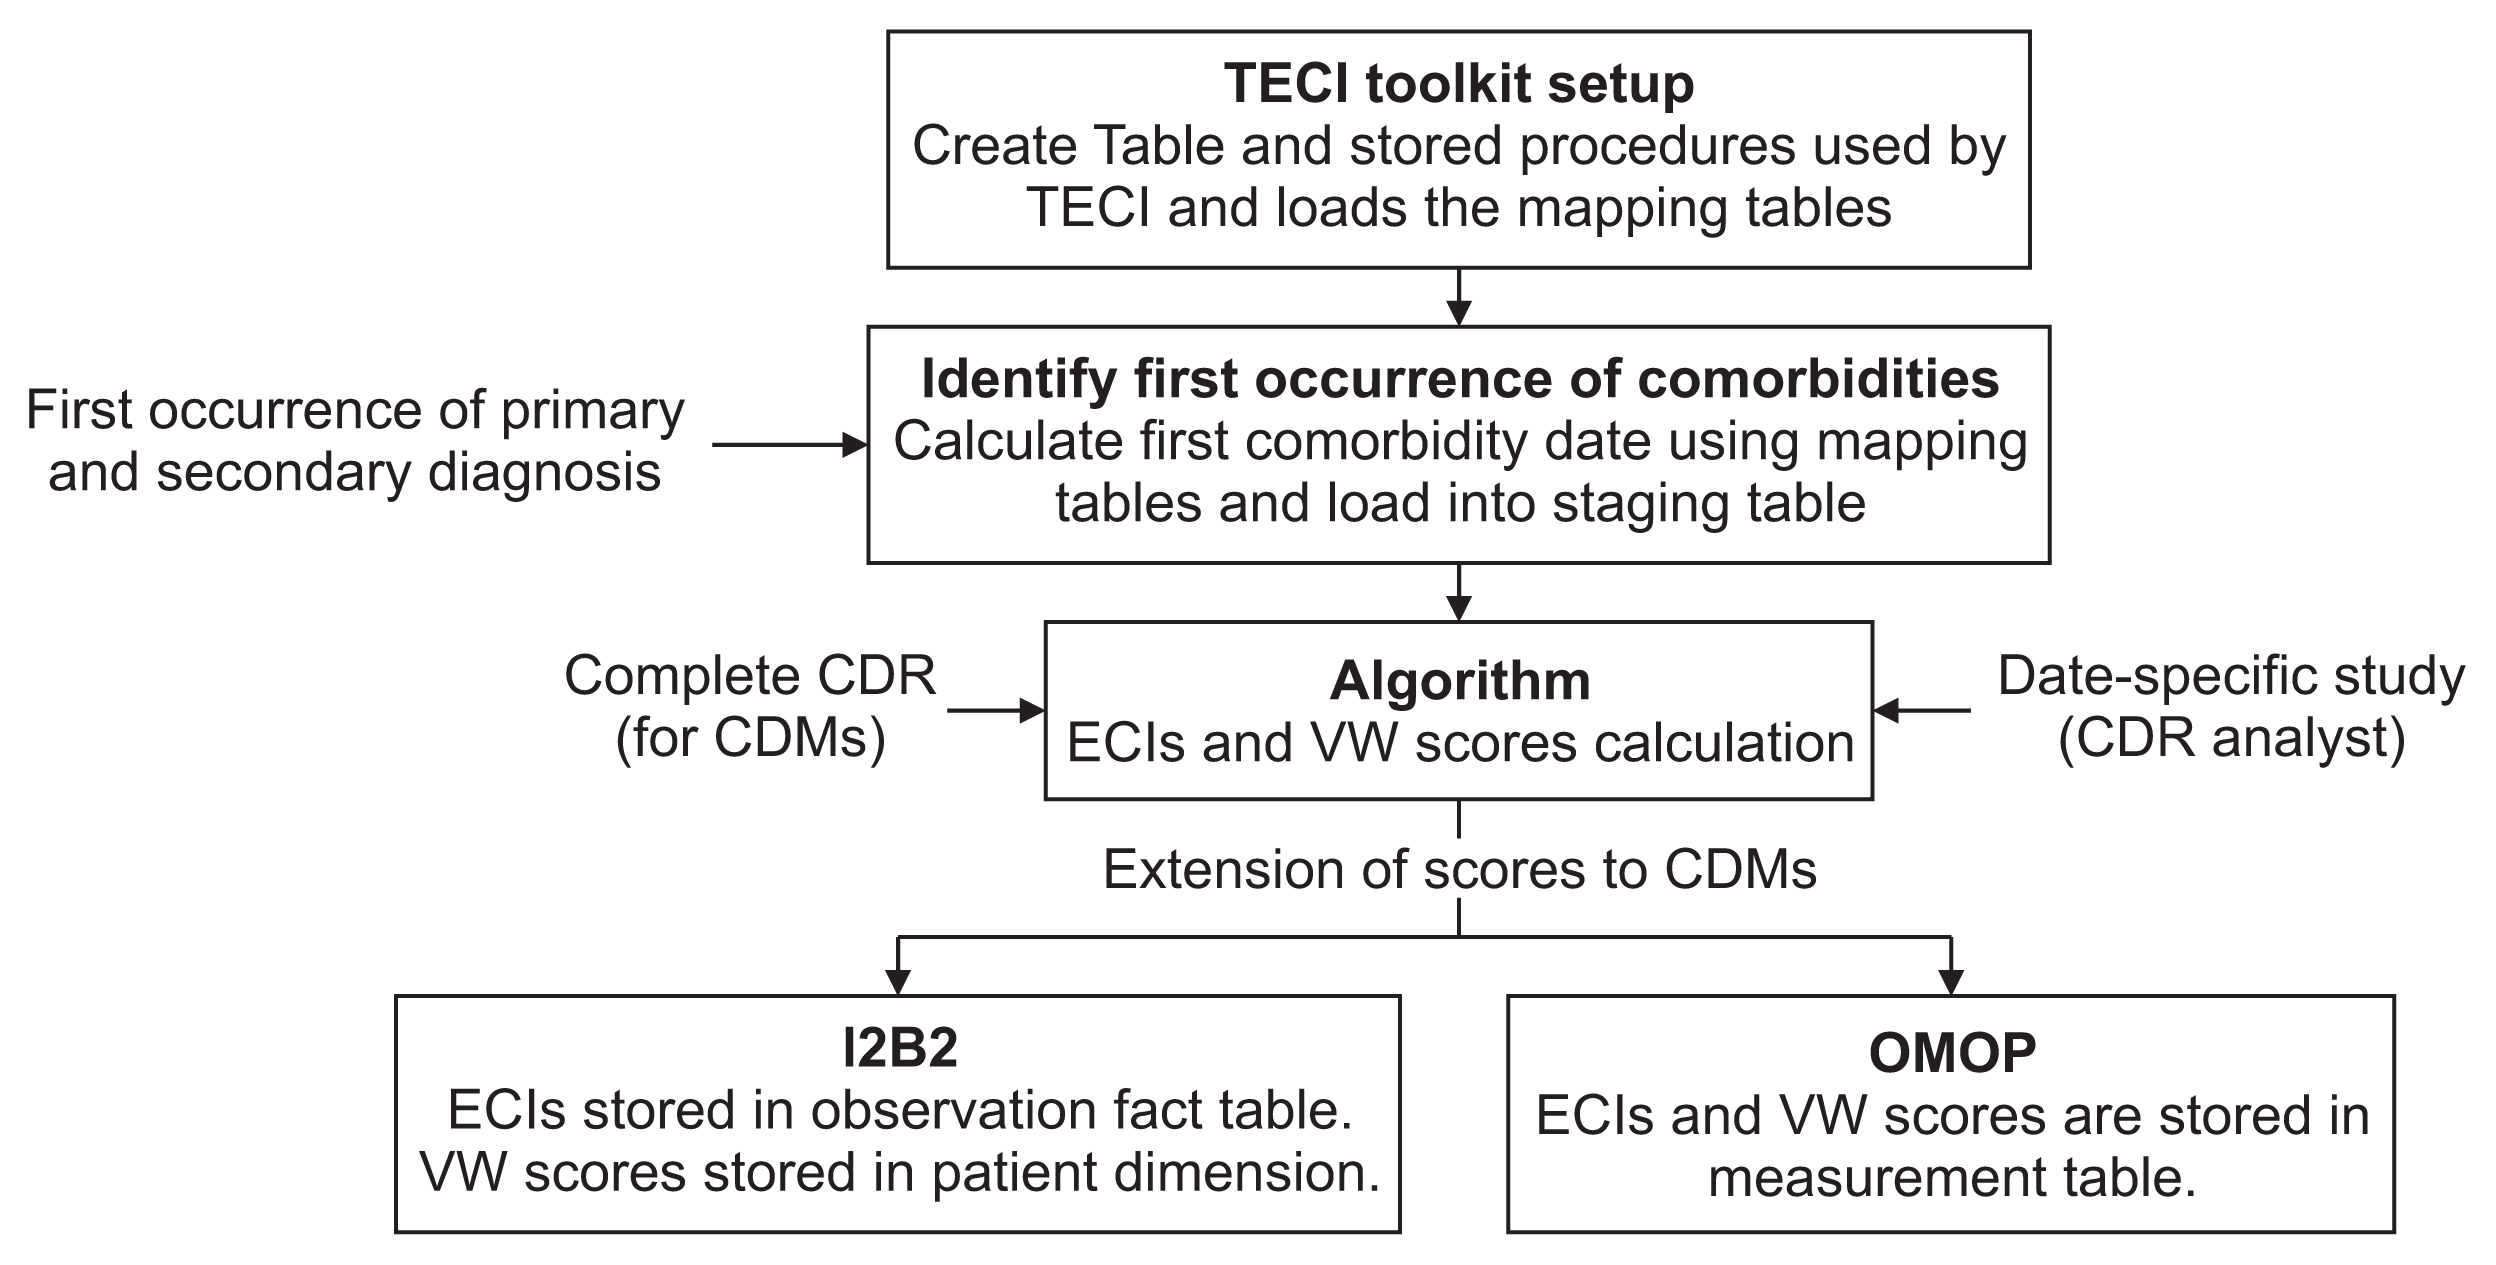
The TECI algorithm is housed within the AR-CDR and is composed of two mechanisms: (1) one to setup and calculate ECIs using CDR data and (2) another to integrate ECIs into CDMs to facilitate the use of these indices as shown in Figure 2.

1. TECI Setup and Algorithm

1) TECI toolkit setup

Initially, the TECI toolkit creates database objects that will be used to calculate and store ECIs within the CDR. The objects created by the toolkit include (1) source tables to receive patients diagnoses and MS-DRGs records, (2) mapping tables that will hold MS-DRGs and diagnosis codes associated with each comorbidity, and (3) the output table to store computed ECIs and VW scores. For a detailed list of the objects refer to Supplementary A.
TECI populates the mapping tables with ICD-9, ICD-10, and MS-DRG codes corresponding to the ECIs [22]. As MS-DRGs are updated annually, the validity of each MS-DRG code is considered while the comorbidities score is computed. Currently, TECI supports MS-DRG versions 25 to 37. For future MS-DRG releases, mapping tables should be updated (refer to Supplementary B).

2) Identify first occurrence of comorbidities

The process for identifying the initial occurrences of comorbidities begins by receiving the first instance of a patient’s diagnosis code(s) and/or MS-DRG(s) using the mapping tables. To help streamline the process, patient records received should adhere to the specifications outlined in Table 1. Based on the received data, the comorbidities identified for all CDR patients are stored in a staging table, “teci_stg_patient_comorb”.

3) ECIs and VW scores algorithm

The process utilizes the patient’s first occurrence of Elixhauser comorbidities stored in the staging table (teci_stg_patient_comorb) to calculate and store time-specific ECIs and VW scores in the output table “teci_eci_vw_scores”. The process of identifying the first occurrence of comorbidities and then computing indices has a two-fold advantage: (1) the scores can be calculated on an entire CDR patient-set, which can feed EHRs and CDMs to facilitate near real-time patient treatment and multi-site collaborative research, and (2) the scores can also be calculated on-demand for date-specific studies.

2. Extension of ECIs and VW Scores to CDMs

The ECIs and VW scores calculated using the CDR dataset can be leveraged to CDMs. The TECI toolkit offers scripts to integrate the calculated indices into I2B2 and OMOP (refer to script in Supplementary C).

1) I2B2 extension

TECI’s I2B2 script adds a new column “vw_score” to the patient_ dimension table for storing the patient’s VW score [23]. The VW score will be calculated as of the date when the CDR data was loaded into I2B2 (also referred to as the I2B2 refresh date). Table 2 shows a modified patient dimension table to accommodate VW scores.
The patient’s comorbidities that are stored in the staging table (teci_stg_patient_comorb) are transformed and represented as rows in I2B2’s observation fact table [23]. Each row includes seven elements that together form a composite primary key of the fact table as shown in Table 3. To differentiate between primary and secondary comorbidities, “modifier_cd” column values are labeled as “1” and “2”, respectively. The TECI toolkit offers a taxonomy to query ECIs and VW scores (refer to Supplementary D).

2) OMOP extension

The measurement table within the OMOP v6.1 CDM contains both orders placed for and results of a patient’s examination(s) [24]. TECI stores ECIs and VW scores in the measurement table because this table is designed to store CCIs [25]. The first occurrence of a patient’s comorbidities computed by TECI are transformed and represented as a row in the measurement table. Similar to I2B2, the VW score is calculated as of the OMOP refresh date and is stored as a record in the table. Table 4 shows an OMOP measurement table that includes three comorbidities (hypertension, obesity, and psychoses) and VW scores for a patient. As there are no standard vocabularies for ECIs and VW scores, they are mapped to non-matching concept codes (concept_id = 0) [24,26].

III. Results

The TECI toolkit was validated by a 3-step approach as shown in Table 5. First, we compared the comorbidity scores computed by TECI (using 2015 quarter 1 [Q1]–quarter 3 [Q3] NRD data that has ICD-9 codes) to the readily available scores in the NRD, which were computed using HCUP’s comorbidity tool [27]. Because TECI computes patient-level comorbidity scores and the HCUP software computes them on hospital admissions, for validation, we excluded patients that had multiple admissions, resulting in 7,964,177 admission records. For the selected admission records, comorbidity scores were calculated using TECI and compared to those of NRD, for which we found the accuracy to be 100%.
Second, we compared the comorbidity scores calculated by TECI to those computed by the SQL algorithm by Epstein and Dexter [2] using 2015 quarter 4 (Q4) NRD data that includes ICD-10 codes [28]. Again, patients having multiple admission records were excluded, resulting in 1,243,644 total admissions. We computed ECIs and VW scores on the selected dataset using the algorithm developed by Epstein and Dexter [2]. A similar calculation was done by TECI using HCUP v3.7 DRGs and ICD diagnosis codes, the same codes used by Epstein and Dexter [2]. The output from both methods were compared, and the measured accuracy was 100%.
Finally, to validate overtime changes in the comorbidity scores identified by TECI, we first calculated UAMS patients’ ECI between 2013 and 2016, and then for the same patients, the ECI from 2017 to 2019 was computed. We found that 18,846 patients had overtime changes in comorbidity scores from year 2013 to 2019. To confirm the changes in the scores, a random sample of 200 patients was manually reviewed by clinician (KS) and informaticists (MS, AS, KG, and SS); we found our software to be 100% accurate.

IV. Discussion

This paper described the development and validation of the TECI toolkit that pre-calculates time-based comorbidities on CDR data with high efficiency. TECI integrates comorbidity scores into CDRs and can be readily queried without having to deal with the complexity behind the score calculation. This reduces the time it takes to fulfill a data request by avoiding tedious computations for every single study. From July 2017 to June 2018, 40 research data requests that asked for ECIs were fulfilled by AR-CDR. Since the implementation of the TECI toolkit, the turnaround time for requests was reduced by an average of 6.5 hours per request.
Time is a crucial parameter in the assessment of comorbidities in population-based studies, as time identifies the rapidity with which more complex disease patterns evolve [8]. Increasing numbers of comorbidities is an important predictor of high-risk events, including mortality [7,8]. Current data is lacking, however, on the timing of comorbid illness development and the time to a high-risk event like mortality. This is potentially one of the driving forces behind over 25% of Medicare spending occurring within 1 year of death [29]. TECI identified 18,846 UAMS patients that had changes in comorbidity scores over time (year 2013 to 2019). Such findings cannot be easily achieved using HCUP SAS comorbidity software [14] nor using the SQL code from Epstein and Dexter [2]. Furthermore, based on physician’s feedback, our future development aims to provide these scores in the EHR.
For multi-organization research, CDMs are often used when there is a need to exchange or share a set of data. Integrating comorbidities into CDMs will provide better understanding of comorbidities and their assessment within clinical, epidemiological, and economic contexts. Multi-site comparisons of such assessments are of major interest to improve disease management and reduce associated healthcare costs [8]. TECI enables the expansion of I2B2 and OMOP by integrating ECIs and VW scores for collaborative research. Risk adjustment is the foundation of medical decision-making, and incorporating TECI data into the EMR will provide clinicians a time-relevant snapshot of the disease complexity of the patient, including recent worsening of health status. This would enhance medical decision making for complex medical patients and facilitate improved outcomes.
In general, CDMs are used for data sharing in multi-site studies, and comorbidity scores (ECIs and VW) can be computed using data from CDMs. However, we choose to compute the scores on CDRs and then extend the score to CDMs for two reasons: (1) CDRs are commonly used to fulfill research data requests, and (2) CDMs typically hold subsets of data for specific data needs [19].
A limitation of our toolkit is that it does not account for a patient’s problem list while calculating the comorbidities score. The decision to exclude problem list data was made due to the unreliable nature of the data because problem lists captured in most healthcare systems are frequently inaccurate and out-of-date, and their use varies widely across providers [30]. However, if problem lists are accurate, TECI can incorporate them as secondary diagnoses for score calculations. Another limitation was that, for the OMOP extension, ECIs and VW scores were not mapped to standard vocabularies and were instead stored as non-standard measurements due to the complexity of building vocabularies.
In research and care quality management, comorbidity trajectory is a vital predictor of a patient’s health condition. The TECI toolkit calculates ECIs and VW scores on large data repositories, enabling the identification of longitudinal changes in comorbidities, and it can expand scores to CDMs for multi-site collaborative research. To the best of our knowledge, this is first toolkit that calculates time-specific ECIs and VW scores. TECI also has the potential to feed EHRs for near real-time patient care.

Supplementary Information

Acknowledgments

This work was supported by National Center for Advancing Translational Sciences UL1 TR003107.

Notes

Conflict of Interest

No potential conflict of interest relevant to this article was reported.

Supplementary Materials

Supplementary materials can be found via https://doi.org/10.4258/hir.2020.26.3.193.

References

1. Valderas JM, Starfield B, Sibbald B, Salisbury C, Roland M. Defining comorbidity: implications for understanding health and health services. Ann Fam Med. 2009; 7(4):357–63.
crossref
2. Epstein RH, Dexter F. Development and validation of a structured query language implementation of the Elixhauser comorbidity index. J Am Med Inform Assoc. 2017; 24(4):845–50.
crossref
3. Kattoor AJ, Pothineni NV, Goel A, Syed M, Syed S, Paydak H, et al. Prescription patterns and outcomes of patients with atrial fibrillation treated with direct oral anticoagulants and warfarin: a real-world analysis. J Cardiovasc Pharmacol Ther. 2019; 24:428–34.
crossref
4. Tinker A. How to improve patient outcomes for chronic diseases and comorbidities [Internet]. Salt Lake City (UT): HealthCatalyst;2017. [cited at 2020 Apr 15]. Available from: http://www.healthcatalyst.com/wp-content/uploads/2014/04/How-to-Improve-Patient-Outcomes.pdf.
5. Zulman DM, Asch SM, Martins SB, Kerr EA, Hoffman BB, Goldstein MK. Quality of care for patients with multiple chronic conditions: the role of comorbidity interrelatedness. J Gen Intern Med. 2014; 29(3):529–37.
crossref
6. Wolff JL, Starfield B, Anderson G. Prevalence, expenditures, and complications of multiple chronic conditions in the elderly. Arch Intern Med. 2002; 162(20):2269–76.
crossref
7. Fraccaro P, Kontopantelis E, Sperrin M, Peek N, Mallen C, Urban P, et al. Predicting mortality from changeover-time in the Charlson Comorbidity Index: a retrospective cohort study in a data-intensive UK health system. Medicine (Baltimore). 2016; 95(43):e4973.
8. Giannoula A, Gutierrez-Sacristan A, Bravo A, Sanz F, Furlong LI. Identifying temporal patterns in patient disease trajectories using dynamic time warping: a population-based study. Sci Rep. 2018; 8(1):4216.
crossref
9. Jensen AB, Moseley PL, Oprea TI, Ellesoe SG, Eriksson R, Schmock H, et al. Temporal disease trajectories condensed from population-wide registry data covering 6.2 million patients. Nat Commun. 2014; 5:4022.
crossref
10. McPhail SM. Multimorbidity in chronic disease: impact on health care resources and costs. Risk Manag Healthc Policy. 2016; 9:143–56.
crossref
11. Elixhauser A, Steiner C, Harris DR, Coffey RM. Comorbidity measures for use with administrative data. Med Care. 1998; 36(1):8–27.
crossref
12. Menendez ME, Neuhaus V, van Dijk CN, Ring D. The Elixhauser comorbidity method outperforms the Charlson index in predicting inpatient death after orthopaedic surgery. Clin Orthop Relat Res. 2014; 472(9):2878–86.
crossref
13. Van Walraven C, Austin PC, Jennings A, Quan H, Forster AJ. A modification of the Elixhauser comorbidity measures into a point system for hospital death using administrative data. Med Care. 2009; 47(6):626–33.
crossref
14. Healthcare Cost and Utilization Project. Creation of Elixhauser comorbidity variables (ICD-10-CM Elixhauser comorbidity software, version 2020. 1) [Internet]. Rockville (MD): Healthcare Cost and Utilization Project;2019. [cited at 2020 Apr 15]. Available from: https://www.hcup-us.ahrq.gov/toolssoftware/comorbidityicd10/comoanaly_icd10cm_2020_1.txt.
15. Healthcare Cost and Utilization Project. Nationwide HCUP databases [Internet]. Agency for Healthcare Research and Quality [Internet]. Rockville (MD): Healthcare Cost and Utilization Project;2019. [cited at 2020 Apr 15]. Available from: https://www.hcup-us.ahrq.gov/databases.jsp.
16. Wang CY, Baldwin LM, Saver BG, Dobie SA, Green PK, Cai Y, et al. The contribution of longitudinal comorbidity measurements to survival analysis. Med Care. 2009; 47(7):813–21.
crossref
17. Zeng C, Ellis JL, Steiner JF, Shoup JA, McQuillan DB, Bayliss EA. Assessment of morbidity over time in predicting health outcomes. Med Care. 2014; Mar. 52:Suppl 3. S52–9.
crossref
18. Strauss VY, Jones PW, Kadam UT, Jordan KP. Distinct trajectories of multimorbidity in primary care were identified using latent class growth analysis. J Clin Epidemiol. 2014; 67(10):1163–71.
crossref
19. Garza M, Del Fiol G, Tenenbaum J, Walden A, Zozus MN. Evaluating common data models for use with a longitudinal community registry. J Biomed Inform. 2016; 64:333–41.
crossref
20. Klann JG, Phillips LC, Herrick C, Joss MA, Wagholikar KB, Murphy SN. Web services for data warehouses: OMOP and PCORnet on i2b2. J Am Med Inform Assoc. 2018; 25(10):1331–8.
crossref
21. Klann JG, Joss MAH, Embree K, Murphy SN. Data model harmonization for the All Of Us Research Program: transforming i2b2 data into the OMOP common data model. PLoS One. 2019; 14(2):e0212463.
crossref
22. Quan H, Sundararajan V, Halfon P, Fong A, Burnand B, Luthi JC, et al. Coding algorithms for defining comorbidities in ICD-9-CM and ICD-10 administrative data. Med Care. 2005; 43(11):1130–9.
crossref
23. Klann JG, Abend A, Raghavan VA, Mandl KD, Murphy SN. Data interchange using i2b2. J Am Med Inform Assoc. 2016; 23(5):909–15.
crossref
24. Reich C, Ryan P, Belenkaya R, Natarajan K, Blacketer C. OMOP Common Data Model v6.0 Specifications [Internet]. [place unknown]: Github.com;2018. [cited at 2020 Apr 15]. Available from: https://github.com/OHDSI/CommonDataModel/wiki.
25. Observational Health Data Sciences and Informatics. Athena standardized vocabularies [Internet]. Bethesda (MD): Observational Health Data Sciences and Informatics;2018. [cited at 2020 Apr 15]. Available from: http://athena.ohdsi.org/search-terms/terms?conceptClass=Staging+%2F+Scales&page=1&pageSize=15&query=comorbid.
26. Makadia R, Ryan PB. Transforming the premier perspective hospital database into the Observational Medical Outcomes Partnership (OMOP) common data model. EGEMS (Wash DC). 2014; 2(1):1110.
27. Healthcare Cost and Utilization Project. NRD file specifications-2013 [Internet]. Rockville (MD): Healthcare Cost and Utilization Project;2015. [cited at 2020 Apr 15]. Available from: https://www.hcup-us.ahrq.gov/db/nation/nrd/nrdfilespecs.jsp.
28. Healthcare Cost and Utilization Project. NRD file specifications-2015 [Internet]. Rockville (MD): Healthcare Cost and Utilization Project;2015. [cited at 2020 Apr 15]. Available from: https://www.hcup-us.ahrq.gov/db/nation/nrd/nrdfilespecs.jsp.
29. Duncan I, Ahmed T, Dove H, Maxwell TL. Medicare cost at end of life. Am J Hosp Palliat Care. 2019; 36(8):705–10.
crossref
30. Wright A, Feblowitz J, Maloney FL, Henkin S, Bates DW. Use of an electronic problem list by primary care providers and specialists. J Gen Intern Med. 2012; 27(8):968–73.
crossref

Figure 1
Time-based Elixhauser Comorbidity Index (TECI) toolkit housed in the CDR calculates Elixhauser comorbidity indices (ECIs) and Van Walraven (VW) scores. The indices generated are extended to the I2B2 and OMOP CDMs and the EHR system, facilitating clinical and translational research. CDR: clinical data repository, I2B2: Informatics for Integrating Biology and the Bedside, OMOP: Observational Medical Outcomes Partnership, CDM: common data model, EHR: Electronic Health Record.
hir-26-3-193f1.gif
Figure 2
Workflow representing TECI setup and usage within the clinical data repository (CDR). Upon installation, the first occurrences of comorbidities are identified against the entire CDR. Next, the algorithm calculates ECIs and Van Walraven (VW) scores to be used in CDMs and date-specific studies. TECI: time-based Elixhauser Comorbidity Index, ECI: Elixhauser Comorbidity Index, CDM: common data model, I2B2: Informatics for Integrating Biology and the Bedside, OMOP: Observational Medical Outcomes Partnership.
hir-26-3-193f2.gif
Table 1
Input source table layout to receive patient first instance of diagnosis code(s) and/or MS-DRG(s)
Field name Description Required Example
patient_id Unique patient identifier Yes PID123
code ICD-9, ICD-10 or MS-DRG Yes (remove “.” appearing in ICD codes) V201
code_type ICD or MS-DRG Yes ICD
primary_sec_type Primary or Secondary diagnosis. For MS-DRG, label as primary Yes Secondary
first_disease_date Date of first occurrence of diagnosis/MS-DRG Yes 01-01-2014

MS-DRG: Medicare Severity Diagnosis Related Group, ICD: International Classification of Diseases.

Table 2
Example of modified patient dimension table containing Van Walraven scores
Column name Patient 1 Patient 2
patient_num 1001 1210
vital_status_cd Alive Alive
sex_cd Male Female
race_cd White Asian
vw_score 15 25
Table 3
Example of observation fact table containing Elixhauser comorbidities
Column name Comorbidity 1 Comorbidity 2 Comorbidity 3
encounter_num 50101 42101 73101
patient_num 2001 2001 2001
concept_cd elix:htn_c elix:obese elix:psych
provider_id 301 222 510
start_date 02-15-2014 04-22-2016 08-10-2017
modifier_cd 1 2 1
instance_num 1 1 1
Table 4
Example of measurement table containing Elixhauser comorbidities and Van Walraven (VW) scores
Column name Comorbidity 1 Comorbidity 2 Comorbidity 3 VW score
measurement_id 10000456 10000997 11000987 12000989
visit_occurrence_id 50101 42101 73101 92109
person_id 2001 2001 2001 2001
measurement_date 02-15-2014 04-22-2016 08-10-2017 10-30-2019
measurement_source_value elix:htn_c elix:obese elix:psych vw:score
value_as_number 1 1 1 10
Table 5
Three-step validation of TECI’s results against pre-calculated ECI in HCUP 2013 Q1–Q3 NRD, ECI calculated by Epstein’s SQL algorithm on 2015 Q4 NRD data, and change in UAMS patient’s ECI calculated by chart review
Validation step TECI compared with: Dataset used Total admissions/patients
1 HCUP v3.7 SAS algorithm 2015 Q1–Q3 NRD 7,964,177 admissions
2 Epstein et al. 2015 Q4 NRD 1,243,644 admissions
3 Manual chart review UAMS patients 200 distinct patients

TECI: time-based Elixhauser Comorbidity Index, ECI: Elixhauser Comorbidity Index, HCUP: Healthcare Cost and Utilization Project, SQL: Structured Query Language, NRD: National Readmission Database, UAMS: University of Arkansas for Medical Sciences.

TOOLS
Similar articles