

 PDF
PDF Citation
 Print
Print


I. Introduction
The discharge process is a routine feature in any hospital that takes care of inpatients [1]. The discharge process commences with the treating physician approves the termination of an inpatient course of care. Generally, the process involves the physician informing the patient that he or she will be discharged, preparation of the discharge summary, and bill settlement, after which the patient can leave the hospital. The turnaround time (TAT) for this discharge process covers the time from when the treating physician initiates the discharge until the patient leaves the hospital. Often the discharge process tends to take several hours because of many factors. The time taken for completion of the discharge process maybe extended by bottlenecks due to various factors, such as the number of steps involved in the process, the time taken for the completion of these steps, and interruptions that may hinder the flow of the process. It would be beneficial for hospitals as well as patients to anticipate such time consumption.
The discharge TAT and delays in discharging patients are a long-standing challenge of hospitals [2]. Delays in a hospital’s discharge process lead to further delays in other hospital functions, such as admissions, bed allocations, and transfer of patients. This leads to adverse effects on the reputation of the hospital [3]. Such delays cause overcrowding in admission queues and emergency departments of the hospital as well as ambulance diversions. This can be considered an opportunity loss for the hospital [4].
Having an estimated time given for the discharge process may help the hospital and all the healthcare providers involved in patient care streamline the discharge process and explore further ways to improve hospital services. This study aimed to identify the various features influencing discharge TAT and predict it through machine learning.
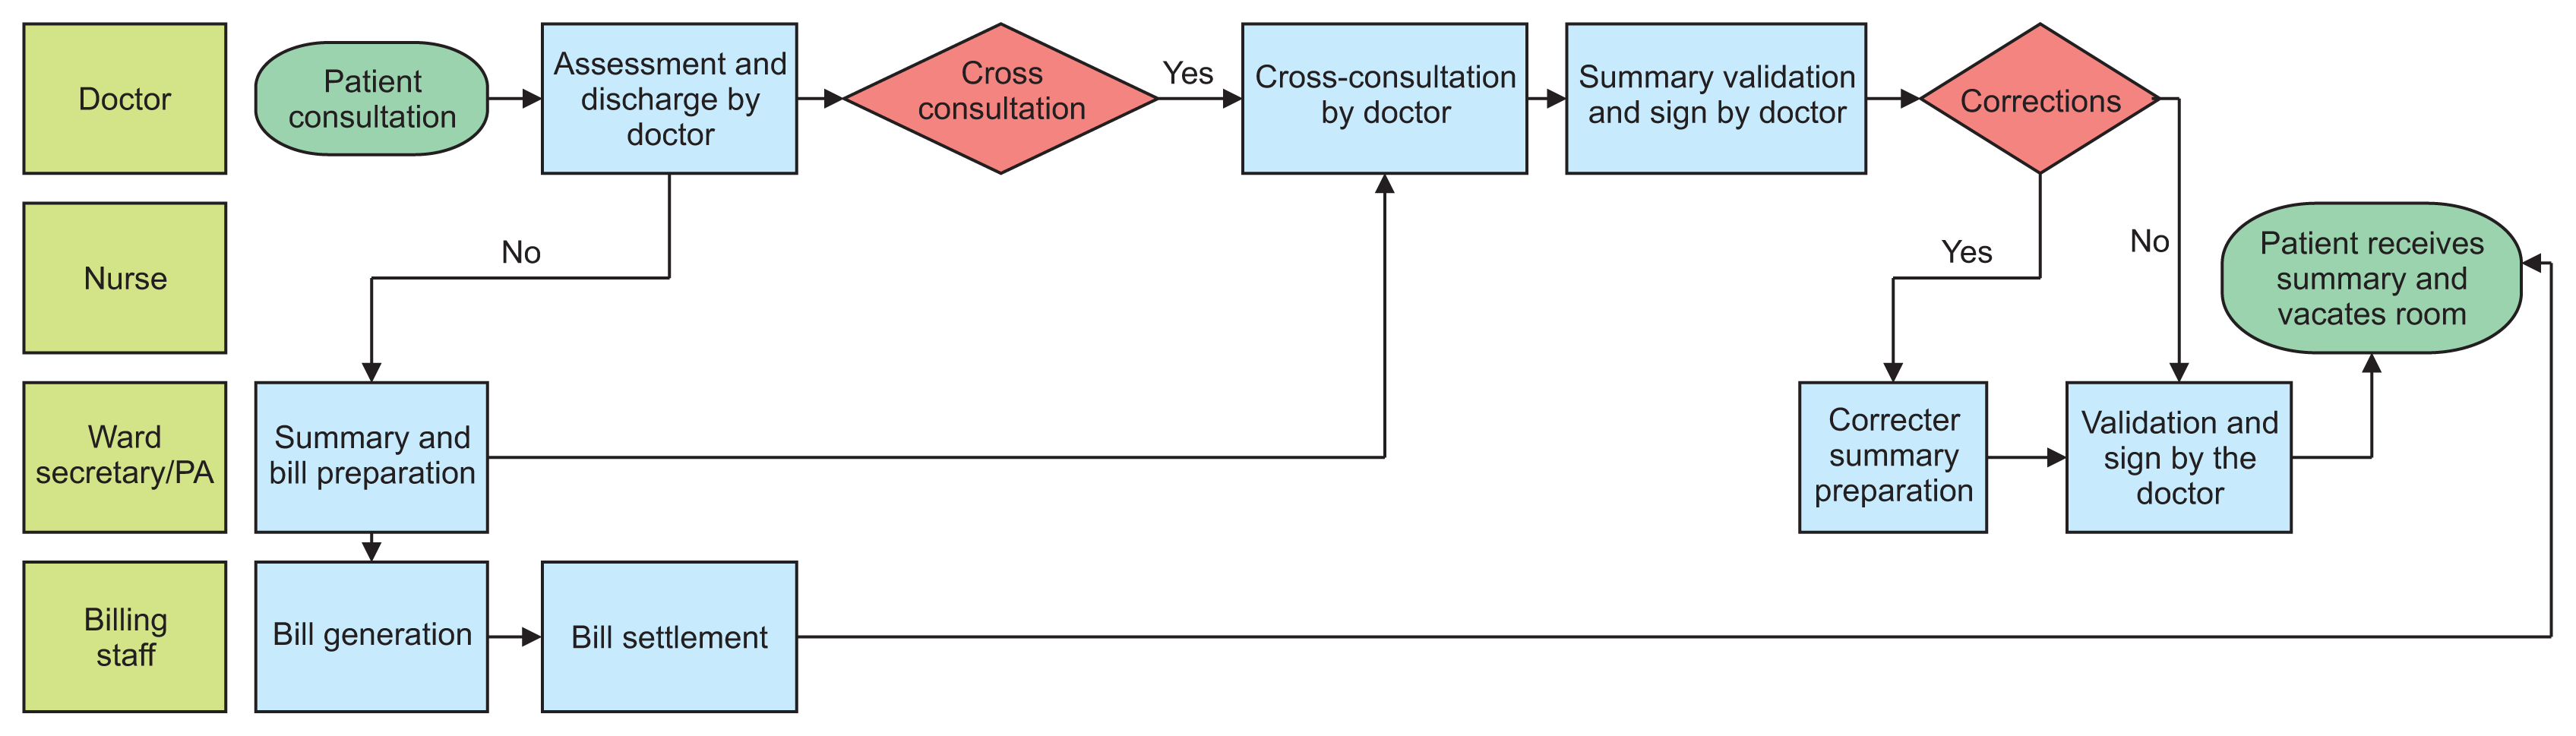
The discharge process usually involves two main stages, first, informing the patient that he or she will be discharged to final summary preparation, and second, bill initiation and clearance [1,5]. The hospital considered in this research was no different. This process involves many activities and many pending tasks, such as last-day investigations and cross-consultations leading to unanticipated and unpredictable delays [6]. The process involved in the study is presented in Figure 1.
In this study, we developed a method for predicting the discharge TAT in a hospital. With this method of TAT prediction, further opportunities to improve the quality of services offered can be explored in the hospital. The proposed method uses multiple linear regression (MLR), which has not been widely explored in the literature.
We focused on addressing operational inefficiencies in handling the administrative processes involved in hospital discharges. Successfully predicting the discharge TAT could help with streamlining various administrative functions of the hospital. Knowing the TAT for each discharge process can help administrators and other staff members anticipate, plan, and execute other dependent functions, such as housekeeping, maintenance, and sterilization of inpatient rooms for the next admission, resulting in a seamless discharge–admission cycle for inpatient beds. Thus, it would be possible to avoid the mismanagement of the aforementioned functions.
This study can provide insight into using machine learning to predict the discharge processing time and its various applications in administrative functions such as planning, resource allocation, and so forth. Therefore, this study can be used as a reference for further studies further exploring various predictive models for estimating discharge TAT and its applications in healthcare settings.
Go to : 
II. Methods
This study was carried out in the cardiology department of a tertiary care hospital based on data collection and observations of all the discharges spanning over a month. This study was completed within 3 months from September to November of 2019.
1. Outcome
The study was divided into two parts.
Part 1
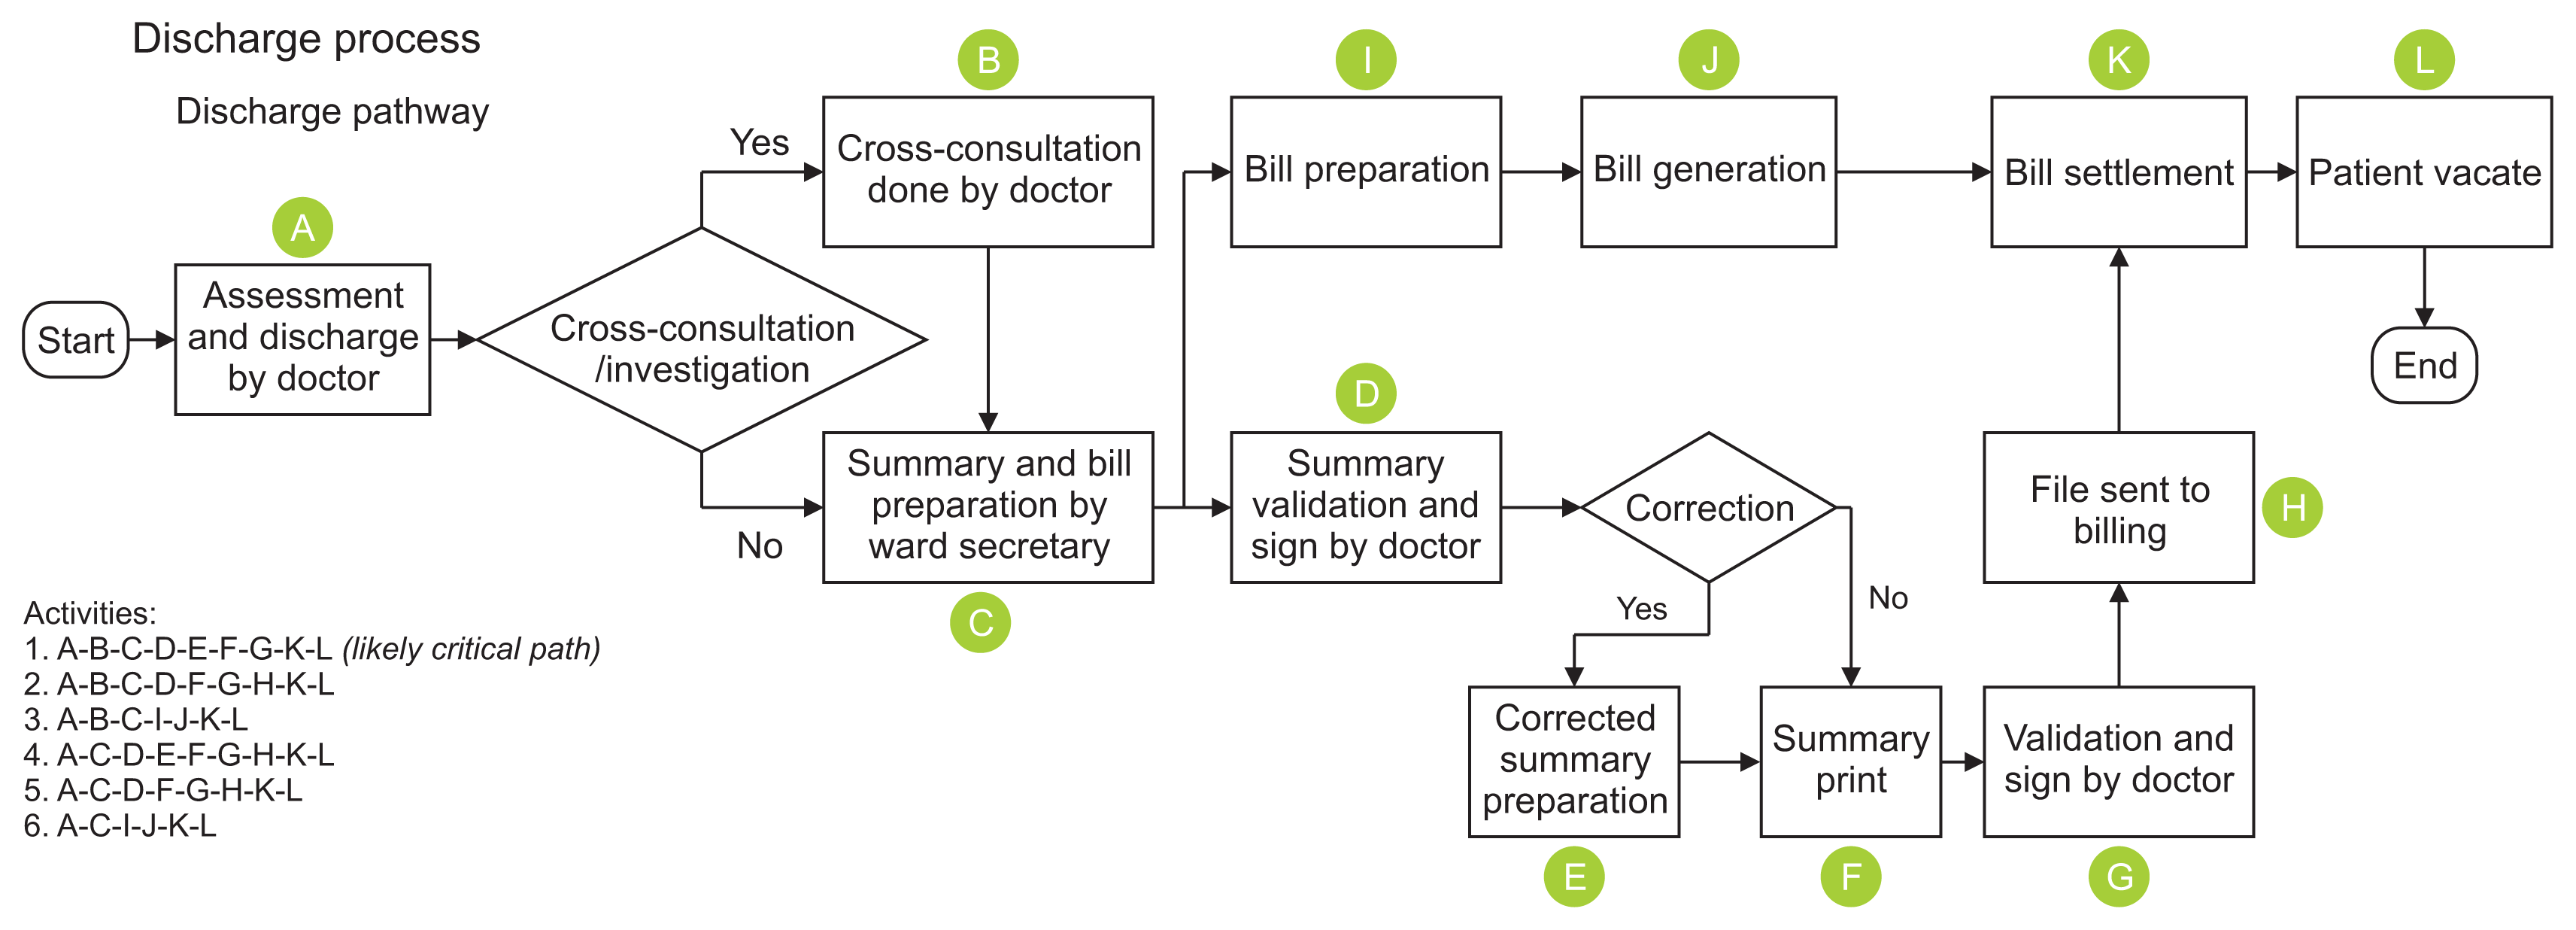
We observed the process-flow of the discharge and then noted the time consumed by each activity. A chart for noting down each activity in the process was prepared, and time taken for each activity was recorded for 108 discharges in the hospital over the course of 1 month. The activities identified are presented in Figure 2. The various factors influencing discharge TAT were identified.
Part 2
The anticipated discharge TAT for each patient was predicted based on the influencing factors identified in Part 1. The time taken for each activity was noted down as shown in Table 1.
Table 1
Activity code in Figure 2 and corresponding activities
![]()
2. Data Collection
Data was collected exhaustively for all 108 discharges that occurred in the span of 1 month in the cardiology department. The data was collected by tracking each discharge process and the time taken for its completion from the hospital’s discharge tracking application.
The discharge process flow used for this study was based on the design created and maintained by the hospital in its standard operating procedure (SOP) documents. The discharge-process design explained above is followed throughout the hospital irrespective of the admitting department.
Part 1
The factors affecting the discharge process were identified through analysis of the discharge process flow. The discharge process is identical and consistently followed throughout the various hospital departments with the aid of a checklist. The checklist includes the various steps of the discharge process (as shown in Figure 2, Table 1). Multiple combination of all these steps as factors were tried and analyzed to find out which of those steps contributed significantly to the discharge TAT. An ANOVA analysis was done to find out the factors contributing to the variance in time taken for discharge.
Part 2
For the creation of the predictive model and testing of the model, the data was randomly divided into training and testing sets using the Python sklearn library [7]. The scope for regression analysis was explored, and it revealed that the training set was normally distributed, and MLR was chosen for modelling. The residual analysis was done, and a model was prepared using MLR. Its accuracy was tested with the testing set of the data. The above-mentioned combinations produced a model with the best accuracy of 77%. The analysis of the model can be seen in the Python–Jupyter Notebook of this study [7]. All the analysis and visualization was done using the sklearn, numpy, matplotlib, and pandas libraries of Python 3.6 [8].
Go to :
III. Results
Part 1
All the factors that may affect the discharge process were identified by tracking each discharge based on the discharge process flow activities checklist used in the hospital. The various factors analyzed based on this checklist were the following: (1) Assessment, (2) Cross-consultation, (3) Summary preparation, (4) Validation by treating doctor, (5) Corrected summary preparation, (6) Summary printing, (7) Final validation, (8) Validated summary moved for billing, (9) Bill summary preparation, (10) Bill generation, (11) File sent to billing after summary validation, (12) Bill generation, (13) Bill settlement, and (14) Vacating of room by patient.
An ANOVA analysis of the data produced the following results.
- Factors 1, 3, and 7 in combination attributed to the “treating doctor”: It was observed that the discharge TAT varied significantly with different treating doctors.
- Factor 2 attributed to “final day cross-consultation”: A pending investigation or cross-consultation on the last day of discharge leads to significant delay in the discharge TAT (Table 2).
Table 2
Accuracy of the predicted model on the test-set
| Sl no. | Doc | Pending tests | TAT (min) | Difference | Squared difference | |
|---|---|---|---|---|---|---|
| Actual | Model | |||||
| 1 | Doc1 | Yes | 225 | 208.10743 | 16.89257 | 285.4 |
| 2 | Doc1 | Yes | 210 | 208.10743 | 1.89257 | 3.6 |
| 3 | Doc3 | No | 130 | 113.11635 | 16.88365 | 285.1 |
| 4 | Doc3 | No | 105 | 113.11635 | −8.11635 | 65.9 |
| 5 | Doc4 | No | 51 | 80.299866 | −29.29990 | 858.5 |
| 6 | Doc3 | Yes | 233 | 191.25022 | 41.74978 | 1743.0 |
| 7 | Doc1 | No | 122 | 129.97356 | −7.97356 | 63.6 |
| 8 | Doc4 | Yes | 240 | 158.43373 | 81.56627 | 6653.1 |
| 9 | Doc3 | Yes | 173 | 191.25022 | −18.25020 | 333.1 |
| 10 | Doc3 | Yes | 234 | 191.25022 | 42.74978 | 1827.5 |
| 11 | Doc1 | Yes | 179 | 208.10743 | −29.10740 | 847.2 |
| 12 | Doc2 | No | 120 | 86.433066 | 33.56693 | 1126.7 |
| 13 | Doc4 | Yes | 189 | 158.43373 | 30.56627 | 934.3 |
| 14 | Doc3 | No | 173 | 113.11635 | 59.88365 | 3586.1 |
| 15 | Doc4 | No | 51 | 80.299866 | −29.29990 | 858.5 |
| 16 | Doc3 | Yes | 219 | 191.25022 | 27.74978 | 770.1 |
| 17 | Doc1 | No | 120 | 129.97356 | −9.97356 | 99.5 |
| 18 | Doc1 | Yes | 225 | 208.10743 | 16.89257 | 285.4 |
| 19 | Doc1 | Yes | 205 | 208.10743 | −3.10743 | 9.7 |
| 20 | Doc3 | Yes | 192 | 191.25022 | 0.749777 | 0.6 |
| 21 | Doc6 | Yes | 142 | 189.06024 | −47.06020 | 2214.7 |
| 22 | Doc1 | No | 132 | 129.97356 | 2.026439 | 4.1 |
| MAE (min) | 25.24 | |||||
| MSEa (min2) | 1038.88 | |||||
| RMSE (min) | 32.23 | |||||
| R2 (%) | 69.2 | |||||
| SE (min) | 32.4 | |||||
![]()
As seen in Table 3 and Figures 3–5, the significant factors influencing the discharge TAT were the treating doctor and pending cross-consultations. This contributed for over 30% and 56% of the variation, respectively, as evidenced by the R2 value. Hence, these two factors were considered for developing the model for predicting discharge TAT.
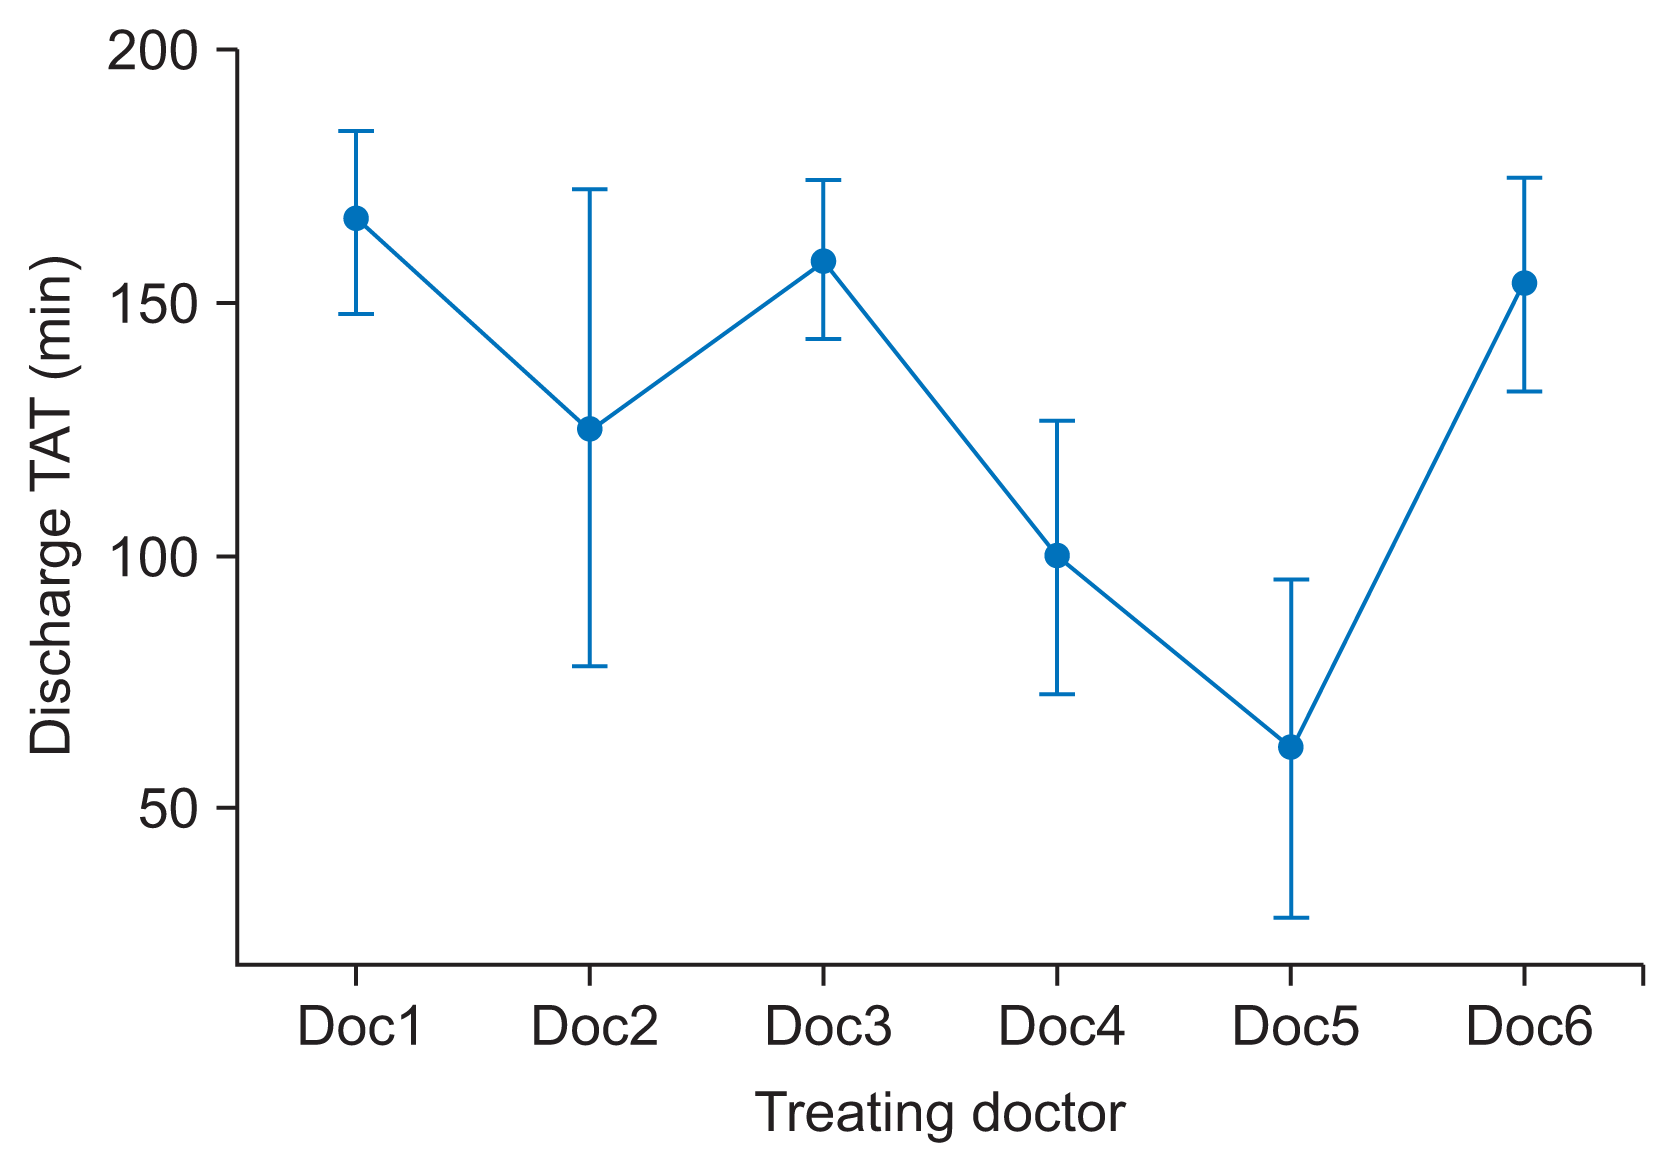 | Figure 3Interval plot discharge TAT vs. doctors. Bar represents as 95% confidence interval for the mean. The pooled standard deviation was used to calculate the intervals. TAT: turnaround time.
|
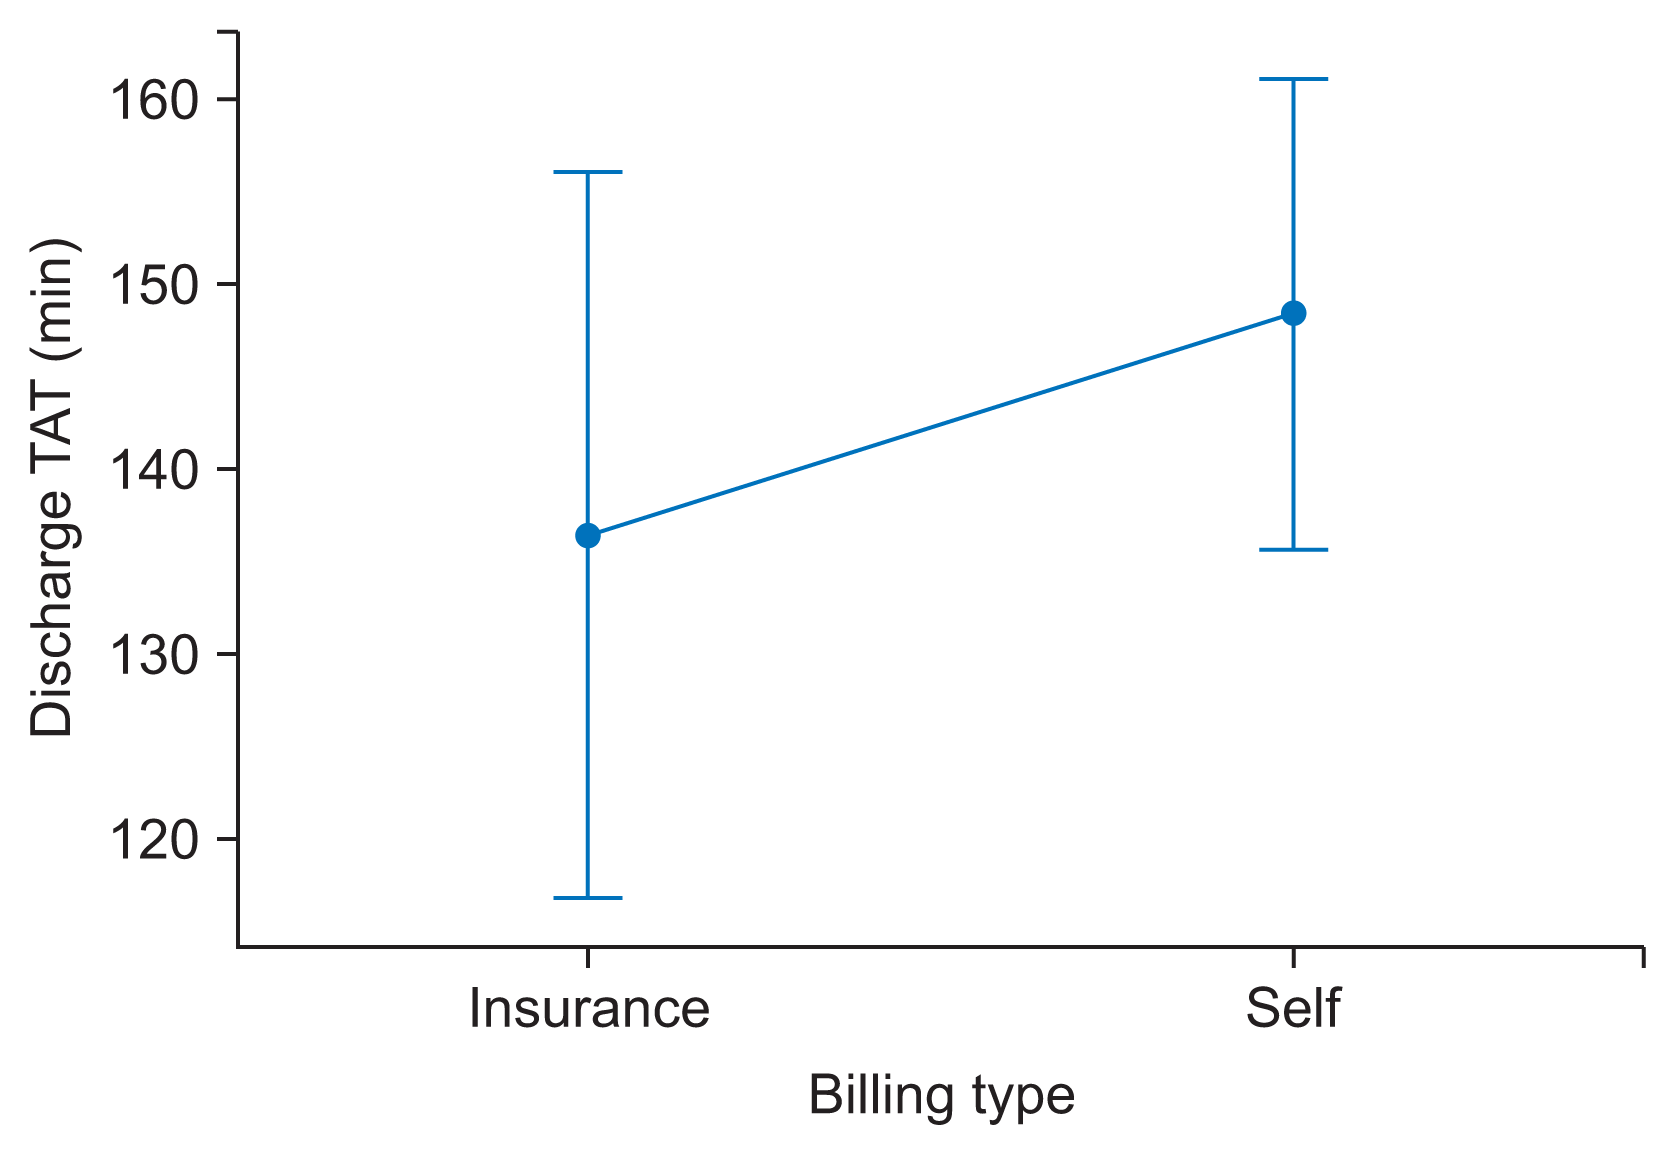 | Figure 4Interval plot discharge TAT vs. billing type. Bar represents as 95% confidence interval for the mean. The pooled standard deviation was used to calculate the intervals. TAT: turnaround time.
|
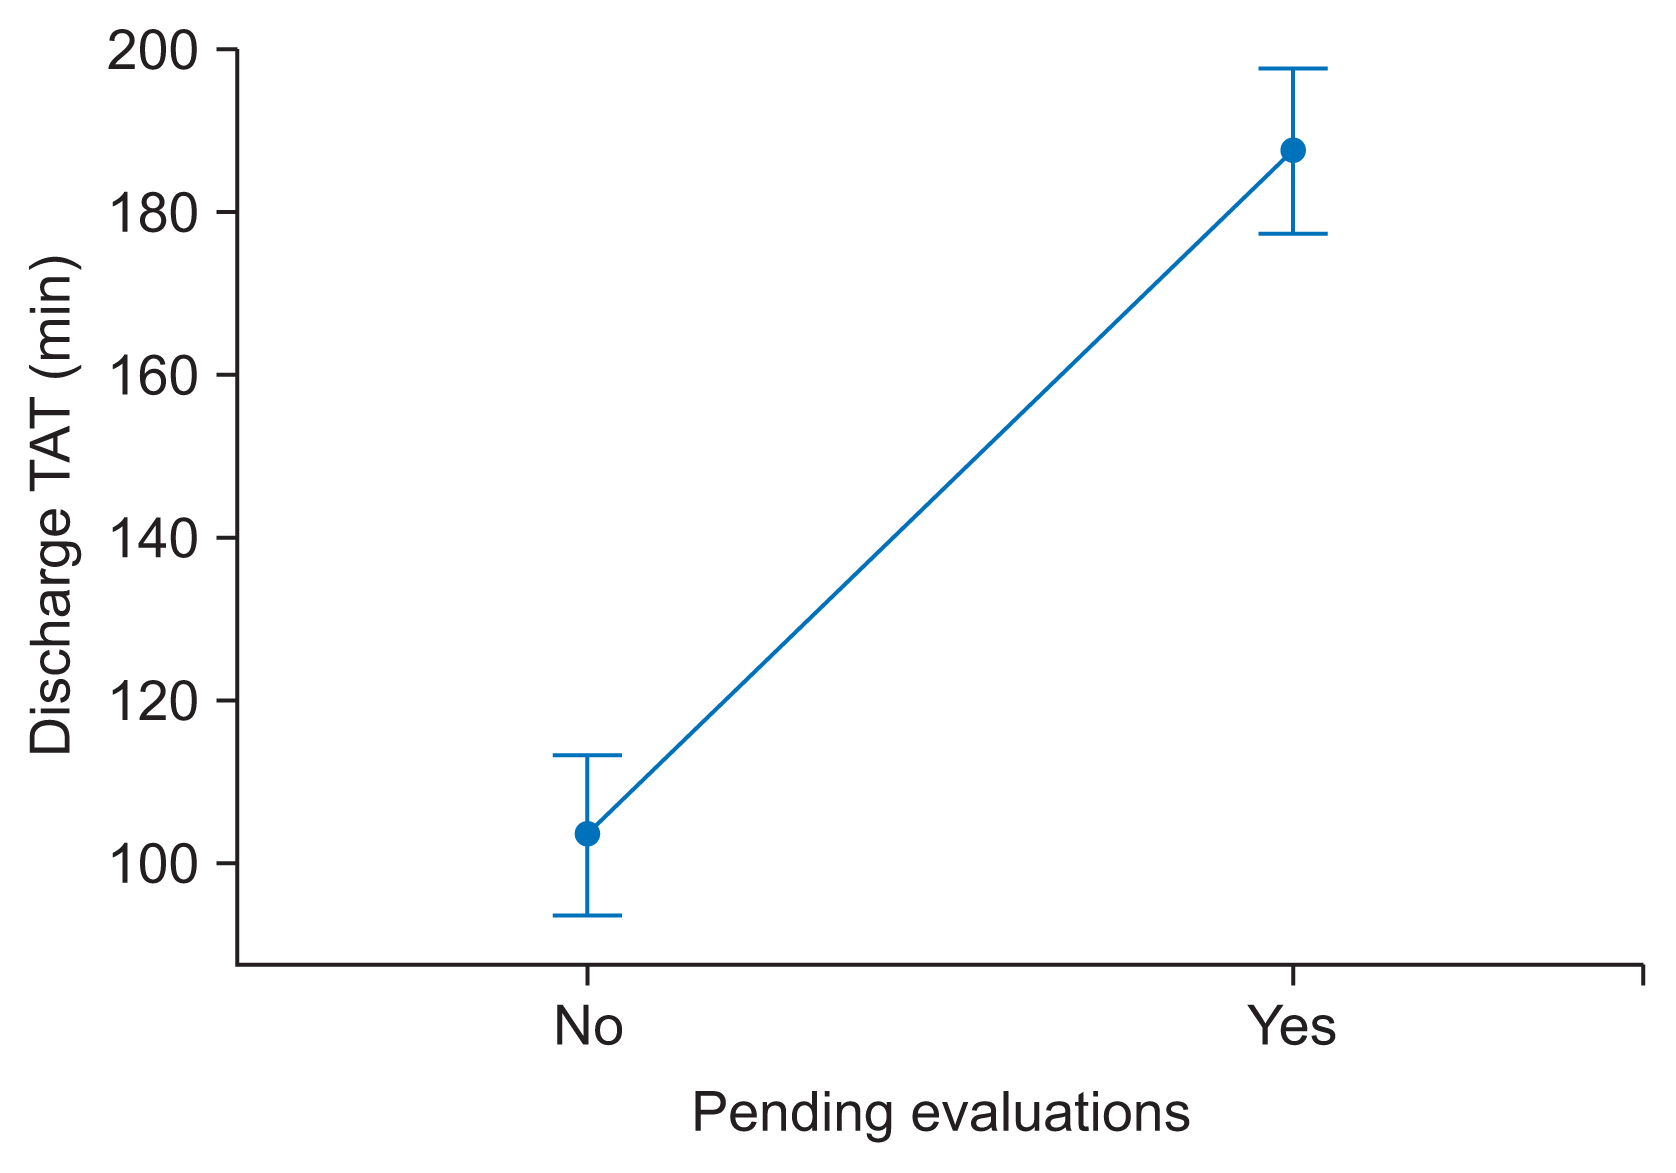 | Figure 5Interval plot discharge TAT vs. pending evaluations. Bar represents as 95% confidence interval for the mean. The pooled standard deviation was used to calculate the intervals. TAT: turnaround time.
|
Table 3
ANOVA analysis of identified factors
![]()
Part 2
The sample consisted of 108 items. This was split into 80% training set and 20% testing set for the out-of-sample accuracy. Then, 86 items were randomly chosen from the sample using the Python numpy library. Using the sklearn library, the algorithm below was derived for predicting the discharge TAT:
Discharge TAT= 129.97+0.0 Doc_Doc1-43.5 Doc_Doc2 -16.86 Doc_Doc3-49.67 Doc_Doc4- 97.0 Doc_Doc5-19.05 Doc_Doc6+0.0 Pendingtests_No+78.13 Pendingtests_yes
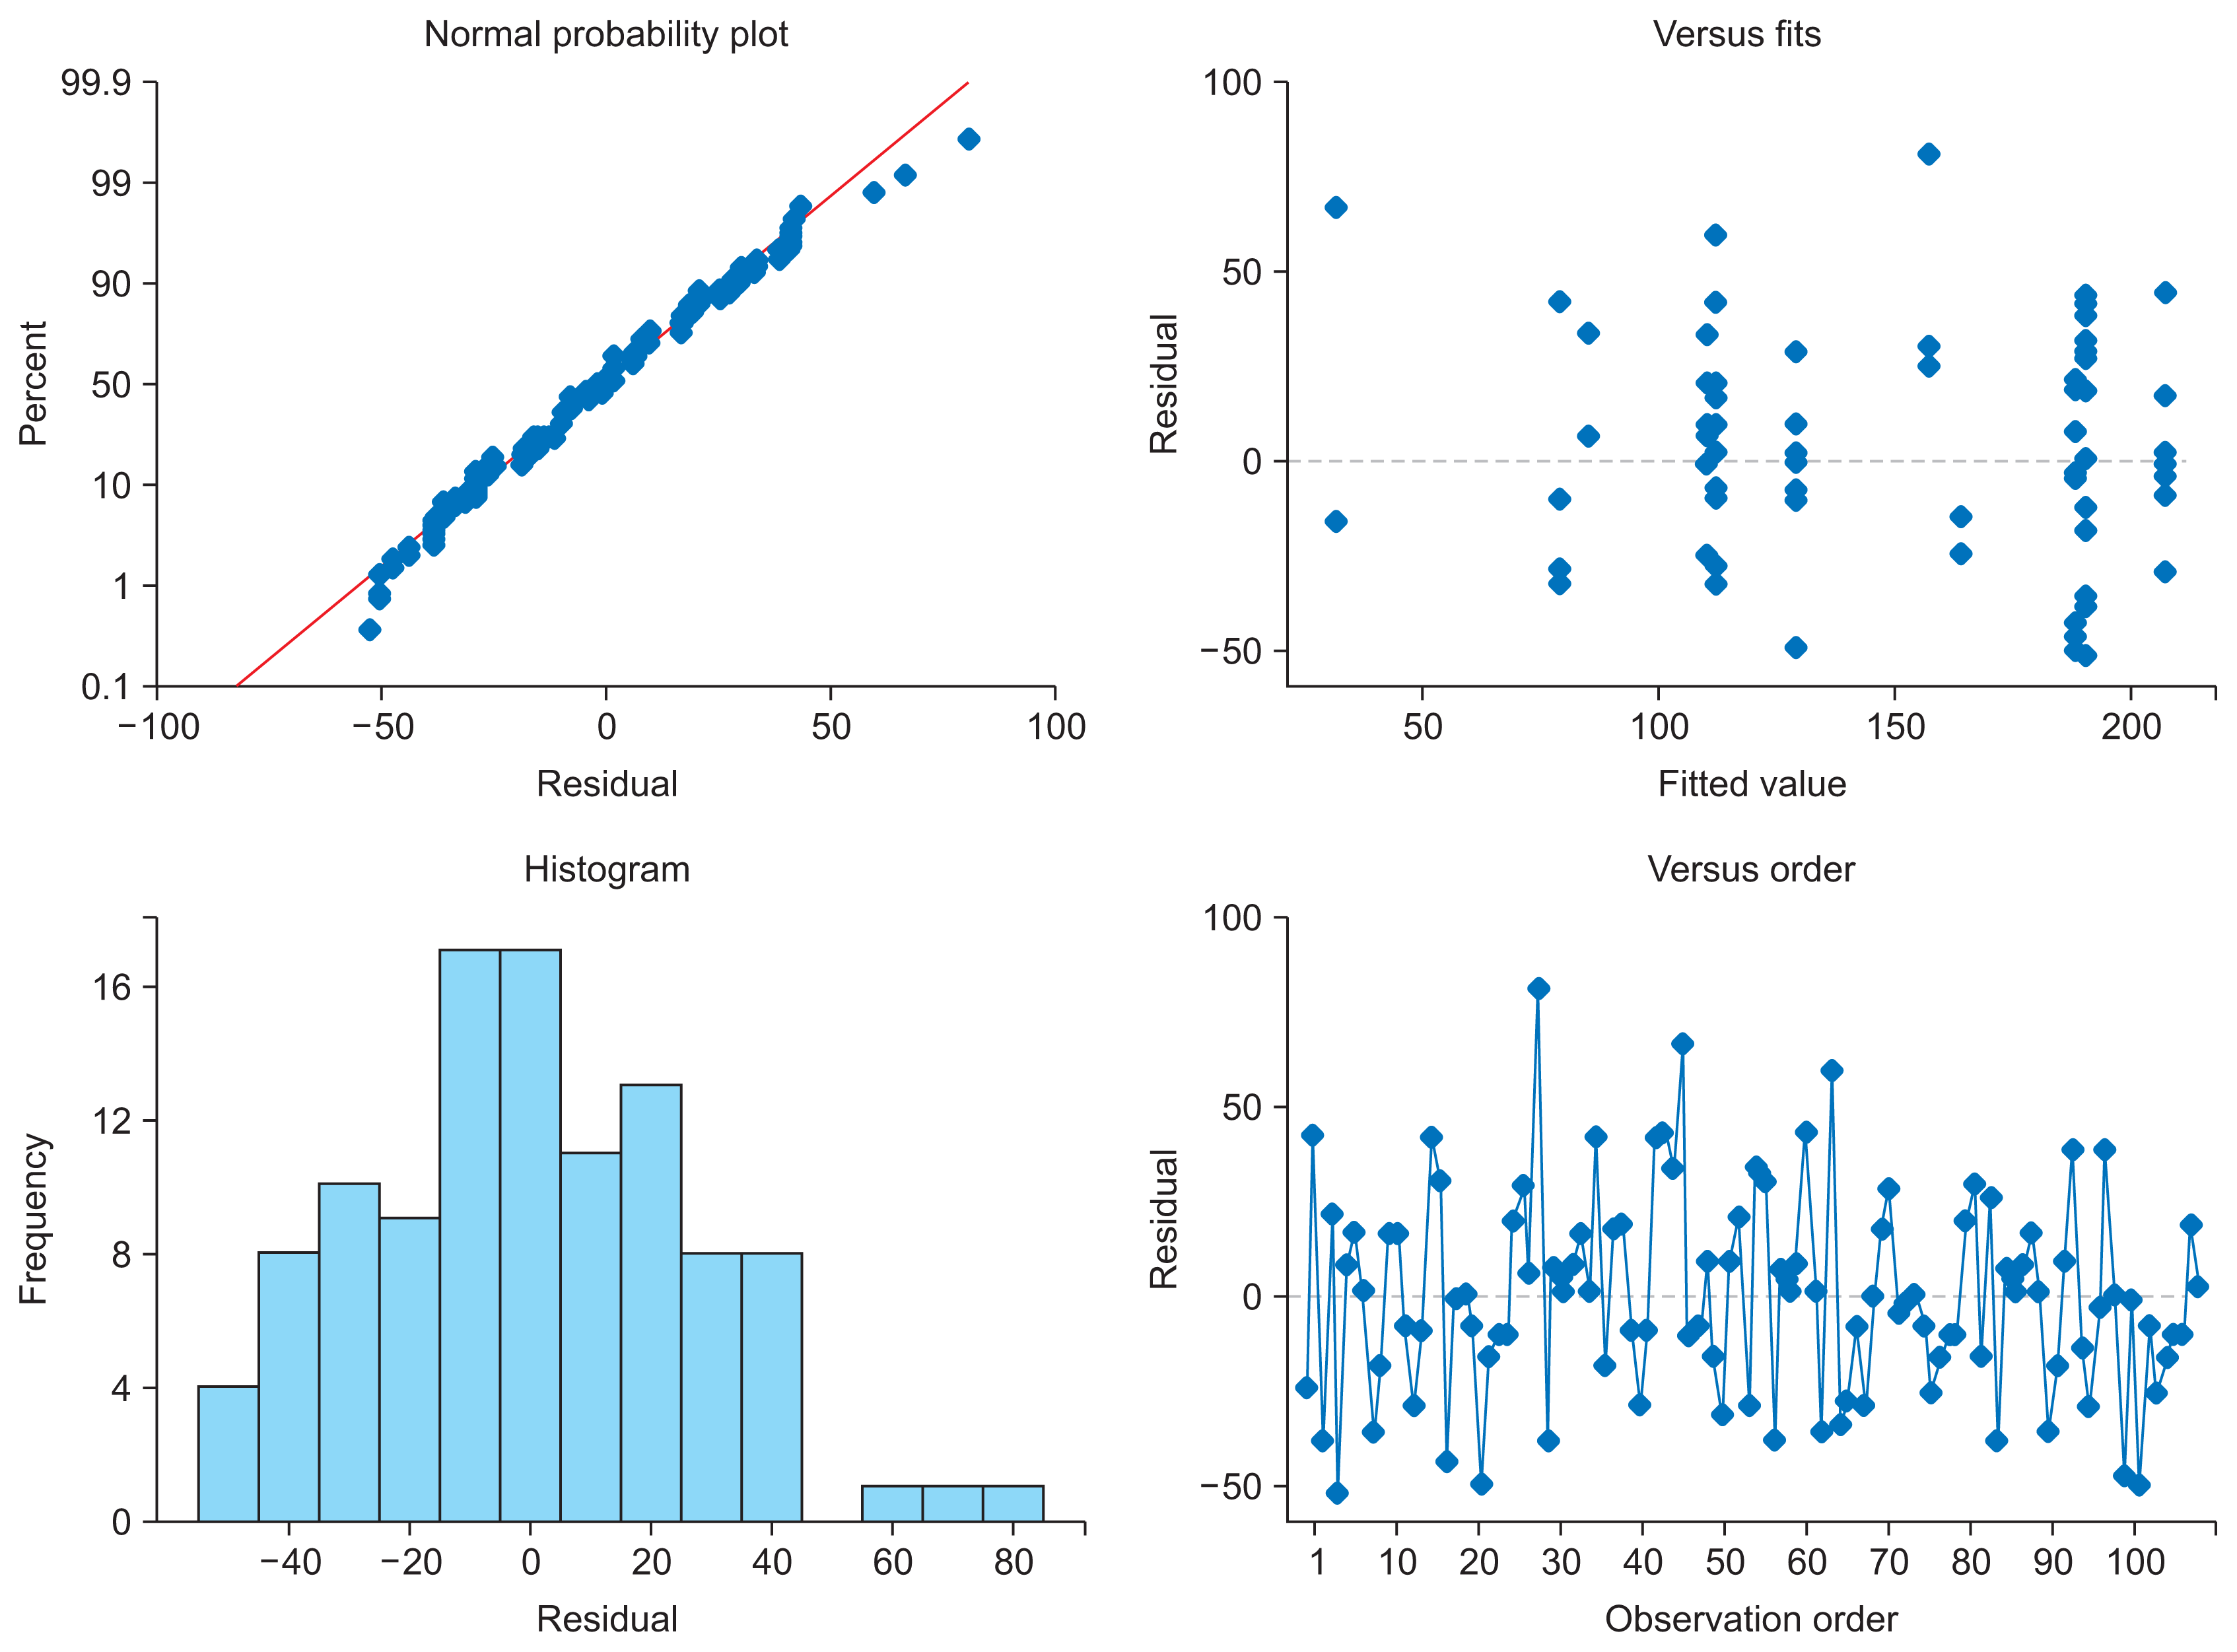
An MLR model was chosen for this study because, as seen in the residual plots in Figure 3, the residuals showed a fairly random pattern. The randomness in the residual plots, especially in the fitted plot, indicated that regression was the ideal choice of algorithm.
The model was tested on the test set, and the following results were obtained. On evaluation, the model showed a mean squared error (MSE) of 1038.88 and an R2 value of 69.2%. The out-of-sample accuracy is shown in Table 2. The residual plots for the model are shown in Figure 6. The model predicted values were compared with the actual data of the discharge TAT in the testing set, and the following results were obtained.
On evaluation with the complete set of 108 samples, the model predicted the TAT with an accuracy of 77.3% (R2 value) and an MSE of 702.26 (min2). The model showed a standard error of 26.7 minutes with a 95% confidence interval. This means that the model can predict the discharge TAT within an accuracy of ±52 minutes in 95% of the cases. The complete evaluation results of the overall sample are presented in Table 4.
Table 4
Evaluation of model on complete sample
| Evaluation | Value |
|---|---|
| MAE (min) | 20.86 |
| MSEa (min2) | 702.26 |
| RMSE (min) | 26.5 |
| R2 (%) | 77.3 |
| SE (min) | 26.7 |
![]()
Go to :
IV. Discussion
This study was carried out with the intention to predict the discharge process TAT so as to coordinate better services for patients and patient’s family or caregivers on the final day of their hospital stay, which will leave them with a lasting impression of the hospital. Although many studies have explored the benefits of predicting the time of discharge from the length-of-stay (LOS) point of view, very little research has been done on prediction of the TAT for the discharge process [9–11]. Consequently, the effectiveness and benefits of this type of prediction mechanism has not been studied in detail.
The model was based on MLR, which is a proven method for obtaining algorithms in analogous situations [12].
In a study titled, “The use of regression analysis to determine hospital payment: the case of Medicare’s indirect teaching adjustment,” by Thorpe [13], regression analysis was applied for its correct implementation in establishing reimbursement rates for hospitals under a government scheme.
In yet another study titled, “Predicting hospital length of stay using regression models: application to emergency department,” by Combes et al. [9], the LOS of patients was estimated using linear regression. These models were validated and successfully applied to the classification and prediction of the LOS in the pediatric emergency department (PED) of the Lille Regional Hospital Center in France [9].
Several studies have compared the effectiveness of various algorithms for various use cases, such as “Residual analysis in regression” by StatTrek [14] and “A comparison of random forest regression and multiple linear regression for prediction in neuroscience,” by Smith et al. [15]. Comparing the effectiveness of dozens of popular algorithms for predicting continuous data was beyond the scope of this study. This study focused on predicting the discharge TAT with reasonable accuracy. MLR was chosen for prediction based on residual analysis, and this produced a reasonably accurate result for practical implementation in the hospital.
Although this model had an accuracy of only 77%, this can be attributed to the fact that fewer samples were collected due to time constraints and other limitations associated with manual observation of the process. Our subjective intuition is that the factors affecting the discharge TAT could certainly be the above-mentioned features in this set-up and that the method used is valid.
There are various examples of how linear regression has been used in the healthcare setting. A study titled “Improving the prediction of total surgical procedure time using linear regression modeling,” [16] also used linear regression to create a predictive model to optimize service TAT in a clinical setting. In that study the linear regression model gave the most accurate value for the predicted procedure time. With a 77% accuracy for the predicted time, the result of that study is similar to the accuracy of the predicted TAT in this study. This can be used as an effective reference to use similar linear regression models for the prediction of TAT of similar administrative and clinical processes and procedures [16].
In a study by Bouphan and Srichan [17], a linear regression model was used to identify the factors affecting research to solve the health problems of health personnel in sub-district health promoting hospitals in Thailand. The study attempted to find the relationship between independent and dependent variables that could collectively predict the research. The model showed that there was a linear relationship between the dependent and independent variable. This helped in the creation of a model with a reasonable accuracy of 57%, while the model developed in this study provided an accuracy of over 70%.
The study by Freburger [18], analyzed the relationship between physical therapy services and the outcomes of patients with acute stroke. Although this study did not use a prediction model, it used MLR to evaluate the relationship. This demonstrates the versatility of the algorithm in helping identify significant relationships between factors with continuous variables.
Many studies on artificial intelligence and machine-learning research have focused on the clinical aspect of healthcare delivery [19]. For example, IBM Watson is a system that uses deep-learning, classification, and a regression algorithm to process unstructured data in medical records to identify patterns and predict outcomes [19,20]. The use of artificial intelligence is somewhat less potentially revolutionary in this domain as compared to patient care, but it can be used to substantially improve efficiency. This is needed in healthcare. For example, the average US nurse spends 25% of work time on regulatory and administrative activities [21]. However, in a hospital, there are also administrative departments, such as housekeeping, the front-office, engineering support services, IT support services, and so forth, that help them function efficiently. From a system perspective, a lot of resources, such as personnel, time, and infrastructure, are also devoted to this. This paper to address these administrative disciplines and application of machine-learning in improving administrative efficiency.
This is a rather novel approach, and very little previous research has considered using MLR to address and predict discharge TAT. The proposed MLR model for predicting discharge TAT is expected to be useful in managing other aspects of the discharge process, especially in terms of activities such as vacating hospital beds, disinfecting, and managing new admissions and the allocation of rooms for new inpatients.
This study was conducted to address the administrative hassles of delayed discharge processing. Only the time from the initiation of the discharge to the patient leaving the hospital bed was considered in this study. The time taken for clinical aspects of a patient’s care was not considered because it was beyond the scope of this study. There is scope for further expanding this study to better understand any significant relationships between the prediction of discharge TAT and improved the quality of services in the hospital. This could not be investigated in this study due to limitations of time and resource constraints. Further studies and improved and larger datasets should be collected to enable better and more accurate prediction of any dependent variable. Therefore, it would be an invaluable service by healthcare analysts with such means and availability of data regarding the time taken for discharge to further develop this model.
Go to :
 XML Download