

 PDF
PDF Citation
 Print
Print


INTRODUCTION
Obesity is a major risk factor for type 2 diabetes mellitus (T2DM) [12], and its prevalence has been increased globally over the past four decades [3]. The pathogenesis of obesity is complex, but abnormalities in neural circuits that regulate energy intake and energy expenditure are crucial to the development of obesity [4]. In the control of energy homeostasis, the hypothalamus plays an essential role by integrating internal and external signals and influencing consequent metabolic responses [56]. The hypothalamus also has extrahypothalamic connections to the brainstem, mesolimbic system, pituitary gland, and vagus nerve, all of which help to maintain metabolic homeostasis [5]. In this process, leptin, the melanocortin system, and gut-derived peptides, including glucagon-like peptide-1 (GLP-1), serve as regulators of appetite and feeding behavior [45]. Therefore, the central regulation of energy balance is a key component of the pathophysiology of obesity [7].
GLP-1 is an incretin hormone that is mainly secreted from enteroendocrine L cells in response to the ingestion of nutrients. GLP-1 enhances glucose-stimulated insulin secretion and suppresses glucagon secretion in a glucose-dependent manner [8]. Currently, guidelines recommend GLP-1 receptor agonists for the treatment of T2DM [910]. GLP-1 receptor agonists also promote significant weight loss in obese individuals [11], and 3.0 mg of liraglutide has been approved for the treatment of obesity [12]. A recent study showed that 0.05 to 0.4 mg of oral semaglutide per day resulted in a >15% and >20% weight loss in 7% to 56% and 4% to 27% of obese individuals without diabetes mellitus, respectively [13]. In rodents, the GLP-1 receptor agonist not only decreases energy intake but also increases energy expenditure through white adipose tissue browning and brown adipose tissue thermogenesis [141516]. On the other hand, in humans, the GLP-1 receptor agonist induces weight loss by decreasing appetite and energy intake rather than increasing energy expenditure [17]. GLP-1 directly stimulates proopiomelanocortin/cocaine- and amphetamine-regulated transcript neurons and indirectly inhibits agouti-related peptide/neuropeptide Y neurons via gamma-aminobutyric acid signaling in the arcuate nucleus to reduce food intake [18]. Moreover, GLP-1 affects the hindbrain and vagal afferents, leading to meal termination [192021]. However, the mechanism underlying the effects of GLP-1 on energy intake is not fully understood.
In studies using functional magnetic resonance imaging (fMRI), individuals with obesity or T2DM exhibited differences in the functional activities of the brain compared with those in normal individuals. The affected brain regions were associated with appetite, the reward system, and emotions [2223]. In obese individuals with or without T2DM, peripherally administered GLP-1 receptor agonists altered the activation of the hypothalamus, insula, putamen, and amygdala in response to visual food cues [2324252627]. On the other hand, in lean individuals without T2DM, intravenous exenatide infusion did not affect the functional activities of these brain regions [25]. However, it is uncertain whether the functional activation of the brain and its response to GLP-1 receptor agonist are different in lean and obese individuals with T2DM. Therefore, in the present study, we investigated the effects of a GLP-1 receptor agonist on functional brain activation in lean and obese individuals with T2DM in response to visual food cues.
METHODS
Study participants and ethical statement
Fifteen lean (body mass index [BMI] <23 kg/m2) and 15 obese (BMI >26 kg/m2) individuals with T2DM were included in the present study. The BMI categories used were based on obesity-related health risk in the East Asian population [28]. Eligible participants were adults aged 19 to 70 years with an estimated glomerular filtration rate of >30 mL/min/1.73 m2, aspartate aminotransferase and alanine aminotransferase levels of <2.5 times of the upper limit of the normal range, and a glycosylated hemoglobin (HbA1c) of <8.5%. All participants were treated for T2DM through lifestyle modification and/or oral antidiabetic drugs. We excluded individuals who were diagnosed with type 1 diabetes mellitus, had a history of insulin therapy, and could not perform magnetic resonance imaging (MRI) scan due to the adverse effects of contrast media or claustrophobia. The present study is registered at ClinicalTrials.gov (ClinicalTrails.gov Identifier: NCT02745470). The study protocol was approved by the Institutional Review Board of Seoul National University Hospital (IRB No. 1507-038-686). All participants provided written informed consent before participating in any study-related activities.
Study design and procedure
The present study was a randomized, single-blinded, crossover study. The study consisted of two interventions with a 1-week washout period. Ten micrograms of lixisenatide or normal saline was administered subcutaneously to the participants at 9:00 AM after an overnight (12 hours) fast. At 30 minutes after the lixisenatide or saline injection, the functional activity of the brain was evaluated in response to visual food cues with fMRI. Seventy minutes after the fMRI session, the participants were presented with an ad libitum buffet consisting of bread, bananas, boiled eggs, and juice for 20 minutes. We calculated their food intake in calories by measuring the amount of food before and after the buffet. Appetite was assessed using visual analog scales for five domains (hunger, satiety, fullness, craving, and nausea) [29] before the lixisenatide or saline injection, after the MRI session, and after the ad libitum buffet as follows: 0 (none), 1 to 3 (mild), 4 to 7 (moderate), 8 to 10 (severe). After 1 week, the participants switched from a lixisenatide to a saline injection or from a saline to a lixisenatide injection, depending upon which they received during the first intervention, and the same protocol was performed. Fig. 1 shows the study design and procedure.
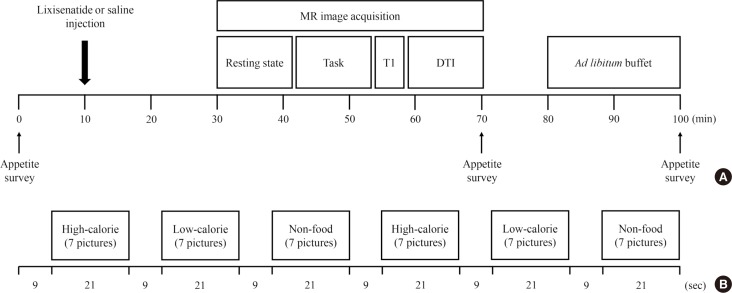
Fig. 1
Study design and procedure. Fifteen lean and 14 obese individuals with type 2 diabetes mellitus were studied in a randomized, single-blinded, crossover study. (A) The study participants were randomly assigned to either the lixisenatide or saline injection group after an overnight fast. After administration of the injection, the brain responses to visual food cues were evaluated using functional magnetic resonance imaging (fMRI). After the fMRI session, the participants were given access to an ad libitum buffet to measure caloric intake. Appetite surveys were taken before the injection, after the fMRI session, and after the ad libitum buffet. One week apart, the participants were switched to the other condition group and performed the same procedure. (B) fMRI paradigm. One run consisted of six blocks of pictures that included high-calorie food, low-calorie food, and nonfood contents. Each type of picture was presented in a block with seven other pictures for 21 seconds and were shown twice in each run. The blocks were separated by 9 seconds of a black background with a white fixation cross. Each fMRI session had two runs of blocks with different orders to prevent the sequence effect. MR, magnetic resonance; T1, T1-weighted; DTI, diffusion tensor imaging.
![]()
Task fMRI protocol
The participants were asked to look at a screen through a mirror on the head coil of the MRI instrument and to focus on the screen contents during the fMRI. There were three types of pictures that showed food with high caloric content, food with low caloric content, and nonfood (Supplementary Fig. 1). The pictures were obtained from a database of food images for the study of eating and appetite (http://www.eat.sbg.ac.at/) [30]. As shown in Fig. 1, seven consecutive pictures of the same type were presented in a block for 21 seconds followed by 9 seconds of a white ‘+’ sign on a black background (baseline block). A set of each type of picture block and the white ‘+’ sign was included twice in each run. There were two runs in total, in which the second run used a different order for the picture type blocks to prevent the sequence effect.
Image acquisition and analyses
The T1-weighted (T1) and task fMRI data were acquired using a 3 Tesla scanner with 32 channels that had a coil (MAGNETOM TrioTim syngo MR B17; Siemens, Erlangen, Germany). The T1 images had the following parameters: repetition time 1,670 ms, echo time 1.89 ms, voxel size 1×1×1 mm3, field of view 250 mm, flip angle 9°, and number of slices 208. The task fMRI images were acquired using echo-planar imaging with the following parameters: repetition time 2,000 ms, echo time 30 ms, voxel size 3.4×3.4×3.4 mm3, field of view 220 mm, flip angle 80°, and a generalized autocalibrating partially parallel acquisition factor of 2.
The magnetic resonance images were preprocessed using a standard process in the Statistical Parametric Mapping 12 software (SPM12; Wellcome Trust Centre for Neuroimaging, London, UK). First, two time point volumes were removed from each image to reduce magnetic inhomogeneity at the beginning of the scans. After correcting for the slice timing difference, the functional images were coregistered to the structural image, which was followed by segmentation and normalization to the Montreal Neurological Institute standard template. Finally, the resulting images were smoothed with a Gaussian kernel of full width at a half maximum of 6 mm. Using a general linear model implemented in SPM12, the β parameter of each type of picture was estimated, which was used to obtain the contrast map between food with high caloric content versus food with low caloric content and food versus nonfood. Each contrast map was tested for whole brain group differences using factorial analyses implemented in the second level general linear models in SPM12 on the basis of the main factors, including group and treatment, and the interaction between them. In addition, we performed subgroup analyses for individuals whose caloric intake was decreased after lixisenatide injection. The cluster-level threshold was set to 10 voxels with an uncorrected P<0.001 for multiple comparisons. We presented the distinct brain areas in one data set when they showed simultaneous changes in functional activation in the same contrast map.
Statistical analyses
The sample size was determined to yield a power of 90% at a significance level of 0.01 based on the minimum sample size needed to achieve statistical significance in fMRI neuroimaging studies [31]. All data except the images were analyzed by GraphPad Prism 5 (GraphPad Software Inc., San Diego, CA, USA). The baseline characteristics of the participants are presented as the mean±standard deviation for continuous variables and the number or proportion for categorical variables. In the image analyses, the β parameter for each type of picture is presented as the mean±standard error of the mean in the graphs. Caloric intake was analyzed by repeated measures analysis of variance (ANOVA). The association between the β parameters and the results of the appetite survey was assessed by the Pearson correlation coefficient. P values <0.05 were regarded as statistically significant.
RESULTS
Characteristics of the study participants
A total of 30 individuals with T2DM were evaluated for the present study, but one individual was excluded because of insufficient fMRI data to obtain an image. Ultimately, 29 individuals (15 lean and 14 obese individuals) were included in the analysis. In lean individuals, the mean age was 61.6±4.5 years, BMI was 21.9±0.8 kg/m2, and HbA1c level was 6.7%±0.5%. In obese individuals, the mean age was 59.4±5.9 years, BMI was 28.1±2.2 kg/m2, and HbA1c level was 6.8%±0.4%. The baseline characteristics of the participants are described in Table 1. The participants reported no treatment-emergent adverse events except for nausea. The incidence of nausea was 34.5% and 20.7% for lixisenatide and saline, respectively, and most cases were mild to moderate according to the visual analog scales. Two participants reported severe nausea after lixisenatide injection but completed the study.
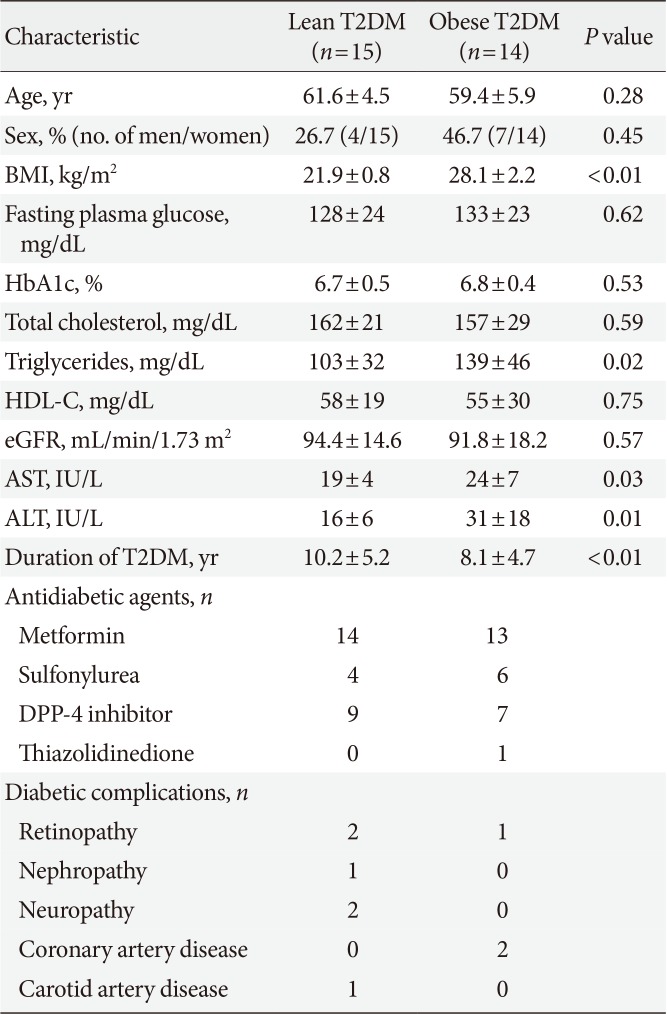
Table 1
Baseline characteristics of the study participants
Values are presented as mean±standard deviation.
T2DM, type 2 diabetes mellitus; BMI, body mass index; HbA1c, glycosylated hemoglobin; HDL-C, high density lipoprotein cholesterol; eGFR, estimated glomerular filtration rate; AST, aspartate aminotransferase; ALT, alanine aminotransferase; DPP-4, dipeptidyl peptidase-4.
![]()
Brain responses to visual food cues
Obese individuals showed significantly greater functional activation of the hypothalamus, pineal gland, and parietal cortex in the high-calorie food versus low-calorie food contrast than lean individuals (P<0.05) (Fig. 2A and B). Obese individuals also showed greater activation of the orbitofrontal cortex in the high-calorie food versus nonfood contrast than lean individuals (P<0.05) (Fig. 2C). In the food versus nonfood contrast, the functional activation of the visual cortex was significantly higher in obese individuals than in lean individuals (P<0.05) (Fig. 2D).
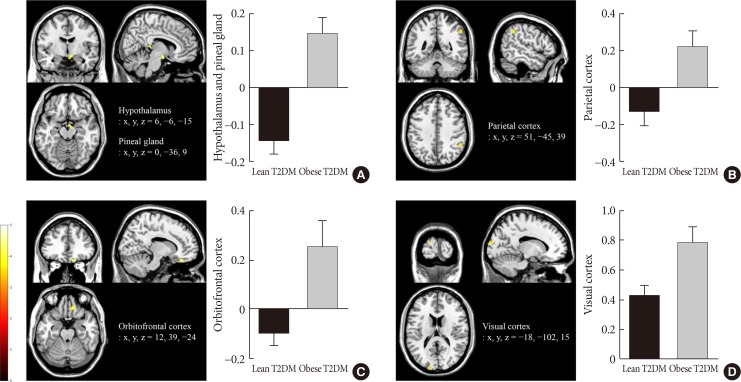
Fig. 2
Differences in brain responses to visual food cues in lean and obese individuals with type 2 diabetes mellitus (T2DM). (A) Activation of the hypothalamus and pineal gland in response to viewing high-calorie food pictures (high-calorie food vs. low-calorie food). (B) Activation of the parietal cortex in response to viewing low-calorie food pictures (low-calorie food vs. high-calorie food). (C) Activation of the orbitofrontal cortex in response to viewing high-calorie food pictures (high-calorie food vs. nonfood). (D) Activation of the visual cortex in response to viewing food pictures (food vs. nonfood). The color bar indicates the T value of the functional activity in each voxel. The blood oxygen level-dependent signal intensity (effect size) is presented as the mean and the standard error of the mean. The cluster level threshold was set to 10 voxels with an uncorrected P<0.001. x, y, and z indicate the x-axis (sagittal plane), y-axis (coronal plane), and z-axis (transverse plane) used in magnetic resonance imaging.
![]()
Effects of lixisenatide injection on brain responses to visual food cues
Lixisenatide injection significantly reduced the functional activation of the fusiform gyrus and lateral ventricle in obese individuals compared with lean individuals, only for the nonfood versus high-calorie food contrast (P<0.05) (Fig. 3). The direction of the treatment effect was opposing between the two groups. In the subgroup analysis of individuals whose caloric intake was decreased after lixisenatide injection (n=17), there were significant interaction effects between group and treatment in the posterior cingulate and medial frontal cortex for the high-calorie food versus low-calorie food contrast (P<0.05) (Fig. 4A). For the food versus nonfood contrast, significant interaction effects were also shown between group and treatment in the hypothalamus, temporal lobe, and orbitofrontal cortex (P<0.05) (Fig. 4B).
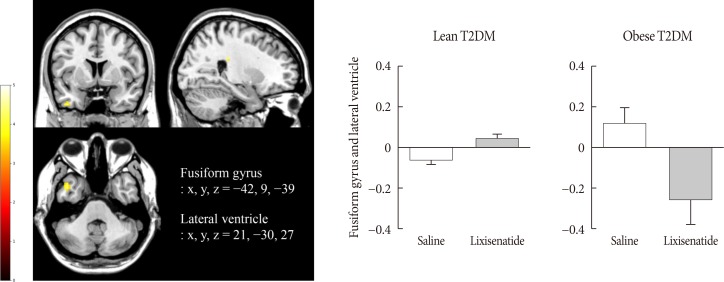
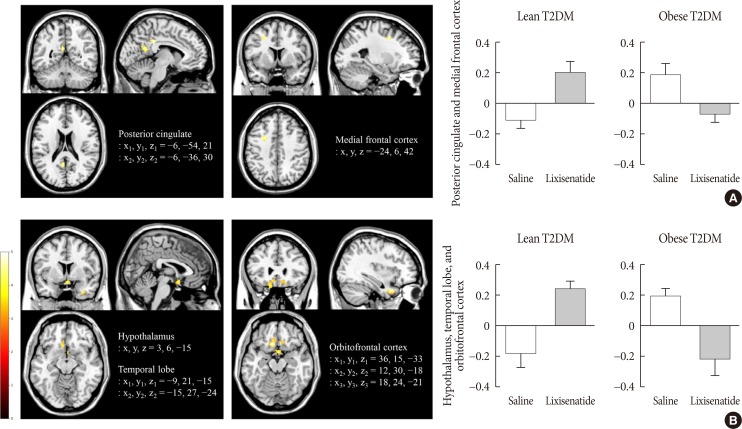
Fig. 3
Alteration in the responses to visual food cues in the brain in lean and obese individuals with type 2 diabetes mellitus (T2DM) after the administration of lixisenatide. The color bar indicates the T value of the functional activity in a voxel. The cluster level threshold was set to 10 voxels with an uncorrected P<0.001. x, y, and z indicate the x-axis (sagittal plane), y-axis (coronal plane), and z-axis (transverse plane) used in magnetic resonance imaging.
![]()
Fig. 4
Alteration in brain responses to visual food cues in 17 of 29 individuals (eight lean and nine obese individuals) with type 2 diabetes mellitus (T2DM) who had decreased caloric intake after the administration of lixisenatide. (A) Activation of the posterior cingulate and medial frontal cortex in response to viewing high-calorie food pictures (high-calorie food vs. low-calorie food). (B) Activation of the hypothalamus, temporal lobe, and orbitofrontal cortex in response to viewing food pictures (food vs. low-calorie food). The color bar indicates the T value of the functional activity in a voxel. The cluster level threshold was set to 10 voxels with an uncorrected P<0.001. x, y, and z indicate the x-axis (sagittal plane), y-axis (coronal plane), and z-axis (transverse plane) used in magnetic resonance imaging.
![]()
Changes in caloric intake and appetite
Lixisenatide injection reduced caloric intake in 17 of 29 participants, including eight lean and nine obese individuals. Changes in caloric intake were not significantly different between lean and obese individuals (1±72 kcal vs. −8±62 kcal, P=0.56). However, in the high-calorie food versus low-calorie food contrast, the functional activation of the hypothalamus and pineal gland was associated with baseline fullness (r=0.34, P=0.01), post-fMRI satiety (r=0.31, P=0.01), and post-fMRI fullness (r=0.41, P<0.01). Moreover, in the food and nonfood contrast, the functional activation of the visual cortex was inversely correlated with post-buffet satiety (r=0.40, P<0.01), post-buffet fullness (r=0.38, P<0.01), post-fMRI satiety (r=0.25, P=0.03), and post-fMRI craving (r=0.25, P=0.03). In the subgroup analysis of individuals with decreased caloric intake after lixisenatide injection, the functional activation of the posterior cingulate and medial frontal cortex was associated with baseline craving (r=0.38, P=0.02) and post-fMRI hunger (r=0.31, P=0.04) in the high-calorie food versus low-calorie food contrast (Supplementary Fig. 2). The results of the appetite assessment are detailed in Supplementary Table 1.
DISCUSSION
We found that brain responses to visual food cues were different in lean and obese individuals with T2DM. The functional activation of certain brain regions was associated with appetite. We also found that lixisenatide injection differentially affected the functional activation of the fusiform gyrus and lateral ventricle in lean and obese individuals with T2DM. The changes in caloric intake were not significantly different between the two groups. However, in individuals with decreased caloric intake after lixisenatide injection, there were significant interaction effects between group and treatment in brain regions that are known to be involved in appetite and the reward system.
In response to visual food cues, lean and obese individuals who did not receive a lixisenatide injection showed differential functional activation of the hypothalamus, pineal gland, parietal cortex, orbitofrontal cortex, and visual cortex. These brain regions are included in central nervous system (CNS) circuits that regulate appetite, feeding behavior, and body weight [3233]. The hypothalamus is crucial to nutrient sensing and signaling [34], and its dysfunction contributes to impaired energy homeostasis [35]. Previously, differences in hypothalamic activity were reported between lean and obese individuals without T2DM [25]. In our study, we found that these differences were also present in those with T2DM. However, little is known about the functional activation of the pineal gland in obesity. In a small study using MRI, pineal gland volume was found to be smaller in obese individuals than in lean individuals [36]. Given that melatonin deficiency is associated with circadian disruption and metabolic disorders [37], it may be plausible that pineal gland activity is different in lean and obese individuals. The parietal cortex integrates sensory, cognitive, and motor functions during a variety of tasks [38]. In fMRI studies, the activation of the parietal cortex was decreased in response to images of highly desirable food [26] and inversely correlated with weight loss [39]. The expression of GLP-1 receptors observed in the human parietal cortex [26] and the simultaneous alteration of the functional activation of the parietal cortex and hypothalamus in our study suggest that lixisenatide could have direct and indirect effects on this region. The orbital cortex is involved in food rewards [4041] and underlies the valuation of food by incorporating information about nutritional constituents [42]. For this reason, the functional activation of the orbitofrontal cortex might be associated with a change in food preference after GLP-1 receptor agonist treatment [43]. In addition, adaptation in the visual cortex was attenuated in individuals prone to weight gain compared with those resistant to weight gain [44], and obese individuals showed enhanced attention to visual food cues [4546]. In our study, the functional activation of the hypothalamus, pineal gland, and visual cortex were associated with satiety, fullness, and craving, but they were not associated with changes in caloric intake. Overall, CNS responses to visual food cues were different in lean and obese individuals with T2DM, and this affected the control of appetite in these individuals.
Lixisenatide injection altered the functional activation of the fusiform gyrus in response to visual food cues differentially in lean and obese individuals with T2DM. The fusiform gyrus is an important region involved in high-level object recognition [4748] and is related to the neural processing of visual food cues [49]. Recently, researchers demonstrated that the functional connectivity of the fusiform gyrus and prefrontal cortex was involved in the estimation of food energy density and associated with central reward circuits in humans [50]. In line with these findings, functional changes in the fusiform gyrus were observed only in contrasts with high-calorie food in our study. Notably, the fusiform gyrus has not been found to express GLP-1 receptor [5152]. However, the activity of the fusiform gyrus was inversely correlated with plasma insulin levels [53] and reduced after intranasal insulin administration [54] in healthy normal-weight individuals. Obese individuals were found to have a low cerebrospinal fluid (CSF) to plasma insulin ratio despite hyperinsulinemia due to insulin resistance [55]. These findings suggest that decreased insulin levels in the brain might be related to different responses to visual food cues and lixisenatide injection in the fusiform gyrus in lean and obese individuals, but this needs to be confirmed.
Along with functional changes in the fusiform gyrus, lixisenatide injection also differentially altered the functional activation in the lateral ventricle, which appeared to occur in the region of the choroid plexus [56] in lean and obese individuals with T2DM. In adult mice, the choroid plexus supports the recruitment and proliferation of neural stem cells [57] and expresses receptors for several hormones, including GLP-1 [58] and leptin [59]. The GLP-1 receptors in the choroid plexus are involved in the modulation of CSF [58], but their metabolic role is unknown. The choroid plexus also plays a role as a barrier or transporter in the brain along with the blood-brain barrier. GLP-1 reached pharmacologically active concentrations in the CSF after intracerebroventricular injection but not after subdural or intraparenchymal injection [60]. In addition, plasma liraglutide concentrations were not associated with CSF liraglutide concentrations in individuals with T2DM [61]. Interestingly, megalin, which is a promiscuous receptor expressed in the choroid plexus, mediated the transport of leptin across the blood-CSF barrier [62]. Similar to megalin, the GLP-1 receptor in the choroid plexus might be involved in the transport of GLP-1 or GLP-1 receptor agonists to the brain, and this needs to be evaluated in additional studies. Further investigation is required to determine the role of GLP-1 receptor that is expressed in the choroid plexus.
Finally, there were significant interaction effects between obesity and lixisenatide injection in the posterior cingulate, medial frontal cortex, hypothalamus, orbitofrontal cortex, and temporal lobe in individuals whose caloric intake was decreased. These brain regions are involved in appetite control and central reward circuits [33]. In our study, the functional activation of the posterior cingulate and medial frontal cortex was associated with craving and hunger. Glycemic and weight responses to GLP-1 receptor agonists vary in individuals with T2DM or obesity [636465]. The interaction effects found in our study may explain the differences in the treatment responses to GLP-1 receptor agonists in these individuals.
Previous studies showed that both short-acting [2325] and long-acting GLP-1 receptor agonists [2627] affected CNS activation that was involved in the regulation of appetite and the food reward system. Accordingly, GLP-1 receptor agonists may have similar effects on brain activity. However, short-acting and long-acting GLP-1 receptor agonists vary in their pharmacokinetics and pharmacodynamics and have different effects on postprandial insulin secretion and gastric emptying time, which might influence the neural control of appetite and feeding behavior [66]. Therefore, further investigation is needed to elucidate the effects of different GLP-1 receptor agonists on brain activity in terms of dose, treatment duration, and different study populations.
The present study has some limitations. First, we evaluated the effects of acute administration of lixisenatide injection on functional brain activation. The long-term effects should be examined in lean and obese individuals with T2DM. Second, we did not assess the dose-response relationship between lixisenatide and functional activities in the brain. Third, we did not evaluate differences in brain responses in consideration of the presence of oral antidiabetic drugs. Finally, we did not evaluate explanatory variables in more detail because the power and sample size calculations were performed for the primary endpoint.
In conclusion, our study showed that brain responses to visual food cues were different in lean and obese individuals with T2DM, and acute administration of lixisenatide differentially affected the functional activation of the brain in these individuals, especially those with decreased caloric intake after treatment.
 XML Download