Abstract
Background
Methods
Results
ACKNOWLEDGMENTS
References
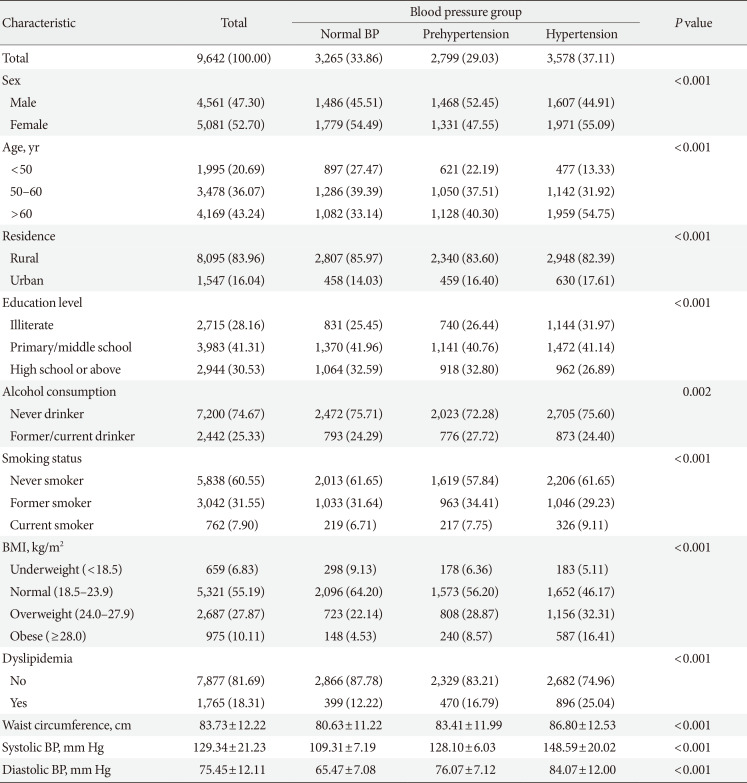
Table 1
Baseline characteristics of the CHARLS participants (n=9,642)

Table 2
Association between higher BP and risk of incident T2DM in the CHARLS participants (n=9,642)

Values are presented as number (%). Model 1: Adjusted for age (continuous, year), sex (male and female), and education level (illiterate, primary/middle school, and high school or above); Model 2: Adjusted for age (continuous, year), sex (male and female), education level (illiterate, primary/middle school, and high school or above), residence (rural and urban), smoking status (never smoker, former smoker and current smoker), alcohol consumption (never drinker and former/current drinker), body mass index (continuous, kg/m2), waist circumference (continuous, cm), and dyslipidemia (yes and no).
BP, blood pressure; T2DM, type 2 diabetes mellitus; CHARLS, China Health and Retirement Longitudinal Study; OR, odds ratio; CI, confidence interval.
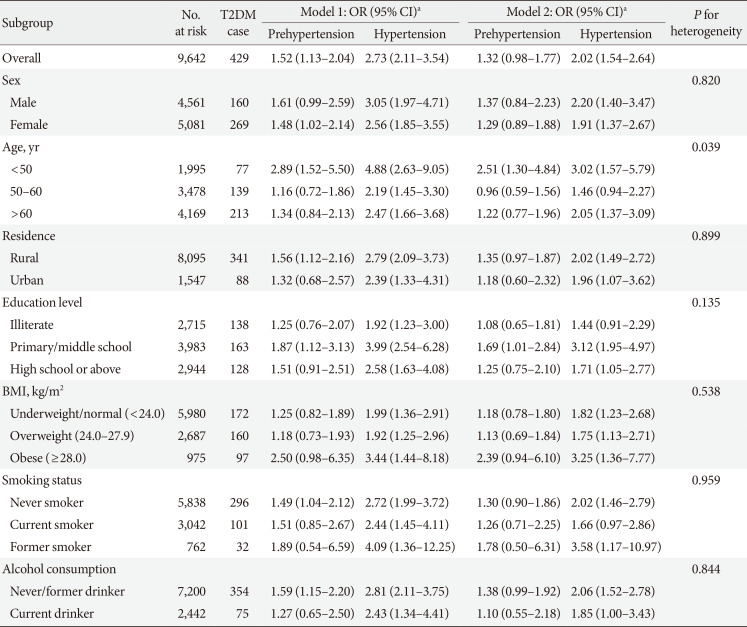
Table 3
Association between higher BP and risk of incident T2DM in the CHARLS subgroups (n=9,642)

Model 1: Adjusted for age (continuous, year), sex (male and female), and education level (illiterate, primary/middle school and high school or above); Model 2: Adjusted for age (continuous, year), sex (male and female), education level (illiterate, primary/middle school, and high school or above), residence (rural and urban), smoking status (never smoker, former smoker and current smoker), alcohol consumption (never drinker and former/current drinker), body mass index (continuous, kg/m2), waist circumference (continuous, cm), and dyslipidemia (yes and no).
BP, blood pressure; T2DM, type 2 diabetes mellitus; CHARLS, China Health and Retirement Longitudinal Study; OR, odds ratio; CI, confidence interval; BMI, body mass index.
aOR and 95% CI were calculated for prehypertension and hypertension versus normal blood pressure.
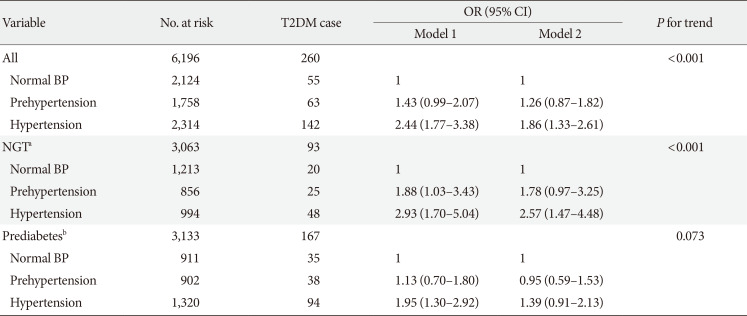
Table 4
Association between higher BP and risk of incident T2DM among participants with baseline FBG in CHARLS (n=6,196)

Model 1: Adjusted for age (continuous, year), sex (male and female) and education level (illiterate, primary/middle school, and high school or above); Model 2: Adjusted for age (continuous, year), sex (male and female), education level (illiterate, primary/middle school, and high school or above), residence (rural and urban), smoking status (never smoker, former smoker and current smoker), alcohol consumption (never drinker and former/current drinker), body mass index (continuous, kg/m2), waist circumference (continuous, cm), and dyslipidemia (yes and no).
BP, blood pressure; T2DM, type 2 diabetes mellitus; FBG, fasting blood glucose; CHARLS, China Health and Retirement Longitudinal Study; OR, odds ratio; CI, confidence interval; NGT, normal glucose tolerance.
aNormal glucose tolerance was defined as FBG <100 mg/dL, bPrediabetes was defined as FBG ≥100 mg/dL and ≤125 mg/dL.
Table 5
Association between higher BP and risk of incident T2DM after excluding participants with self-reported hypertension in the CHARLS participants (n=7,609)

Values are presented as number (%). Model 1: Adjusted for age (continuous, year), sex (male and female) and education level (illiterate, primary/middle school, and high school or above); Model 2: Adjusted for age (continuous, year), sex (male and female), education level (illiterate, primary/middle school, and high school or above), residence (rural and urban), smoking status (never smoker, former smoker and current smoker), alcohol consumption (never drinker and former/current drinker), body mass index (continuous, kg/m2), waist circumference (continuous, cm), and dyslipidemia (yes and no).
BP, blood pressure; T2DM, type 2 diabetes mellitus; CHARLS, China Health and Retirement Longitudinal Study; OR, odds ratio; CI, confidence interval.


 PDF
PDF Citation
 Print
Print


 XML Download