This article has been corrected. See "Corrigendum: Affiliation Correction. Development and Validation of a Risk Scoring System Derived from Meta-Analyses for Papillary Thyroid Cancer" in Volume 38 on page 287.
Abstract
Background
The aim of this study was to develop a scoring system to stratify the risk of papillary thyroid cancer (PTC) and to select the proper management.
Methods
We performed a systematic search of MEDLINE and Embase. Data regarding patients’ prognoses were obtained from the included studies. Odds ratios (ORs) with statistical significance were extracted from the publications. To generate a risk scoring system (RSS), ORs were summed (RSS1), and summed after natural-logarithmic transformation (RSS2). RSS1 and RSS2 were compared to the eighth edition of the American Joint Committee on Cancer (AJCC) staging system and the 2015 American Thyroid Association (ATA) guidelines for thyroid nodules and differentiated thyroid carcinoma.
Thyroid cancer is the most common type of malignant endocrine cancer, and its incidence is continuing to rise worldwide [1]. Papillary thyroid cancer (PTC) is the most frequent type of differentiated thyroid carcinoma (DTC), which accounts for at least 70% of all follicular-cell derived thyroid malignancies [2]. Although the prognosis of PTC is generally good, a minority of patients eventually die of the disease and an even greater proportion face morbidity due to recurrence [2]. Therefore, both optimization of long-term health outcomes and education of individuals with thyroid cancer about their potential prognosis are of critical importance.
Over the years, multiple staging systems have been developed to predict the risk of mortality in patients with DTC [3]. Several studies have demonstrated that previous staging systems consistently provide the highest proportion of variance explained when applied to a broad range of patient cohorts, and they have been validated in retrospective studies and prospectively in clinical practice. However, none of the staging systems has been shown to be clearly superior to the others [2,3]. This relative inability to accurately predict an individual patient’s risk of death from thyroid cancer may be related to the failure of current staging systems to adequately integrate the risk associated with other potentially important clinicopathologic features [2]. Moreover, none of these systems is based on evidence from a comprehensive meta-analysis of published studies. This underscores the need to develop an accurate and practical prognostic algorithm for predicting patients’ disease progression.
The aim of this study was to develop a scoring system that integrates clinical information from meta-analyses of published studies, thereby helping to stratify the risk of PTC and to select the proper management. Therefore, we conducted a systemic literature review, collected data from previous meta-analyses, developed a risk scoring system (RSS), and validated it with data from The Cancer Genome Atlas (TCGA).
We performed a systematic search of MEDLINE (from inception to February 2017) and Embase (from inception to February 2017) for English-language publications using the keywords “thyroid cancer,” “prognosis,” and “meta-analysis.” All searches were limited to human studies. The inclusion criteria were meta-analyses that investigated the prognostic value of risk factors in PTC. Abstracts and editorial materials were excluded. Two authors performed the searches and screening independently, and discrepancies were resolved by consensus.
Data regarding disease-free survival, recurrence-free survival, disease-free interval, and progression-free survival were obtained from the included studies, and were redefined as event-free survival (EFS). Odds ratios (ORs) with statistical significance were extracted from the publications, and the following information was recorded: OR, 95% confidence interval (CI), and histology. To generate the RSS, ORs were (1) summed (RSS1) and (2) summed after the natural logarithmic transformation (RSS2). For example, a 63-year-old man with a 2.8-cm classical PTC with extrathyroidal extension (ETE), lymph node (LN) metastasis, BRAF mutation, with no TERT mutation or distant metastasis would be rated as (1.53+2.69+2.83+3.34+1+1+3.24+1=16.63) in RSS1, and as (ln1.53+ln2.69+ln2.83+ln3.34+ln1+ln1+ln3.24+ln1=4.8366) in RSS2.
The primary and processed data were downloaded from the Genomic Data Commons Data Portal (https://portal.gdc.cancer.gov/) on January 2017. All TCGA data were available without restrictions for publications or presentations according to TCGA publication guidelines. We downloaded the data on somatic mutations and clinical information, which had most recently been updated in May 2016. Patients were categorized according to the eighth edition of the American Joint Committee on Cancer (AJCC) staging system [4] and the 2015 American Thyroid Association (ATA) guidelines for thyroid nodules and DTC [2]. RSS1 and RSS2 were calculated for each patient and categorized into two groups according to their respective cutoff value.
EFS was analysed with the log-rank test, and Kaplan-Meier survival plots were generated to validate the scoring systems. To evaluate the performance of the eighth edition of the AJCC system, the 2015 ATA guideline, RSS1, and RSS2, receiver operating characteristic (ROC) curve analysis was performed using the TCGA data, and the cutoff values of RSS1 and RSS2 were determined. Area under the ROC curve (AUC) was measured. For comparisons among models, the concordance index (C-index), Akaike information criterion (AIC), Bayesian information criterion (BIC), and Brier score were applied to quantify the predictive ability of a survival model [5], to select the statistical model [6], and to measure the accuracy of probabilistic predictions [7]. A higher C-index and a lower AIC, BIC, and Brier score indicated a better model for predicting outcomes. Statistical analyses were performed using GraphPad Prism 7 for Mac OSX (GraphPad Software Inc., San Diego, CA, USA), and R statistical software 3.5.0 (The R Foundation for Statistical Computing, Vienna, Austria, 2016).
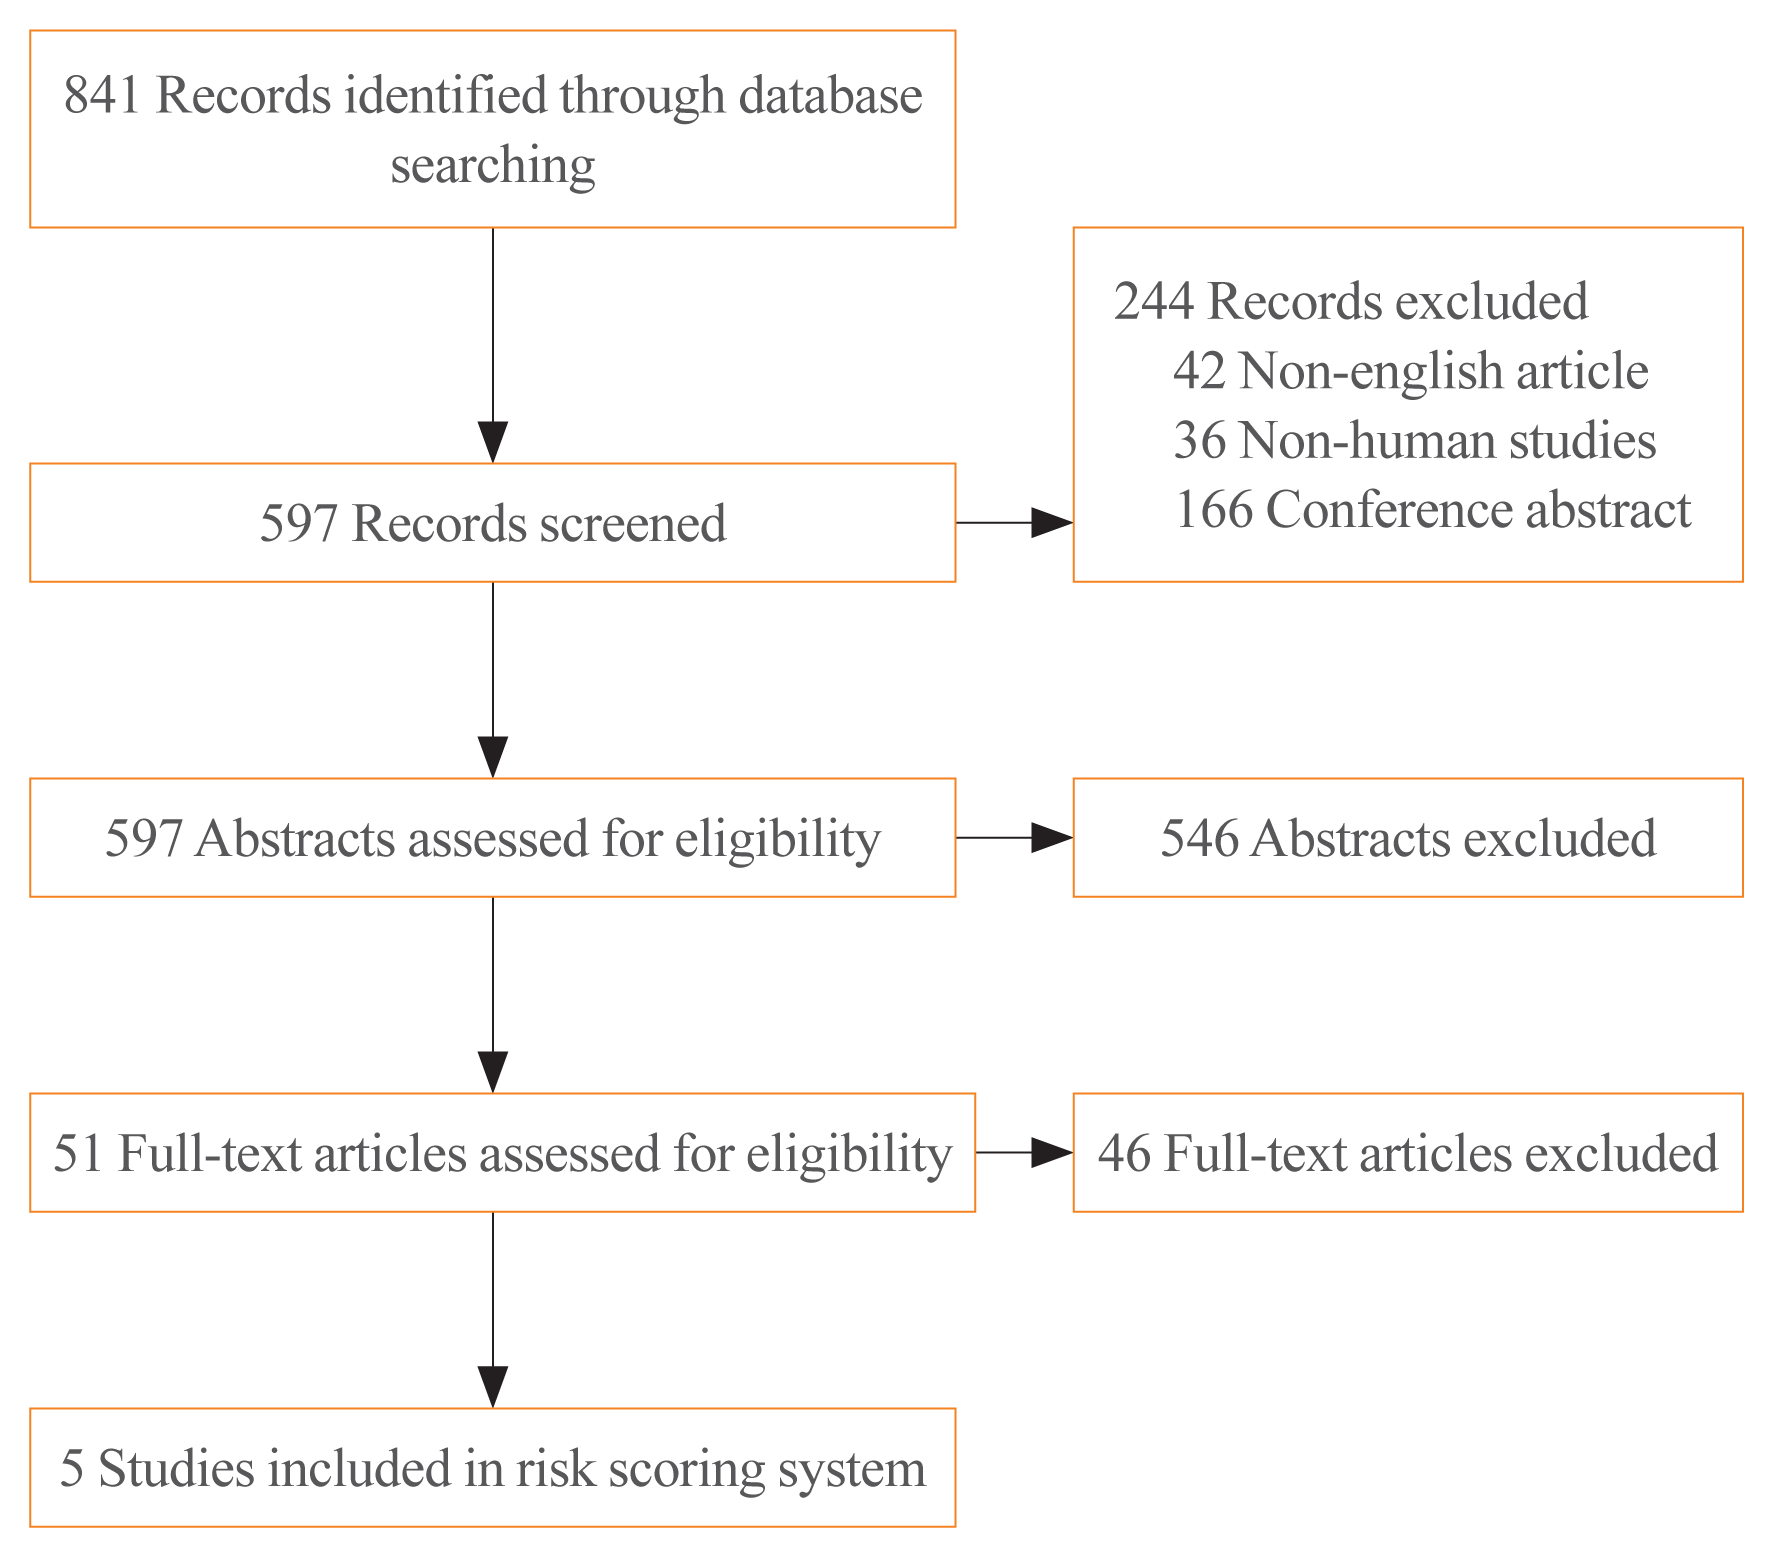
The electronic search identified 841 articles. Non-English-language articles (n=42), non-human studies (n=36), conference abstracts (n=166), and 546 studies that did not meet the inclusion criteria based on their title and abstract were excluded. After reviewing the full text of 51 articles, five meta-analyses were eligible for inclusion in the study. The process is shown in more detail in Fig. 1. Eight variables derived from the meta-analysis were included in the RSS: sex [8], tumour size (>2 cm) [8], ETE (microscopic) [8], BRAF mutation status [9], TERT mutation status [10], histologic subtype [11,12], LN metastasis [8], and distant metastasis (Table 1) [8]. The scores of each patient ranged from 7.52 to 27.59 for RSS1, and from −0.65 to 7.32 for RSS2.
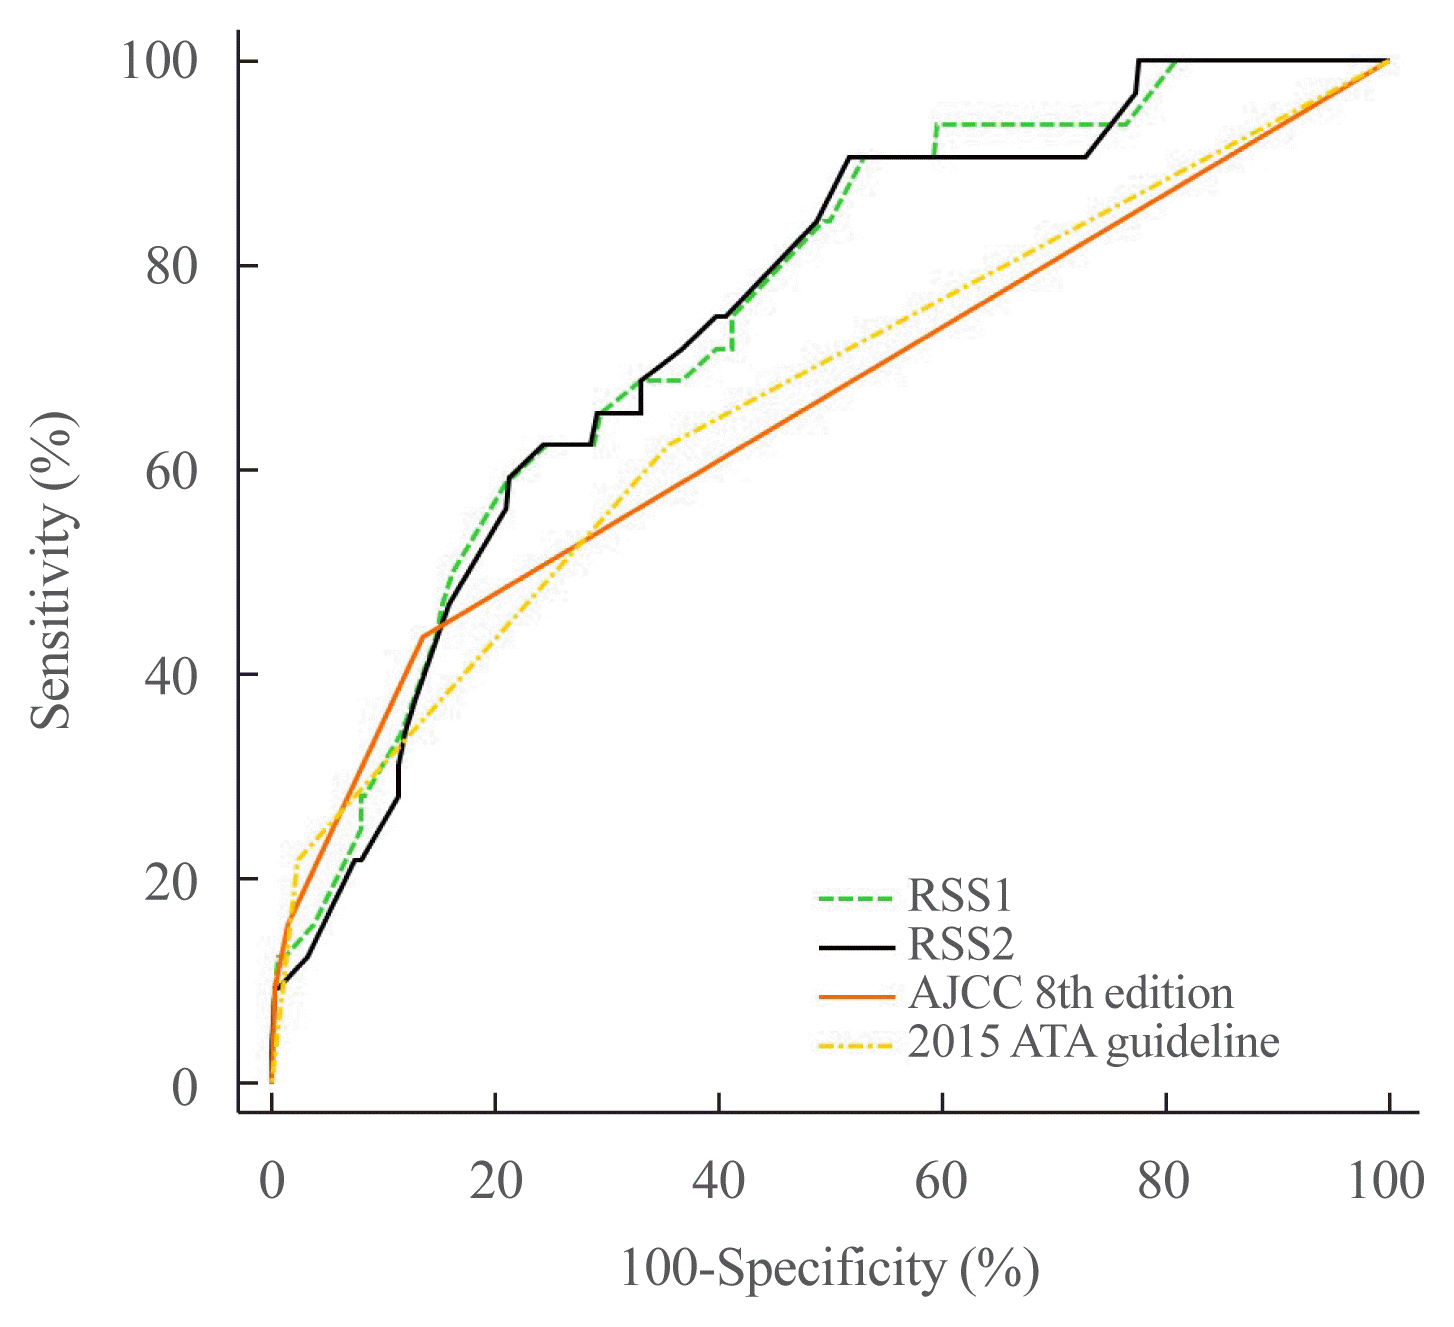
We confirmed that cutoff values of 13.93 for RSS1 and 2.03 for RSS2 were useful for predicting the prognosis of patients with PTC. The composite score for sensitivity and specificity (AUC) determined by ROC analysis was measured for each model (RSS1, RSS2, eighth edition of the AJCC, and the 2015 ATA guideline). The AUC of RSS1 was not significantly different from that of RSS2 (0.751 vs. 0.745, P=0.5513). However, the AUC of RSS1 was higher than those of both the eighth edition of the AJCC (0.751 vs. 0.659, P=0.0349) and the 2015 ATA guideline (0.751 vs. 0.666, P=0.0171). The AUC of RSS2 was not significantly different from that of the eighth edition of the AJCC (0.745 vs. 0.659, P=0.0506), but was significantly higher than that of the 2015 ATA guideline (0.745 vs. 0.666, P=0.0292) (Fig. 2).
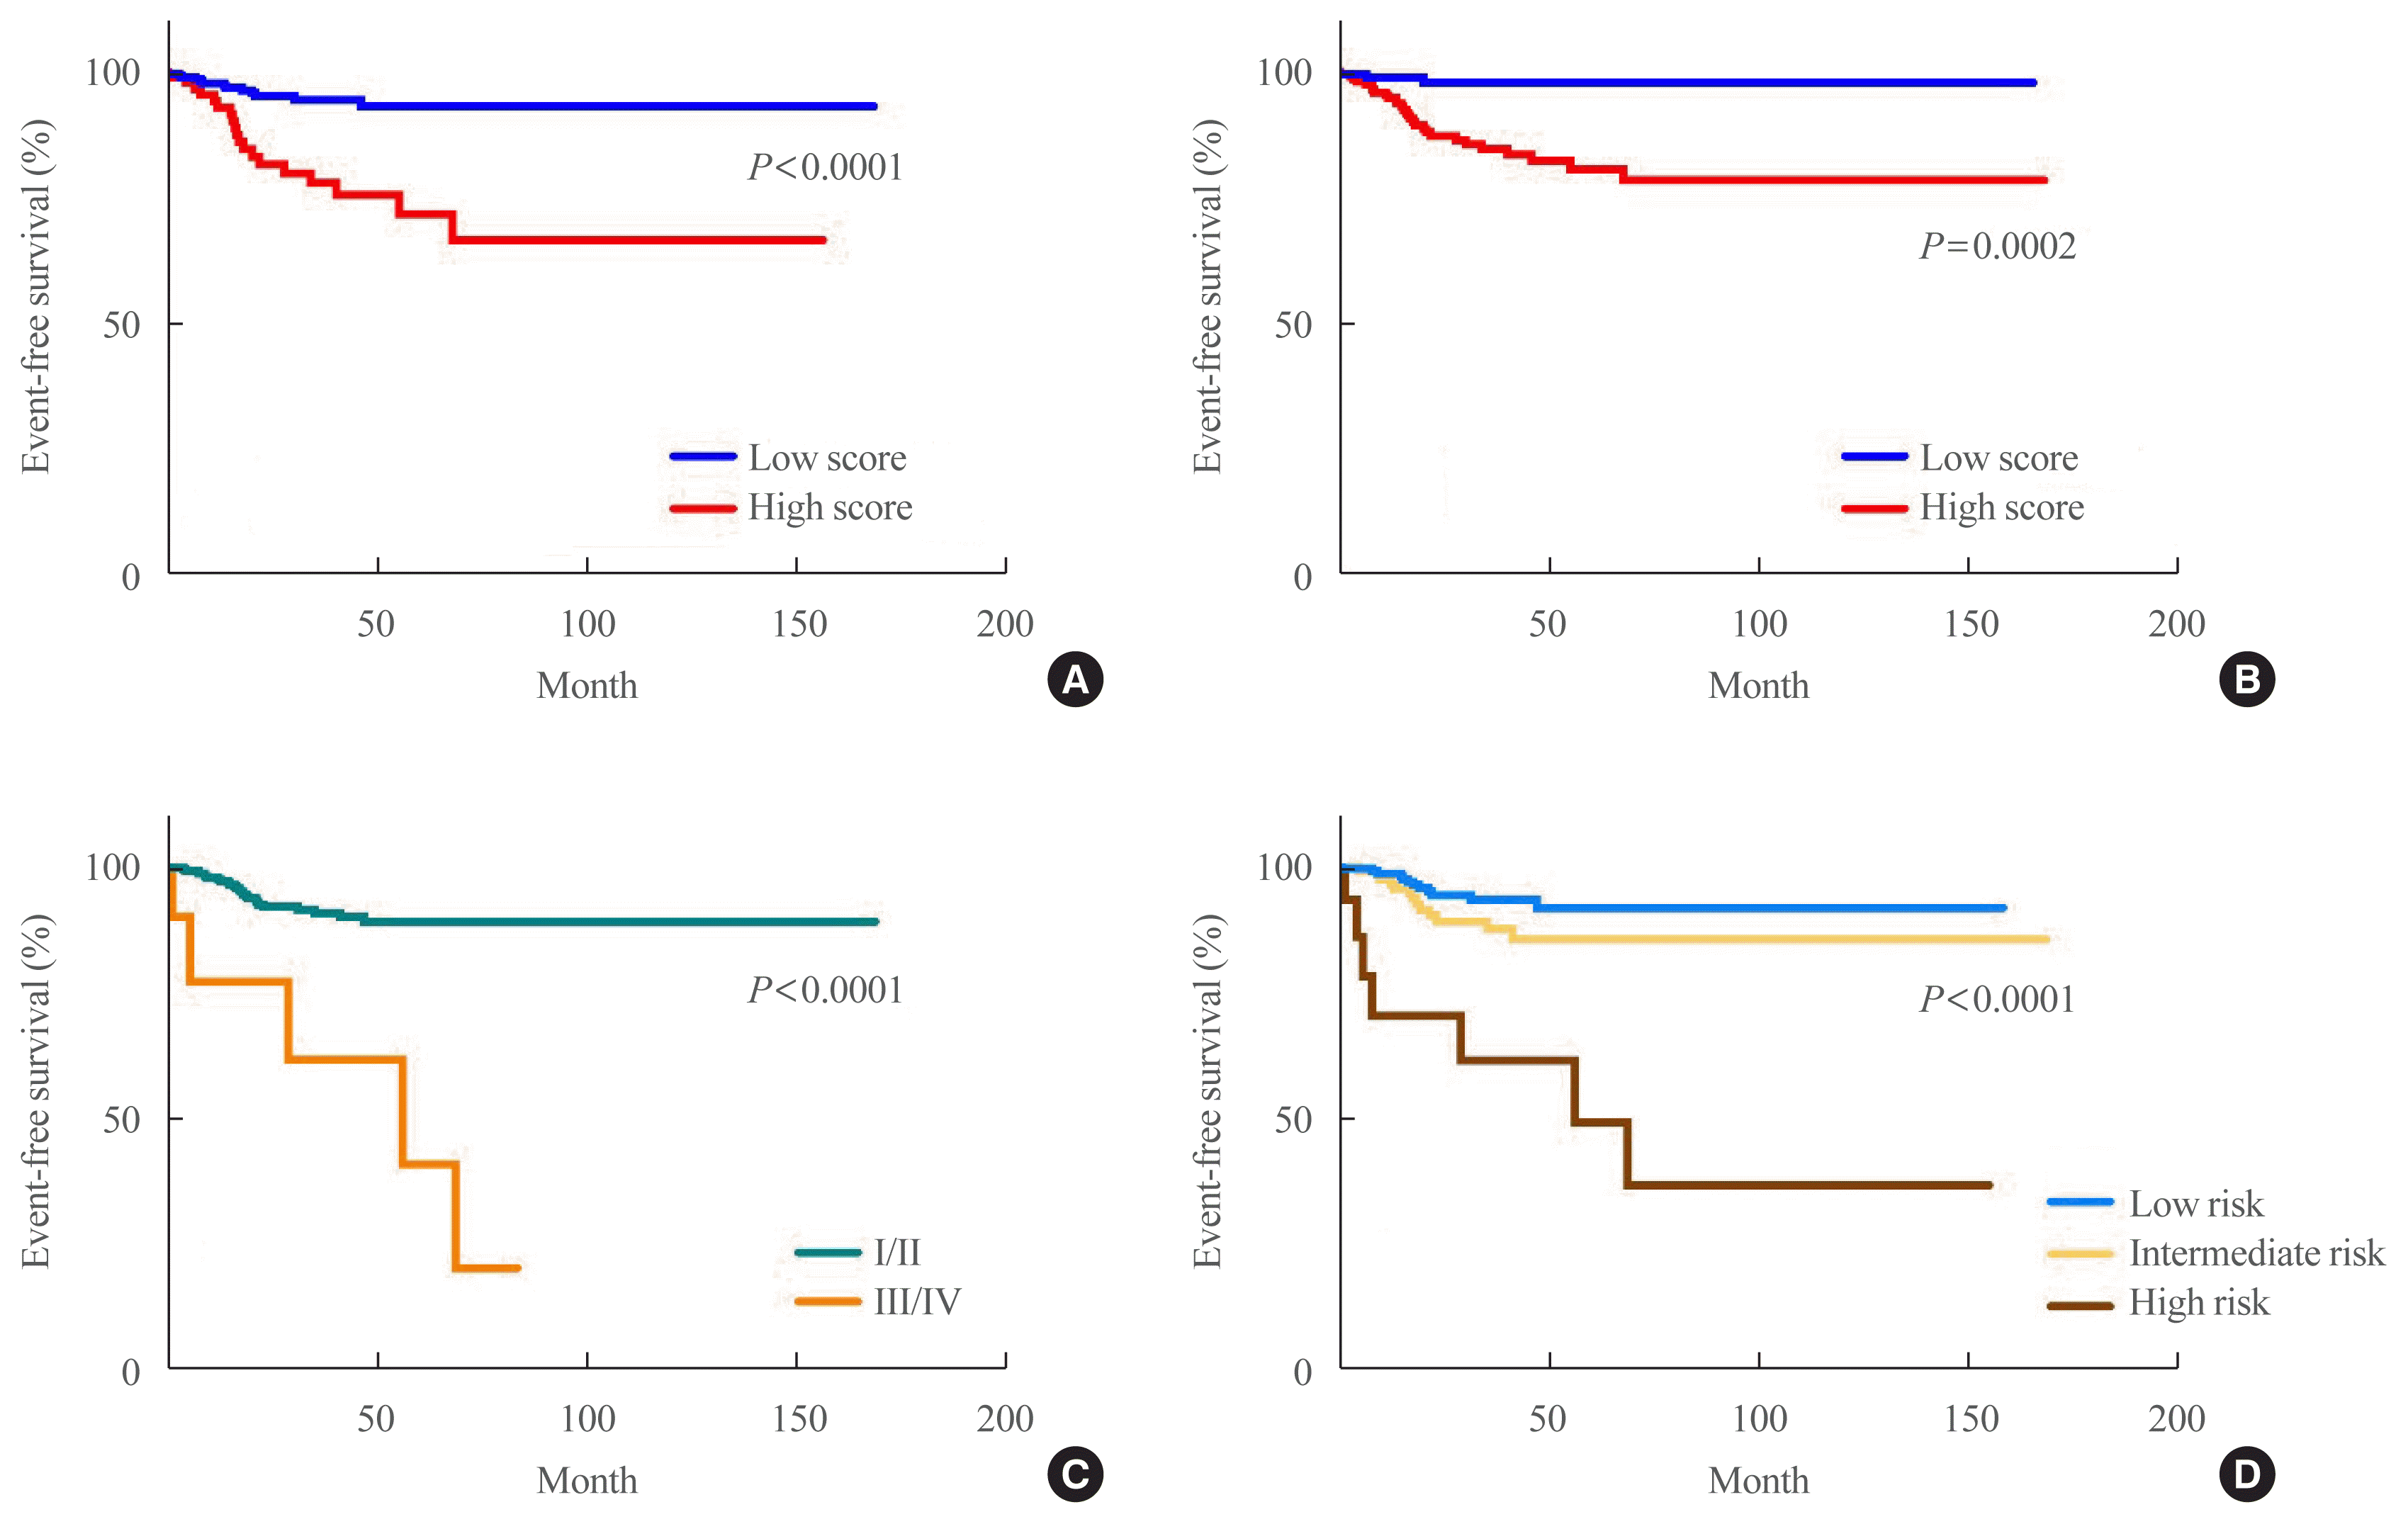
In total, 364 patients with PTC were included in this study (93 male, 271 female). Their mean age was 45.7 years. Of the 364 patients with PTC, 32 (8.8%) experienced recurrence/progression during the follow-up period (38.3±32.2 months). Patients’ characteristics are summarised in Table 2. Patients were dichotomised according to the RSS1 and RSS2 cut-offs. A survival analysis was conducted with the log-rank test for RSS1 (hazard ratio [HR], 4.241; 95% CI, 1.9541 to 9.6434; P<0.0001), RSS2 (HR, 6.9736; 95% CI, 3.4553 to 14.0743; P=0.0002), eighth edition of the AJCC (HR, 7.4592; 95% CI, 0.7834 to 71.0250; P<0.0001), and the 2015 ATA guideline (intermediate risk: HR, 1.9005; 95% CI, 0.9115 to 3.9628) (high risk: HR, 9.2530; 95% CI, 1.5019 to 57.0051; P<0.0001) (Fig. 3).
Among the models used, RSS1 showed the highest C-index and the second lowest AIC, BIC, and Brier score, making it the best model. The eighth edition of the AJCC had the second highest C-index, but the lowest AIC, and BIC. The 2015 ATA guideline showed the third highest C-index, the third lowest AIC and BIC, and the lowest Brier score (Table 3).
We developed and validated an RSS derived from previous meta-analyses to predict the prognosis of patients with PTC. Among the models used, RSS1 was shown to be better than the previously published systems.
At present, total thyroidectomy followed by radioactive iodine treatment together with life-long administration of thyroid hormone is the treatment strategy for most patients [2]. The biological behaviour of DTC is indolent and long-term survival is common, although the rate of recurrence is considerably higher [2]. Moreover, the overall risk of initial metastatic disease is 1% to 2% for PTC [13]. As a result, a number of studies have identified various clinicopathologic predictors for PTC and devised risk-group stratification or staging systems to select patients at high risk of cancer death for more aggressive surgical and adjuvant treatment, while those at low risk would be spared from the burden of aggressive treatment [2]. Individual therapy of a patient could be planned according to his or her risk group, and the survival of the patient would be estimated based on the appropriate therapy. This approach is known as stage-specific treatment.
Postoperative staging for thyroid cancer, as for other cancer types, is used (1) to provide prognostic information, which is of value when considering disease surveillance and therapeutic strategies, and (2) to enable a risk-stratified description of patients to facilitate communication among health care professionals, tracking by cancer registries, and research [2,3]. Several prognostic factors for DTC have been studied intensively since the 1980s and numerous staging classification systems have been proposed to predict outcomes for patients and to select individualized therapy, but there are some limitations of these systems [14]. Moreover, none of the existing systems is adequate for predicting outcomes in every population [14]. Undoubtedly, there is room for improvement, as none of the examined anatomic staging systems are able to account for the small proportion of cancer-related deaths in the so-called low-risk group. It is possible that more powerful prognostic biological factors and molecular markers could be added to existing staging systems in the future in order to improve survival prediction [3]. In this context, both the AJCC/Union for International Cancer Control staging system [4] and the ATA DTC management guidelines and RSS [2] were recently revised to improve their predictive power. Recently, molecular markers and clinical risk assessments with respect to DTC have been rigorously investigated, showing considerable evidence on prognostic significance [15]. As a result, the 2015 ATA guideline conveys a positive message, as it shows that mutational analysis of thyroid cancer has the potential to refine risk estimates [16]. This newly proposed system was shown to provide a more realistic estimate of prognosis for patients with PTC [17,18]. The newly developed scoring system in this study was shown to be more accurate in predicting patient outcomes than the eighth edition of the AJCC [4] and the 2015 ATA guideline [2]. Moreover, the predictors used in this model are readily available in routine clinical practice and easy to use.
A new staging classification should be developed in two steps: first, it should be generated and then it should be validated [19]. In the current study, a validated prognostic system following these two steps was presented. Our RSS was developed and then validated with 364 patients with full data on BRAF mutation status histology. Although there have been numerous attempts to compare the predictive power of staging systems for DTC, the majority of those studies either compared a limited number of systems or failed to make use of an objective comparative measurement to assess predictive power [3]. We used four different types of statistical analyses to compare the predictive accuracy of each staging system. All prognostic systems, including the present model, were valuable for identifying EFS in patients with PTC. Among the four methods, our meta-analysis-derived proposal was superior for determining the outcomes of patients with PTC. We think that the use of this scoring system will reduce overtreatment and its complications/sequelae, while providing relatively conservative cancer treatment with equally good outcomes.
This study has some limitations. All data were retrospectively collected, which limits the conclusions that can be drawn from the study. New, larger studies should be carried out to clarify the role of this tool. In addition, we could not analyse overall survival data, because only two patients died from PTC in the database from TCGA, reflecting the favourable prognosis of this condition. In addition, the eighth edition of AJCC was generated to predict the risk of survival (death), not the risk of recurrence; however, since the eighth edition of the AJCC and the 2015 ATA guideline are the most commonly used prognostic systems in clinical settings, we adopted both of them in this study. Furthermore, since we developed our RSS based on data from previous meta-analyses, we could not include risk factors that were not reported in the meta-analyses, such as mRNA [20] or miRNA markers [21].
In conclusion, we developed and validated a new RSS derived from previous meta-analyses for patients with PTC that incorporates information on sex, tumour size, ETE, BRAF mutation status, TERT mutation status, histologic subtype, LN metastasis, and distant metastasis. Based on a comparison with the eighth edition of the AJCC and the 2015 ATA guideline, this RSS appears to be superior to previously published systems.
REFERENCES
2. Haugen BR, Alexander EK, Bible KC, Doherty GM, Mandel SJ, Nikiforov YE, et al. 2015 American Thyroid Association management guidelines for adult patients with thyroid nodules and differentiated thyroid cancer: the American Thyroid Association Guidelines Task Force on thyroid nodules and differentiated thyroid cancer. Thyroid. 2016; 26:1–133.
3. Lang BH, Lo CY, Chan WF, Lam KY, Wan KY. Staging systems for papillary thyroid carcinoma: a review and comparison. Ann Surg. 2007; 245:366–78.
4. Edge SB. American Joint Committee on Cancer. AJCC cancer staging manual. 8th ed. New York: Springer;2016.
5. Pitoia F, Jerkovich F, Urciuoli C, Schmidt A, Abelleira E, Bueno F, et al. Implementing the modified 2009 American Thyroid Association risk stratification system in thyroid cancer patients with low and intermediate risk of recurrence. Thyroid. 2015; 25:1235–42.
7. Ikeda M, Ishigaki T, Yamauchi K. Relationship between Brier score and area under the binormal ROC curve. Comput Methods Programs Biomed. 2002; 67:187–94.
8. Guo K, Wang Z. Risk factors influencing the recurrence of papillary thyroid carcinoma: a systematic review and meta-analysis. Int J Clin Exp Pathol. 2014; 7:5393–403.
9. Chen Y, Li Y, Zhou X. BRAF mutation in papillary thyroid cancer: a meta-analysis. Int J Clin Exp Med. 2016; 9:13259–67.
10. Yin DT, Yu K, Lu RQ, Li X, Xu J, Lei M, et al. Clinicopathological significance of TERT promoter mutation in papillary thyroid carcinomas: a systematic review and meta-analysis. Clin Endocrinol (Oxf). 2016; 85:299–305.
11. Malandrino P, Russo M, Regalbuto C, Pellegriti G, Moleti M, Caff A, et al. Outcome of the diffuse sclerosing variant of papillary thyroid cancer: a meta-analysis. Thyroid. 2016; 26:1285–92.
12. Yang J, Gong Y, Yan S, Shi Q, Zhu J, Li Z, et al. Comparison of the clinicopathological behavior of the follicular variant of papillary thyroid carcinoma and classical papillary thyroid carcinoma: a systematic review and meta-analysis. Mol Clin Oncol. 2015; 3:753–64.
13. Mazzaferri EL, Jhiang SM. Long-term impact of initial surgical and medical therapy on papillary and follicular thyroid cancer. Am J Med. 1994; 97:418–28.
14. Yildirim E. A model for predicting outcomes in patients with differentiated thyroid cancer and model performance in comparison with other classification systems. J Am Coll Surg. 2005; 200:378–92.
15. Tavares C, Melo M, Cameselle-Teijeiro JM, Soares P, Sobrinho-Simoes M. Endocrine tumours: genetic predictors of thyroid cancer outcome. Eur J Endocrinol. 2016; 174:R117–26.
16. Pak K, Lee SH, Lee JG, Seok JW, Kim IJ. Comparison of visceral fat measures with cardiometabolic risk factors in healthy adults. PLoS One. 2016; 11:e0153031.
17. Lee SG, Lee WK, Lee HS, Moon J, Lee CR, Kang SW, et al. Practical performance of the 2015 American Thyroid Association guidelines for predicting tumor recurrence in patients with papillary thyroid cancer in South Korea. Thyroid. 2017; 27:174–81.
18. Nixon IJ, Wang LY, Migliacci JC, Eskander A, Campbell MJ, Aniss A, et al. An international multi-institutional validation of age 55 years as a cutoff for risk stratification in the AJCC/UICC staging system for well-differentiated thyroid cancer. Thyroid. 2016; 26:373–80.
19. Brierley JD, Panzarella T, Tsang RW, Gospodarowicz MK, O’Sullivan B. A comparison of different staging systems predictability of patient outcome. Thyroid carcinoma as an example. Cancer. 1997; 79:2414–23.
Table 1
Variable | Odds ratio | 95% CI | Study | No. of studies included in the meta-analysis |
---|---|---|---|---|
Sex | Guo et al. | 13 | ||
Female | 1 | (2014) [8] | ||
Male | 1.53 | 1.28–1.84 | ||
|
||||
Tumour size, cm | Guo et al. | 6 | ||
≤2 | 1 | (2014) [8] | ||
>2 | 2.69 | 2.06–3.50 | ||
|
||||
Extrathyroidal extension (microscopic) | Guo et al. (2014) [8] | 12 | ||
No | 1 | |||
Yes | 2.83 | 2.32–3.44 | ||
|
||||
BRAF mutation | Chen et al. | 8 | ||
No | 1 | (2016) [9] | ||
Yes | 3.34 | 2.36–4.73 | ||
|
||||
TERT mutation | Yin et al. | 3 | ||
No | 1 | (2016) [10] | ||
Yes | 5.73 | 3.55–9.26 | ||
|
||||
Histologic subtype | ||||
Classical and other | 1 | |||
Follicular | 0.52 | 0.34–0.80 | Yang et al. (2015) [12] | 8 |
Diffuse sclerosing | 3.19 | 1.86–5.49 | Malandrino et al. (2016) [11] | 7 |
|
||||
LN metastasis | ||||
No | 1 | |||
Yes | 3.24 | 2.61–4.02 | Guo et al. (2014) [8] | 8 |
|
||||
Distant metastasis | ||||
No | 1 | |||
Yes | 11.96 | 8.43–16.97 | Guo et al. (2014) [8] | 4 |