INTRODUCTION
METHODS
Subjects and study design
Lactobacillus sakei
Primary outcome and secondary outcomes
Assessment of body composition
Measurement of biochemical parameters
Statistical analysis
RESULTS
Baseline characteristics
Table 1
SBP, systolic blood pressure; DBP, diastolic blood pressure; HbA1c, glycated hemoglobin; HOMA-IR, homeostasis model assessment of insulin resistance; HDL-C, high-density lipoprotein cholesterol; LDL-C, low-density lipoprotein cholesterol; ALP, alkaline phosphatase; AST, aspartate aminotransferase; ALT, alanine aminotransferase; BUN, blood urea nitrogen; TSH, thyroid stimulating hormone.
Participant disposition through the study period and compliance with the medication
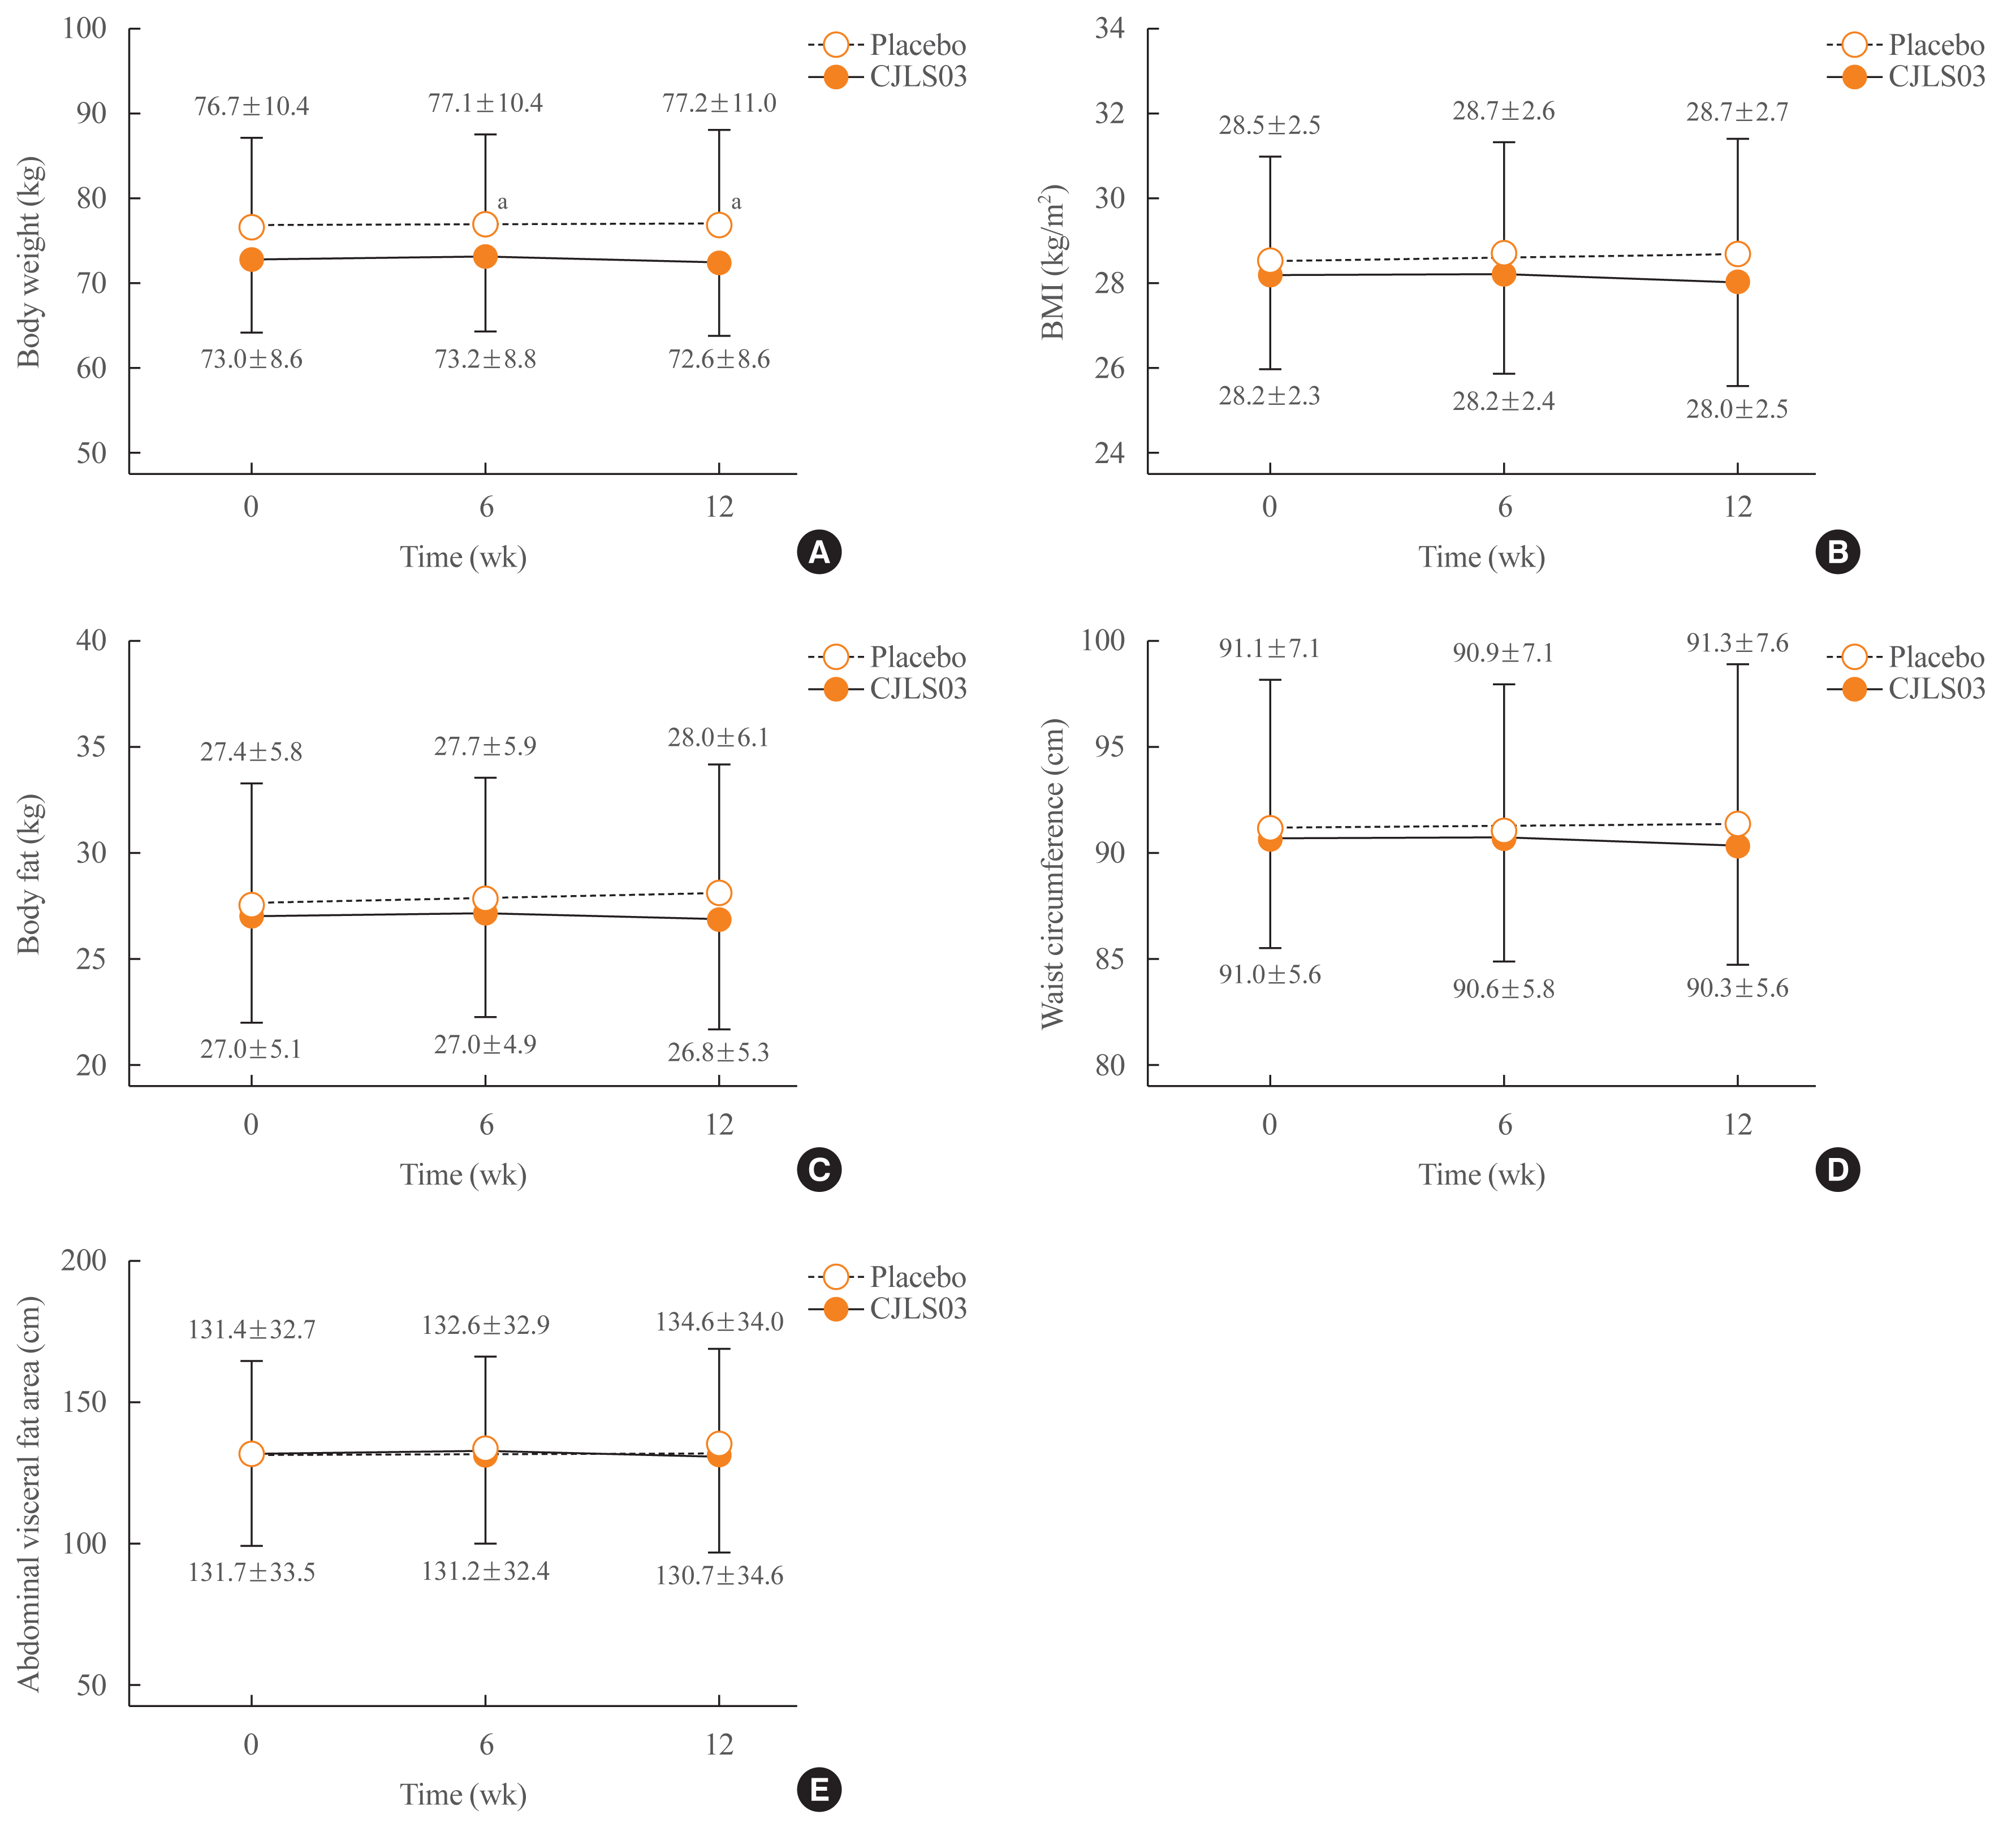
Primary outcome: change in body fat
 | Fig. 3Differences in (A) body weight, (B) body mass index (BMI), (C) body fat, (D) waist circumference, and (E) abdominal visceral fat area between the Lactobacillus sakei (CJLS03) and placebo groups after 6 and 12 weeks. aP<0.05 for L. sakei vs. placebo. |
Table 2
| Variable | L. sakei (CJLS03) (n=47) | Placebo (n=48) | P valuea | ||||
|---|---|---|---|---|---|---|---|
|
|
|
||||||
| Baseline | 12 weeks | P value | Baseline | 12 weeks | P value | ||
| Body weight, kg | 73.0±8.6 | 72.6±8.6 | 0.352 | 76.7±10.4 | 77.2±11.0 | 0.034 | 0.058 |
|
|
|||||||
| Body mass index, kg/m2 | 28.2±2.3 | 28.0±2.5 | 0.360 | 28.5±2.5 | 28.7±2.7 | 0.033 | 0.065 |
|
|
|||||||
| Body fat, kg | 27.0±5.1 | 26.8±5.3 | 0.454 | 27.4±5.8 | 28.0±6.1 | 0.003 | 0.018 |
|
|
|||||||
| Waist circumference, cm | 91.0±5.6 | 90.3±5.6 | 0.017 | 91.1±7.1 | 91.3±7.6 | 0.301 | 0.013 |
|
|
|||||||
| Abdominal visceral fat, cm2 | 131.7±33.5 | 130.7±34.6 | 0.554 | 131.4±32.7 | 134.6±34.0 | 0.003 | 0.035 |
|
|
|||||||
| Whole body muscle mass, kg | 41.5±7.6 | 41.3±7.6 | 0.203 | 44.5±9.4 | 44.4±9.3 | 0.139 | 0.853 |
Secondary outcomes
Changes in other anthropometric and body composition parameters
Changes in blood pressure and biochemical parameters
Table 3
| Variable | L. sakei (CJLS03) (n=47) | Placebo (n=48) | P valuea | ||||
|---|---|---|---|---|---|---|---|
|
|
|
||||||
| Baseline | 12 weeks | P value | Baseline | 12 weeks | P value | ||
| SBP, mm Hg | 126.0±12.9 | 128.6±10.0 | 0.131 | 124.6±11.2 | 126.2±10.8 | 0.251 | 0.678 |
|
|
|||||||
| DBP, mm Hg | 78.4±10.2 | 78.0±9.6 | 0.788 | 75.4±8.8 | 78.8±9.5 | 0.003 | 0.026 |
|
|
|||||||
| Fasting glucose, mg/dL | 101.8±10.8 | 102.5±15.8 | 0.659 | 103.8±17.7 | 103.1±13.4 | 0.690 | 0.553 |
|
|
|||||||
| HbA1c, % | 5.7±0.4 | 5.8±0.5 | 0.223 | 5.6±0.7 | 5.6±0.5 | 0.170 | 0.672 |
|
|
|||||||
| Insulin, μIU/mL | 10.9±3.9 | 11.5±6.9 | 0.514 | 11.5±4.9 | 13.1±9.6 | 0.217 | 0.487 |
|
|
|||||||
| HOMA-IR | 2.8±1.1 | 2.9±1.8 | 0.444 | 3.0±2.0 | 3.4±2.7 | 0.283 | 0.583 |
|
|
|||||||
| Glucagon, pg/mL | 174.8±131.6 | 180.7±138.4 | 0.603 | 167.2±111.0 | 163.0±100.2 | 0.689 | 0.512 |
|
|
|||||||
| Uric acid, mg/dL | 5.1±1.1 | 5.0±1.1 | 0.088 | 5.6±1.6 | 5.6±1.6 | 0.659 | 0.404 |
|
|
|||||||
| Protein, g/dL | 7.4±0.3 | 7.4±0.4 | 0.447 | 7.4±0.4 | 7.4±0.3 | 0.397 | 0.255 |
|
|
|||||||
| Albumin, g/dL | 4.4±0.2 | 4.4±0.2 | 0.945 | 4.4±0.2 | 4.5±0.2 | 0.013 | 0.091 |
|
|
|||||||
| Total bilirubin, mg/dL | 0.73±0.22 | 0.75±0.29 | 0.409 | 0.79±0.30 | 0.77±0.27 | 0.404 | 0.239 |
|
|
|||||||
| Total cholesterol, mg/dL | 201.3±28.4 | 197.4±43.2 | 0.465 | 199.0±36.1 | 205.2±40.7 | 0.058 | 0.105 |
|
|
|||||||
| Triglyceride, mg/dL | 125.6±64.1 | 129.0±83.2 | 0.754 | 128.3±62.0 | 134.2±63.5 | 0.461 | 0.850 |
|
|
|||||||
| HDL-C, mg/dL | 54.4±9.7 | 55.1±9.6 | 0.375 | 52.6±11.4 | 53.5±9.6 | 0.387 | 0.907 |
|
|
|||||||
| LDL-C, mg/dL | 116.8±20.4 | 115.6±24.0 | 0.620 | 117.1±27.4 | 118.2±28.6 | 0.626 | 0.486 |
|
|
|||||||
| Apolipoprotein A1, mg/dL | 142.3±17.0 | 144.1±15.8 | 0.242 | 138.3±22.9 | 139.9±18.2 | 0.480 | 0.913 |
|
|
|||||||
| Apolipoprotein B, mg/dL | 105.2±18.3 | 104.9±20.0 | 0.849 | 104.5±23.1 | 108.9±30.3 | 0.082 | 0.136 |
|
|
|||||||
| Free fatty acid, μEq/L | 675.2±250.9 | 574.9±217.1 | 0.011 | 563.9±199.8 | 569.7±216.3 | 0.868 | 0.041 |
|
|
|||||||
| ALP, IU/L | 75.2±21.3 | 78.2±23.0 | 0.117 | 70.0±16.4 | 72.6±17.7 | 0.020 | 0.870 |
|
|
|||||||
| AST, IU/L | 26.3±12.2 | 27.5±21.7 | 0.572 | 24.8±8.3 | 27.2±12.8 | 0.074 | 0.620 |
|
|
|||||||
| ALT, IU/L | 28.4±21.4 | 30.3±34.0 | 0.594 | 26.8±17.8 | 35.0±46.9 | 0.197 | 0.390 |
|
|
|||||||
| BUN, mg/dL | 12.6±3.4 | 12.8±3.2 | 0.576 | 13.4±3.2 | 13.7±3.6 | 0.428 | 0.855 |
|
|
|||||||
| Creatinine, mg/dL | 0.69±0.16 | 0.69±0.17 | 0.745 | 0.74±0.18 | 0.73±0.18 | 0.497 | 0.461 |
|
|
|||||||
| Calcium, mg/dL | 9.2±0.3 | 9.2±0.3 | 0.879 | 9.2±0.3 | 9.3±0.3 | 0.041 | 0.144 |
|
|
|||||||
| Phosphorus, mg/dL | 3.6±0.4 | 3.5±0.4 | 0.052 | 3.5±0.5 | 3.5±0.5 | 0.679 | 0.273 |
Values are expressed as mean±standard deviation. P values were calculated using paired t tests between the baseline and after 12 weeks.
SBP, systolic blood pressure; DBP, diastolic blood pressure; HbA1c, glycated hemoglobin; HOMA-IR, homeostasis model assessment of insulin resistance; HDL-C, high-density lipoprotein cholesterol; LDL-C, low-density lipoprotein cholesterol; ALP, alkaline phosphatase; AST, aspartate aminotransferase; ALT, alanine aminotransferase; BUN, blood urea nitrogen.


 PDF
PDF Citation
 Print
Print


 XML Download