

 PDF
PDF Citation
 Print
Print


INTRODUCTION
Discordances between glycated hemoglobin (HbA1c) levels and other markers of glycemic control are common in clinical practice [1]. Mismatches of actual HbA1c levels (i.e., higher or lower) with the expected mean blood glucose (MBG)–based HbA1c levels can limit the accuracy of HbA1c measurements for diabetes diagnosis and management [1]. Regardless of the presence of type 2 diabetes mellitus (T2DM), HbA1c has been reported to have interindividual variations that are caused by factors other than MBG levels, including genetic factors and differences in erythrocyte lifespan, mean erythrocyte age, and hemoglobin glycation rates [2]. Most previous studies have calculated the hemoglobin glycation index (HGI) as the difference between the measured HbA1c level and that predicted using fasting blood glucose (FBG) levels [3–7]. Concerns have been raised that a high HGI may reflect hyperglycemia at times that cannot be captured by the FBG or self-monitored blood glucose [8]. Although FBG estimations correlate well with MBG levels, these can widely vary, and methodologies that use 6- or 8-point glucose profiles provide better representations of MBG levels. The availability of continuous glucose monitoring (CGM) with large data and better reflection of postprandial peaks could help in the calculation of MBG levels, but the potential of CGM for HGI calculation has not been explored [1].
Cohen et al. [9] suggested that the glycation gap could explain interindividual variations in HbA1c levels. The glycation gap is defined as the difference between actual HbA1c levels and those predicted based on the fructosamine concentration [10]. Moreover, we reported that the glycation gap determined using glycated albumin (GA) was consistent and reliable [11]. The time frame of glycemic control represented by fructosamine or GA is shorter than that represented by HbA1c. The 6- to 12-week time frame required for HbA1c to equilibrate is an important consideration when comparing it with the shorter-term measure of GA. Some researchers have argued that the glycation gap occurs due to differences in the time frame of glycemic control assessed between GA-based measures and HbA1c [12]. Therefore, unlike previous studies, which were mainly conducted at 3- to 4-month intervals, this study simultaneously measured GA and HbA1c on the same day and repeated the tests at baseline and 1 month later. We aimed to investigate the short-term consistency of the glycation gap.
METHODS
Subjects
From April 2016 to June 2019, 36 patients with T2DM who visited clinics at Yeouido St. Mary’s Hospital were enrolled. HbA1c, GA, and FBG levels were measured simultaneously and a 72-hour CGM system was applied on the same day. The tests were repeated at baseline and 1 month later, without changing the T2DM management. The exclusion criteria were anemia (hemoglobin <10 g/dL), hemoglobinopathy, renal failure (estimated glomerular filtration rate <30 mL/min/1.73 m2), hypoalbuminemia (serum albumin <3.0 g/dL), pregnancy, and liver cirrhosis. This prospective cohort study was approved by the Catholic Medical Center Ethics Committee and was conducted in accordance with the Declaration of Helsinki (IRB No. SC16TTSI0066). All participants provided signed written informed consent.
Continuous glucose monitoring
We used CGM data that were measured with an iPro2 device (Medtronic MiniMed, Northridge, CA, USA). With the sensors placed in the subcutaneous tissue, the CGM system continuously measured glucose concentrations from glucose-oxidase reactions in the interstitial space. The glucose concentrations in the interstitial space were converted to blood glucose levels based on four daily calibrations with self-monitored blood glucose levels. The glucose concentrations were measured every 10 seconds and recorded as average values every 5 minutes by the sensors in the CGM system, which resulted in more accurate MBG levels over 24 hours.
Laboratory measurements
All blood samples were taken in the morning following a minimum 8-hour fast. The hexokinase method with the Beckman Glucose Analyzer (Beckman Coulter, Fullerton, CA, USA) was used to measure FBG. HbA1c levels were measured using automated high-performance liquid chromatography (HLC-723 G7, Tosoh, Tokyo, Japan), with the reference range at 4.0% to 6.0%. At an HbA1c level of 5.6%, the intra- and inter-assay coefficients of variation were 0.89% and 1.56%, respectively. GA levels were measured using a Toshiba 200FR analyzer (Toshiba Medical Systems, Tokyo, Japan) and an enzymatic method involving ketoamine oxidase, which is an albumin-specific proteinase, and an albumin detection reagent (Lucica GA-L, Asahi Kasei Pharma, Tokyo, Japan).
Calculation of the hemoglobin glycation index and glycation gap
The HGI was calculated as the measured HbA1c minus the predicted HbA1c. Three HGI values were calculated based on FBG, prebreakfast glucose, and MBG levels, respectively. Prebreakfast glucose was derived from the CGM and defined as the mean of the CGM blood glucose levels between 5:00 AM and breakfast. The correlation between HbA1c and MBG levels was examined using linear regression analysis and the following equation was established: Predicted HbA1c level=0.016×MBG (mg/dL)+5.082 (r=0.701, P<0.001) (Supplemental Fig. S1).
The predicted HbA1c, which was determined by the prebreakfast glucose or FBG level, was calculated by an equation generated in a previous study [3], as follows: Predicted HbA1c level=0.0143×FBG (mg/dL)×5.828 (r=0.67, P<0.001).
Using the HbA1c-GA regression equation, the glycation gap was calculated as the difference between the measured and GA-based predicted HbA1c levels. The following equation was established [11]: Predicted HbA1c level=0.146×GA level+4.722 (r=0.749, P<0.001).
Statistical analysis
All data were reported as the mean±standard deviation or number (percentage). The paired t test was used to compare changes in the HGI and glycation gap between baseline and 1 month. Pearson correlation coefficients were calculated between the HGI and the other variables. All data were analyzed using the SPSS statistical package version 22 (IBM Corp., Armonk, NY, USA), and a P<0.05 was considered to indicate statistical significance.
RESULTS
General characteristics
In total, 36 patients participated in this study, of whom 16 (44%) were men. Participants’ mean age and T2DM duration were 56.9±9.4 and 15.1±8.1 years, respectively. The baseline values were 170.8±36.8 mg/dL for FBG, 8.0%±0.9% for HbA1c, and 20.9%±4.1% for GA. The antidiabetic mediations were insulin in six participants, sulfonylurea in 24 participants, and dipeptidyl peptidase-4 inhibitors in 28 participants. The baseline serum creatinine, hemoglobin, and albumin levels were 0.73±0.2 mg/dL, 14.2±1.7 g/dL, and 4.40±0.28 g/dL, respectively (Table 1).
Table 1
General Characteristics of the Study Participants
![]()
Reproducibility of the hemoglobin glycation index and glycation gap
To determine the reproducibility of the HGI and glycation gap, we measured HbA1c, GA, and FBG levels and performed 72-hour CGM at a 1-month interval without changing patients’ T2DM management strategy. HbA1c, GA, FBG, and MBG levels tended to decrease during the study period. No significant differences were found between the baseline and 1-month values for the glycation gap (0.27±0.58 vs. 0.22±0.57, respectively; P=0.273) (Table 2) or any of the three HGI measurements (i.e., FBG-, prebreakfast glucose-, and MBG-based HGI).
Table 2
Changes in the HGI and Glycation Gap after 1 Month
![]()
The MBG-based HGI on the first visit was plotted on the x-axis against the MBG-based HGI on the second visit on the y-axis. A strong correlation was observed between the first and second MBG-based HGI measurements (r=0.729, P<0.001) (Fig. 1C), with a y-intercept of 0 and a positive slope. Moreover, there was a correlation between the first and second prebreakfast glucose-based HGI measurements (r=0.843, P<0.001) (Fig. 1D). A strong correlation was also observed between the first and second glycation gap (r=0.888, P<0.001) (Fig. 1A) or between the first and second FBG-based HGI measurements (r=0.691, P<0.001) (Fig. 1B).
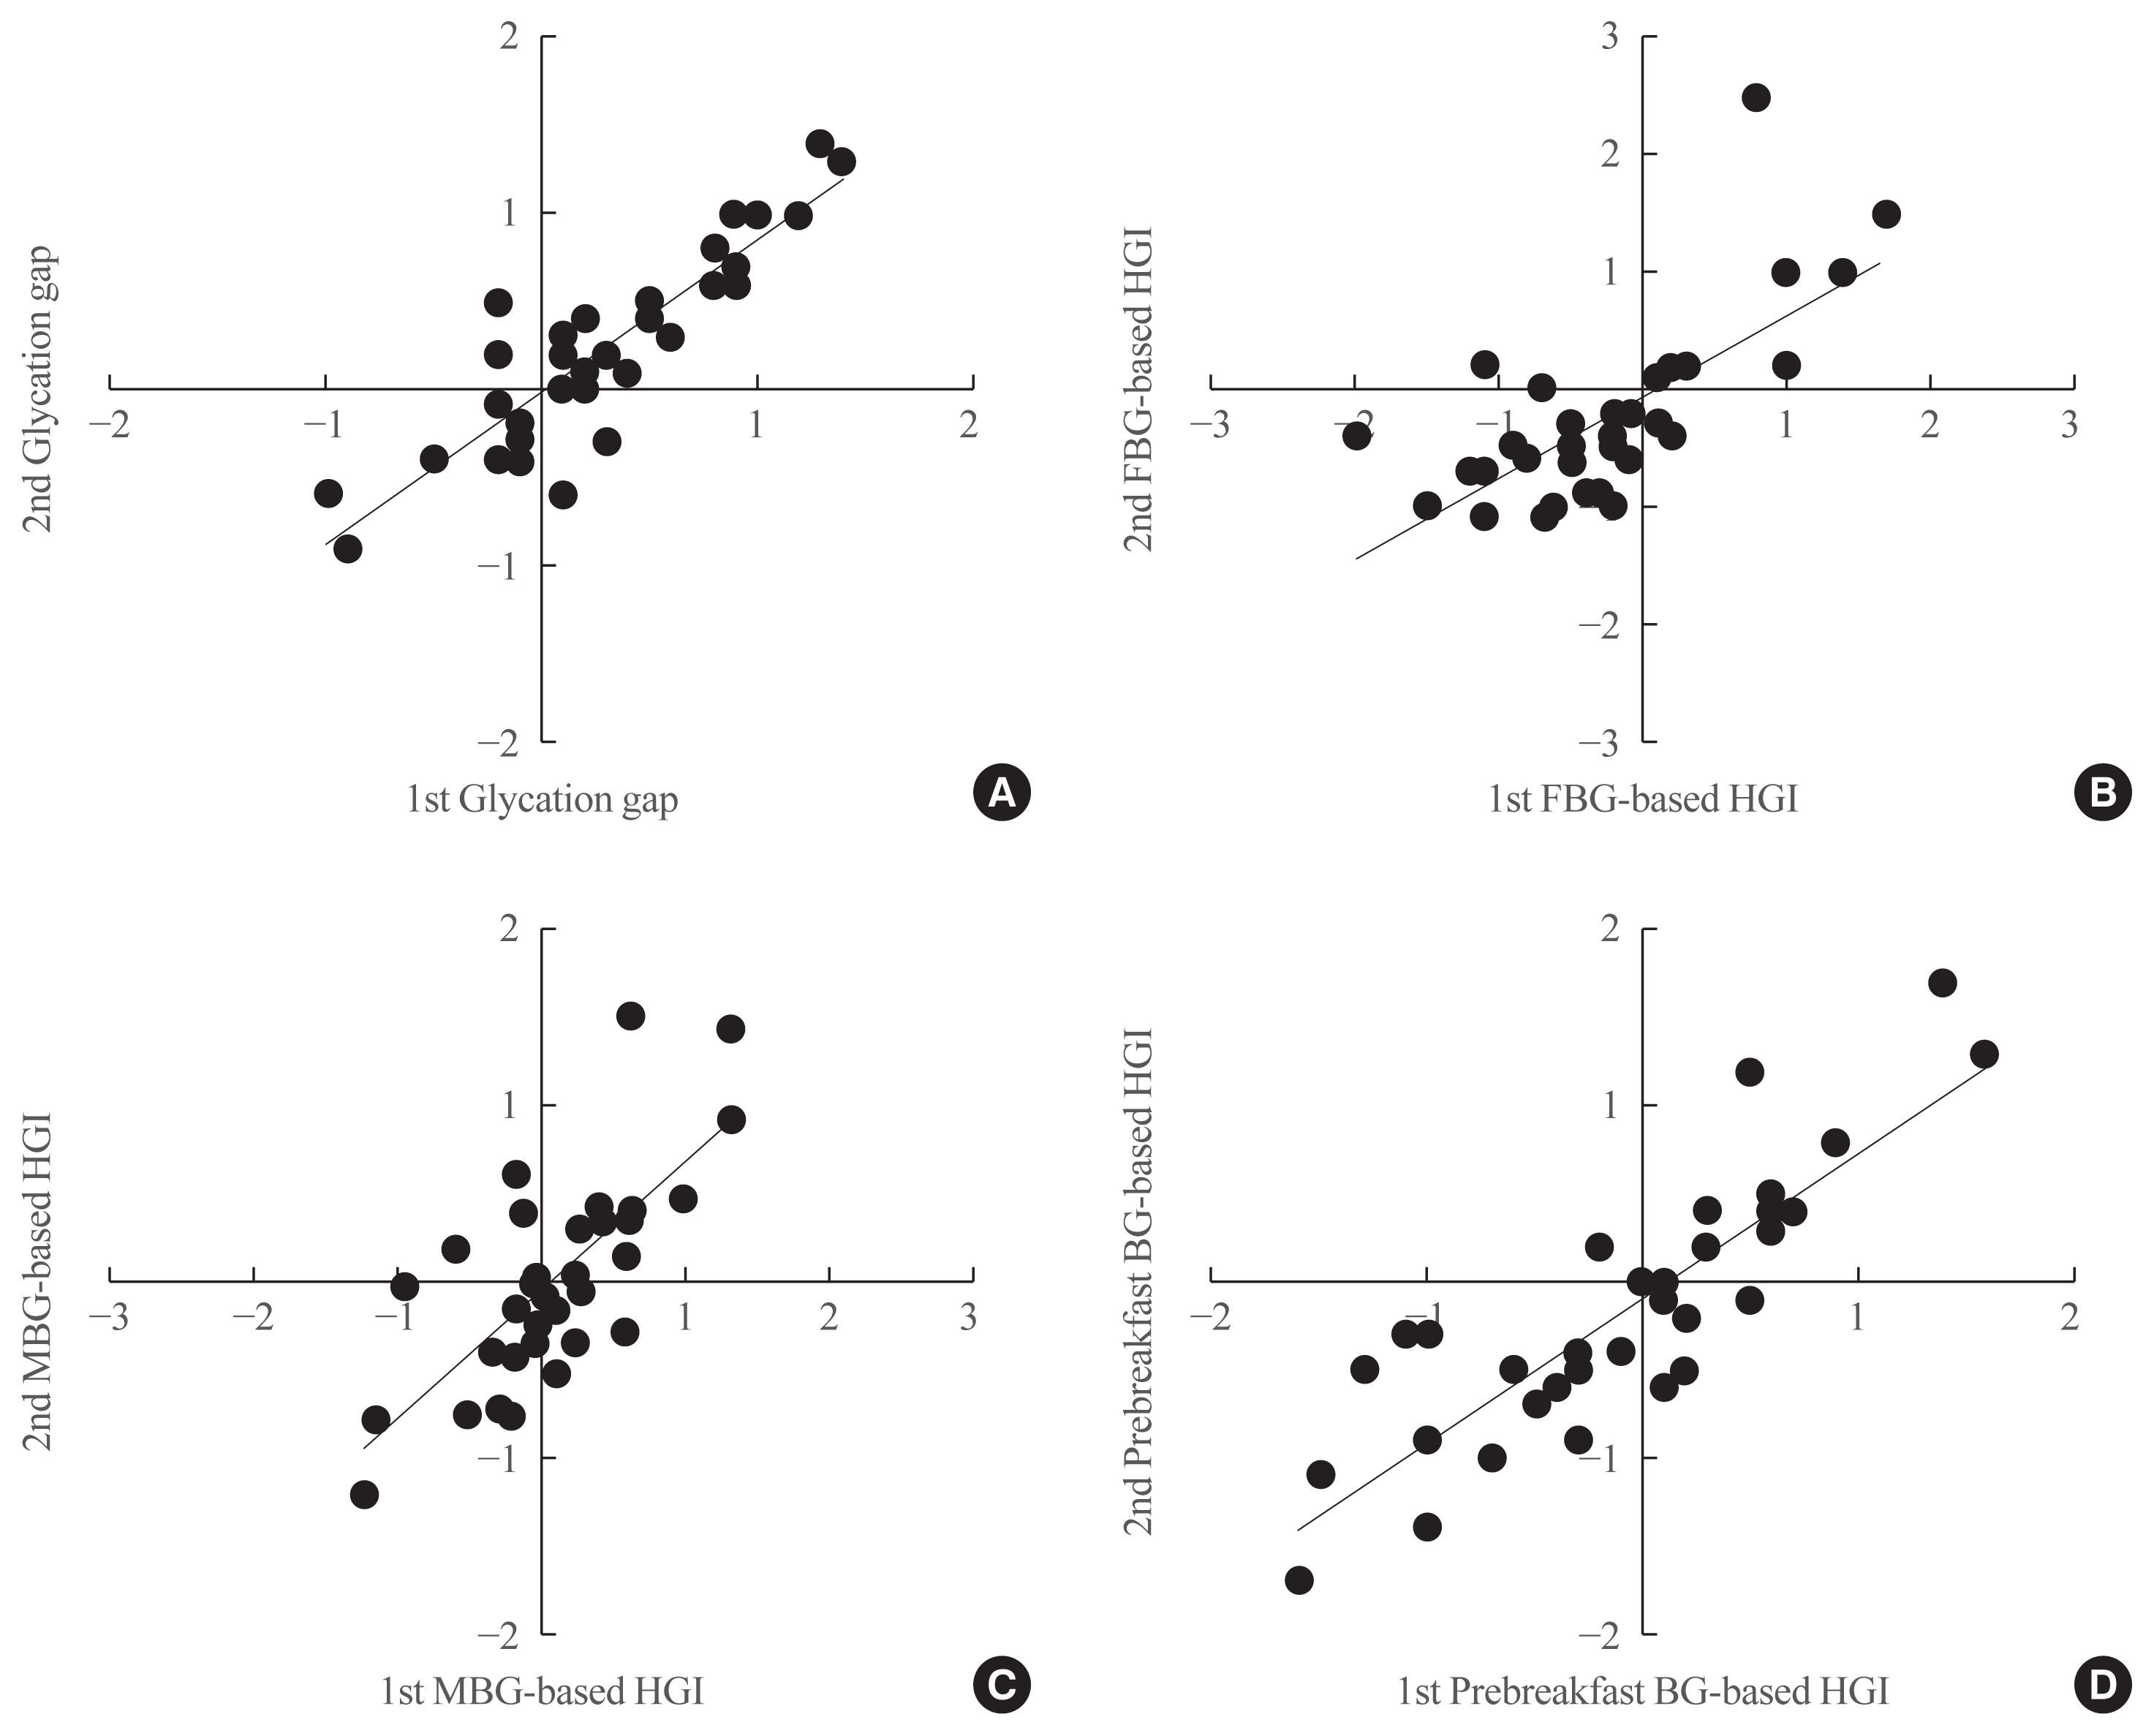
Fig. 1
Correlations between parameters at baseline (first visit) and 1 month later (second visit). (A) Glycation gap at the first visit on the x-axis, against the glycation gap at the second visit on the y-axis (r=0.888, P<0.001). (B) Fasting blood glucose (FBG)-based hemoglobin glycation index (HGI) at the first visit on x-axis, against the FBG-based HGI at the second visit on the y-axis (r=0.691, P<0.001). (C) Mean blood glucose (MBG)-based HGI at the first visit on the x-axis, against the MBG-based HGI at the second visit on the y-axis (r=0.729, P<0.001). (D) Prebreakfast glucose-based HGI at the first visit on the x-axis, against the prebreakfast glucose-based HGI at the second visit on the y-axis (r=0.843, P<0.001). BG, blood glucose.
![]()
A strong correlation was observed between the MBG-based HGI and the prebreakfast glucose-based HGI (r=0.867, P<0.001). Moreover, the MBG-based HGI was correlated with the glycation gap (r=0.810, P<0.001) and the FBG-based HGI (r=0.687, P<0.001) (Table 3).
DISCUSSION
The present study showed that the HGI and glycation gap were highly reproducible and the magnitudes of the repeated determinations were closely correlated. In previous studies, the HGI was calculated as the difference between measured and FBG-based predicted HbA1c levels [3–7]. Other investigators have hypothesized that biological variation in HGI might be an analytical artifact caused by person-to-person variation in postprandial glucose excursions that are not detected when FBG is used to calculate the HGI [8]. We performed 72-hour CGM at baseline and after 1 month and found that the sign and magnitude of the first and second MBG-based HGI measurements were closely correlated. Moreover, the FBG-based and MBG-based HGI measurements were positively correlated. Even in patients with similar MBG levels, there may be a significant difference in HbA1c levels. These observations suggest that variation in postprandial glucose levels is not a significant source of population variation in HGI. This is the first study to calculate the HGI using MBG levels derived from CGM.
Glucose-independent interpersonal variations in HbA1c levels relative to glucose levels have long been recognized. Among the participants in the Diabetes Control and Complication Trial, HbA1c showed substantial differences relative to the glucose levels that were measured by self-monitoring of blood glucose [13]. False-positive and -negative diagnoses based on HbA1c screening relative to the oral glucose tolerance test may be attributable to the contributions of high and low HGI values, respectively [14]. Discordances between HbA1c and glucose levels have clinical implications for T2DM management. When HbA1c levels are spuriously high relative to glucose levels, individuals will be at increased risk for hypoglycemia, because a high HbA1c can prompt treatment intensification. However, individuals with a low HbA1c relative to glucose levels may have a delayed diagnosis of T2DM and may not receive intense enough treatment to adequately reduce their risks for T2DM complications. In most individuals, the diagnosis and management of T2DM should be based on measurements of glucose levels, in addition to HbA1c [1].
If an individual has a measured HbA1c that is higher than expected from MBG levels (i.e., a high HGI), higher measured HbA1c levels than would be expected from MBG levels is likely to continue during repeated comparisons over time. Such individuals likely have a relatively long red blood cell (RBC) life span (i.e., a slow RBC turnover rate), a relatively high RBC glycation rate, or a variation in another yet undefined biological or genetic factor [15,16]. Genetic variations could influence HbA1c levels through nonglycemic pathways and contribute to HbA1c/glycemia discordance. A previous study confirmed that the glycation gap may be partly genetically determined, accounting for one-third of the heritability of HbA1c levels [9]. Another study reported racial differences in the relationship between HbA1c levels and glycemia, confirming that HbA1c levels overestimated in black people relative to white people [17]. Factors that affect RBC survival or those that regulate intracellular glucose concentrations, such as glucose permeability across the RBC membrane, have been shown to contribute to the extent of hemoglobin glycation [2,18].
Most previous studies calculated the HGI as the difference between the measured value of HbA1c and the HbA1c level predicted on the basis of FBG values [3–7]. Concerns have been raised that a high HGI could be attributed to hyperglycemia at times that cannot be captured by FBG levels. In our study, the HGI calculated using MBG levels was found to be consistent in individuals over time, indicating a constant variation in intracellular glycation compared with extracellular glycation or glycemia as measured by MBG levels. A potential mechanism for variation in glycation may be a fructosamine-3-kinase (FN3K)-related glycation/deglycation shift through the deglycation of intracellular proteins, such as hemoglobin. FN3K is highly expressed in erythrocytes with a documented role in HbA1c variation independent of glucose levels [16]. It was reported that FN3K enzyme activity and protein levels were both significantly higher in patients with a negative glycation gap (lower HbA1c levels than would be expected from average glycemia) [16]. The HGI calculated using MBG levels was strongly correlated with the HGI calculated using only pre-breakfast glucose (r=0.867) or FBG (r=0.687) levels. This suggests that individual differences in the relationship between HbA1c and blood glucose can be assessed using MBG or fasting glucose measurements. Common variations as small as 1% in HbA1c from MBG levels or FBG-predicted HbA1c can result in significant clinical errors. Therefore, clinicians should consider using an alternative index of glycemic control, such as blood glucose, GA, fructosamine, or CGM. Both approaches serve to avoid potentially inappropriate treatment intensification, thereby minimizing the risk of hypoglycemia.
We have previously reported that the glycation gap and FBG-based HGI were mostly consistent [3]. In this study, we also found that the glycation gap and MBG-based HGI were highly correlated in patients with T2DM. The discrepancy between HbA1c levels and other measures of glycemia, as calculated by the glycation gap or HGI, respectively, can be substantial in magnitude and is consistent over time [1]. Determining the glycation gap or HGI has the additional benefit of providing a prognostic indicator of patients’ risk of diabetic complications. A high HGI was independently associated with cardiovascular disease in patients with T2DM [5]. Moreover, a higher HGI in people without diabetes has been associated with increased coronary artery calcification [6], carotid atherosclerosis [19], insulin resistance [19], hepatic steatosis [20], and inflammation [21].
Our study was limited by the small number of patients. Future studies with larger patient populations will be required to confirm our findings. We performed 72-hour CGM at baseline and after 1 month. Frequent CGM can be burdensome for patients with T2DM due to the need for constant calibration and skin irritation. Second, there was a lack of data on factors that could explain the HGI or glycation gap. Third, although we did not change the medications of the study population during this study, HbA1c and GA values decreased after 1 month. Since this study was not conducted with real-time CGM devices, CGM provided glucose profiles retrospectively. During CGM use, the patients were instructed to obtain a minimum of three or four self-monitored blood glucose measurements per day. Frequent glucose measurements may be associated with improvements of glucose control, which in turn could affect HGI and glycation gap calculations. Nevertheless, the consistency and reproducibility of the HGI and glycation gap were maintained.
Our study had some strengths when compared with previous studies. First, we used CGM data to calculate the HGI. Compared with serial blood glucose measurements, CGM can provide more data and allows a more comprehensive glycemic assessment. Second, to overcome differences in the time frame of glycemic markers, we measured HbA1c and GA simultaneously at 1-month intervals, rather than at 3-month intervals. Our study only examined outpatients with stable glycemic control. In a previous study [11], we examined inpatients with poor glycemic control at admission and found large differences in HbA1c values between the first and second visits. Therefore, the glycation gap does not mean a difference in the time frame of glycemic markers.
In conclusion, the HGI, which indicates whether measured HbA1c levels are low, similar, or high relative to MBG levels, remained relatively stable in individuals over time. Patients with similar MBG levels may have significant differences in HbA1c levels due to interindividual variations in glucose metabolism and the hemoglobin glycation rate.
 XML Download