Journal List > Endocrinol Metab > v.35(2) > 1144631

Shin, Moon, Chin, Ferrannini, and Lim: Glycemic Efficacy and Metabolic Consequences of an Empagliflozin Add-on versus Conventional Dose-Increasing Strategy in Patients with Type 2 Diabetes Inadequately Controlled by Metformin and Sulfonylurea

Abstract

Background

We assessed the glucose-lowering efficacy of adding empagliflozin versus dose escalating existing medications in patients with uncontrolled type 2 diabetes (T2D).

Methods

This was a 6-month retrospective case-control study in subjects with uncontrolled T2D (glycated hemoglobin [HbA1c] >7%) on conventional treatment. The study group started add-on therapy with empagliflozin (10 mg once a day) while the control group was up-titrated with existing medication, using either monotherapy or a combination of metformin, sulfonylurea, and a dipeptidyl peptidase-4 inhibitor. The primary endpoints included changes in HbA1c, fasting plasma glucose (FPG), and 2-hour postprandial glucose (PP2) levels. Secondary outcomes included changes in body composition, body mass index (BMI), and serum ketone bodies, and urinary excretion of sodium, potassium, chlorine, calcium, phosphorus, and glucose.

Results

After treatment, the reduction in HbA1c was significantly greater in the empagliflozin group than in controls (from 8.6%±1.6% to 7.6%±1.5% vs. 8.5%±1.1% to 8.1%±1.1%; P<0.01). Similar patterns were found in FPG and PP2 levels. Empagliflozin decreased systolic and diastolic blood pressure, triglycerides, and alanine and aspartate aminotransferase levels. Body weight, BMI, waist circumference, fat mass, and abdominal visceral fat area decreased significantly while lean body mass was maintained. Total ketones, β-hydroxybutyrate, and acetoacetate levels increased significantly after empagliflozin.

Conclusion

In addition to glucose lowering, an empagliflozin add-on regimen decreased blood pressure and body fat, and improved metabolic profiles significantly. Empagliflozin add-on is superior to dose escalation in patients with T2D who have inadequate glycemic control on standard medications.

INTRODUCTION

Type 2 diabetes (T2D) is a progressive metabolic disorder characterized by sustained hyperglycemia for which treatment usually requires combination therapy or dose intensification [1]. The American Diabetes Association’s standards of medical care in patients with T2D recommend metformin as the first-line treatment. When the glycemic target is not achieved after 12 to 24 weeks treatment with metformin, dose intensification or drug combination with other agents is usually initiated, depending on a variety of patient- and disease-specific preferences [2]. Previously, sulfonylurea was the most widely used second-line drug, but these days dipeptidyl peptidase-4 (DPP4) inhibitors have been prescribed substantially as second-line therapies in many countries. However, the achievement of glycemic target goal rates has not improved much.
The sodium-glucose cotransporter-2 (SGLT2) inhibitor, empagliflozin, is a recent antihyperglycemic agent that increases the urinary excretion of glucose, promoting glycemic control and weight loss without inducing hypoglycemia [3]. The EMPA-REG H2H SU trial proved that empagliflozin added to metformin therapy provided a sustained reduction in glycated hemoglobin (HbA1c) levels, superior to a glimepiride add-on regimen as it also reduced weight and blood pressure and risk of hypoglycemia [4]. Therefore, empagliflozin demonstrated a better efficacy and safety profile than sulfonylurea for patients with T2D with inadequate glycemic control on metformin. Empagliflozin is an add-on to the combination of widely used oral antihyperglycemic agents, including metformin, sulfonylurea, and DPP4 inhibitors, although this has not been evaluated fully. Moreover, a head-to-head comparison between SGLT2 inhibitor-adding therapy and dose escalation of standard medications needs to be verified in terms of efficacy and safety.
Therefore, the purpose of this study was to compare the efficacy, safety, and changes in body composition and metabolic consequences induced by empagliflozin add-on therapy in patients with T2D who were treated with monotherapy or a combination of medications, including metformin, sulfonylurea, and a DPP4 inhibitor, with dose escalation of these medications.
For this purpose, we investigated not only glucose homeostasis parameters but also ketone bodies, urinary excretion of glucose, sodium (Na), potassium (K), chlorine (Cl), calcium (Ca), and phosphorus (P). We also measured body composition, including whole body fat and muscle mass and water content at baseline and after a 6-month treatment.

METHODS

Study subjects

Study subjects were Korean patients with T2D in Seoul National University Bundang Hospital (SNUBH) aged 20 to 79 years with HbA1c >7.0% despite treatment with unchanged doses of metformin, sulfonylurea (glimepiride), and/or a DPP4 inhibitor for more than 12 weeks prior to enrolment. Patients with body mass index (BMI) ≥20 kg/m2 were eligible to participate. The exclusion criteria included patients with type 1 diabetes, using insulin, with an estimated glomerular filtration rate (eGFR, using the Epidemiology Collaboration formula) of <45 mL/min/1.73 m2, or with secondary diabetes caused by Cushing syndrome or acromegaly.

Study design

This was a 6-month retrospective case-control study in subjects with uncontrolled T2D on conventional treatment. In this study, we selected 240 subjects with T2D with HbA1c >7.0% using antidiabetic medications, either monotherapy or a combination of metformin, glimepiride, and a DPP4 inhibitor for 6 months, from 2015 to 2017. Among them, we selected two groups matched by age (±3 years), BMI (±2 kg/m2), family history of diabetes, duration of diabetes, and current use of antidiabetic medications. The first group comprised subjects who had additional empagliflozin (10 mg once a day; hitherto described as the empagliflozin group) and the second group comprised subjects in whom metformin or glimepiride or both were up-titrated (control group). The use of DPP4 inhibitors was maintained in all cases. Up-titration of medications was decided at each clinician’s discretion. Of the 240 patients with T2D screened, 120 were eligible to enroll; each group comprised 60 subjects. The primary and secondary endpoints were assessed at 6 months.
The protocol was approved by an independent Ethics Committee/Institutional Review Board (SNUBH: B-2007-622-101). Written informed consent by the patients was waived due to a retrospective nature of our study. This study was carried out in compliance with the protocol and principles of the Declaration of Helsinki, and in accordance with the International Conference on Harmonization Harmonized Tripartite Guideline for Good Clinical Practice.

Measurements

Clinical parameters, including blood pressure, body weight, BMI, waist circumference (WC), and blood pressure, were measured using standard methods. Systolic and diastolic blood pressures (SBP and DBP, respectively) were measured with subjects in a seated position using an electronic blood pressure meter (UA-1020 device, A&D Co., Tokyo, Japan). Blood pressure was measured twice 5 minutes apart and the mean value was used in the analysis. The BMI was calculated by dividing the subject’s weight (kg) by height squared (m2). WC was measured at the midline between the lowest rib margin and the iliac crest using a measuring tape.
Blood sampling was carried out after a 10-hour overnight fast. The samples were centrifuged immediately at 3,000 rpm for 10 minutes at 4°C. HbA1c was measured using a Bio-Rad Variant II Turbo HPLC analyzer (Bio-Rad, Hercules, CA, USA) in SNUBH, the National Glycohemoglobin Standardization Program level II certified laboratory. Fasting plasma glucose (FPG) and 2-hour postprandial glucose (PP2) concentrations were analysed using the hexokinase method. Plasma concentrations of insulin and C-peptide were measured by radioimmunoassay (Linco, St. Louis, MO, USA). The homeostatic model assessment of insulin resistance (HOMA-IR) was calculated [5]. Triglyceride levels were measured by the glycerol-3-phosphate oxidase peroxide method, and high-density lipoprotein cholesterol (HDL-C) and low-density lipoprotein cholesterol (LDL-C) were measured by homogeneous enzymatic assays. Alanine and aspartate aminotransferase (ALT and AST, respectively) levels were measured using the nicotinamide adenine enzyme-ultraviolet (NADH-UV) method, and serum creatinine (Cr) was measured by Jaffe’s kinetic method using a Hitachi 747 chemistry analyzer (Hitachi, Tokyo, Japan). Free fatty acids (FFAs) were measured using the Acyl-CoA synthetase (ACS)-Acyl-CoA oxidase (ACOD) method (modular P, Hitachi). Plasma glucagon concentrations were determined using a validated enzyme-linked immunosorbent assay (Mercodia AB, Uppsala, Sweden). Serum concentrations of total ketones, β-hydroxybutyrate, and acetoacetate were measured using enzymatic immunoassay kits (Nittobo Medical Co. Ltd., Tokyo, Japan). Using spot urine samples, urinary excretions of Na, K, Cl, Ca, P, and Cr were measured. Urinary levels of these parameters were adjusted for urinary Cr concentrations by calculating the respective ratios. Fractional excretion (FE) rates of glucose, Na, K, Cl, Ca, and P were calculated by the following formula: urine metabolite x serum Cr/serum metabolite x urine Cr. Urinary analysis was also conducted using microscopy to identify any pyuria, hematuria, or urinary infections.
Body composition, including total body water, lean body mass, fat mass, and fat percent, was assessed using bioelectrical impedance analysis (BIA; InBody770, InBody, Seoul, Korea). Abdominal visceral fat area (VFA) was also obtained from this BIA method, which was validated in a previous study in 1,006 subjects [6].

Efficacy and safety assessment

The primary endpoint was the change in the HbA1c concentration from baseline. Secondary outcomes included changes in FPG and PP2, changes in ketone body levels, including total ketone, β-hydroxybutyrate, and acetoacetate, and changes in body composition, including whole body fat and muscle and water content. Liver and renal function markers were also assessed. Safety assessments included adverse events, such as urinary tract infection, genital infection, ketoacidosis, and hypoglycemia. Documentation of hypoglycemic episodes was defined based on patient symptoms and a self-monitored plasma glucose level <70 mg/dL.

Statistical analysis

Clinical and biochemical parameters, body composition, and ketone body measurements were compared using Student’s t tests for continuous variables and chi-square tests for categorical variables. All of the statistical analyses were performed using IBM SPSS Statistics for Windows version 20 (IBM Corp., Armonk, NY, USA).

RESULTS

Patients

As shown in Table 1, the demographic and metabolic characteristics of the two groups were well matched as were the proportions of patients on monotherapy, dual or triple therapy. The baseline metformin dose was 1,322±443 mg/day in the control group and 1,421±436 mg/day in the empagliflozin group (P= 0.235). Over 6 months, in the dose escalation group the metformin dose was escalated by 603±239 mg/day (605±229 mg/day in the metformin only subgroup and 596±274 mg/day in the metformin plus sulfonylurea subgroup) and the sulfonylurea (glime-piride) dose was raised by 2.4±0.9 mg/day (2.5±1.0 mg/day in the sulfonylurea only subgroup and 2.1±0.7 mg/day in the metformin plus sulfonylurea subgroup). There were no dose changes for pre-existing antidiabetic medications in the empagliflozin group.

Effects on HbA1c and glucose homeostasis

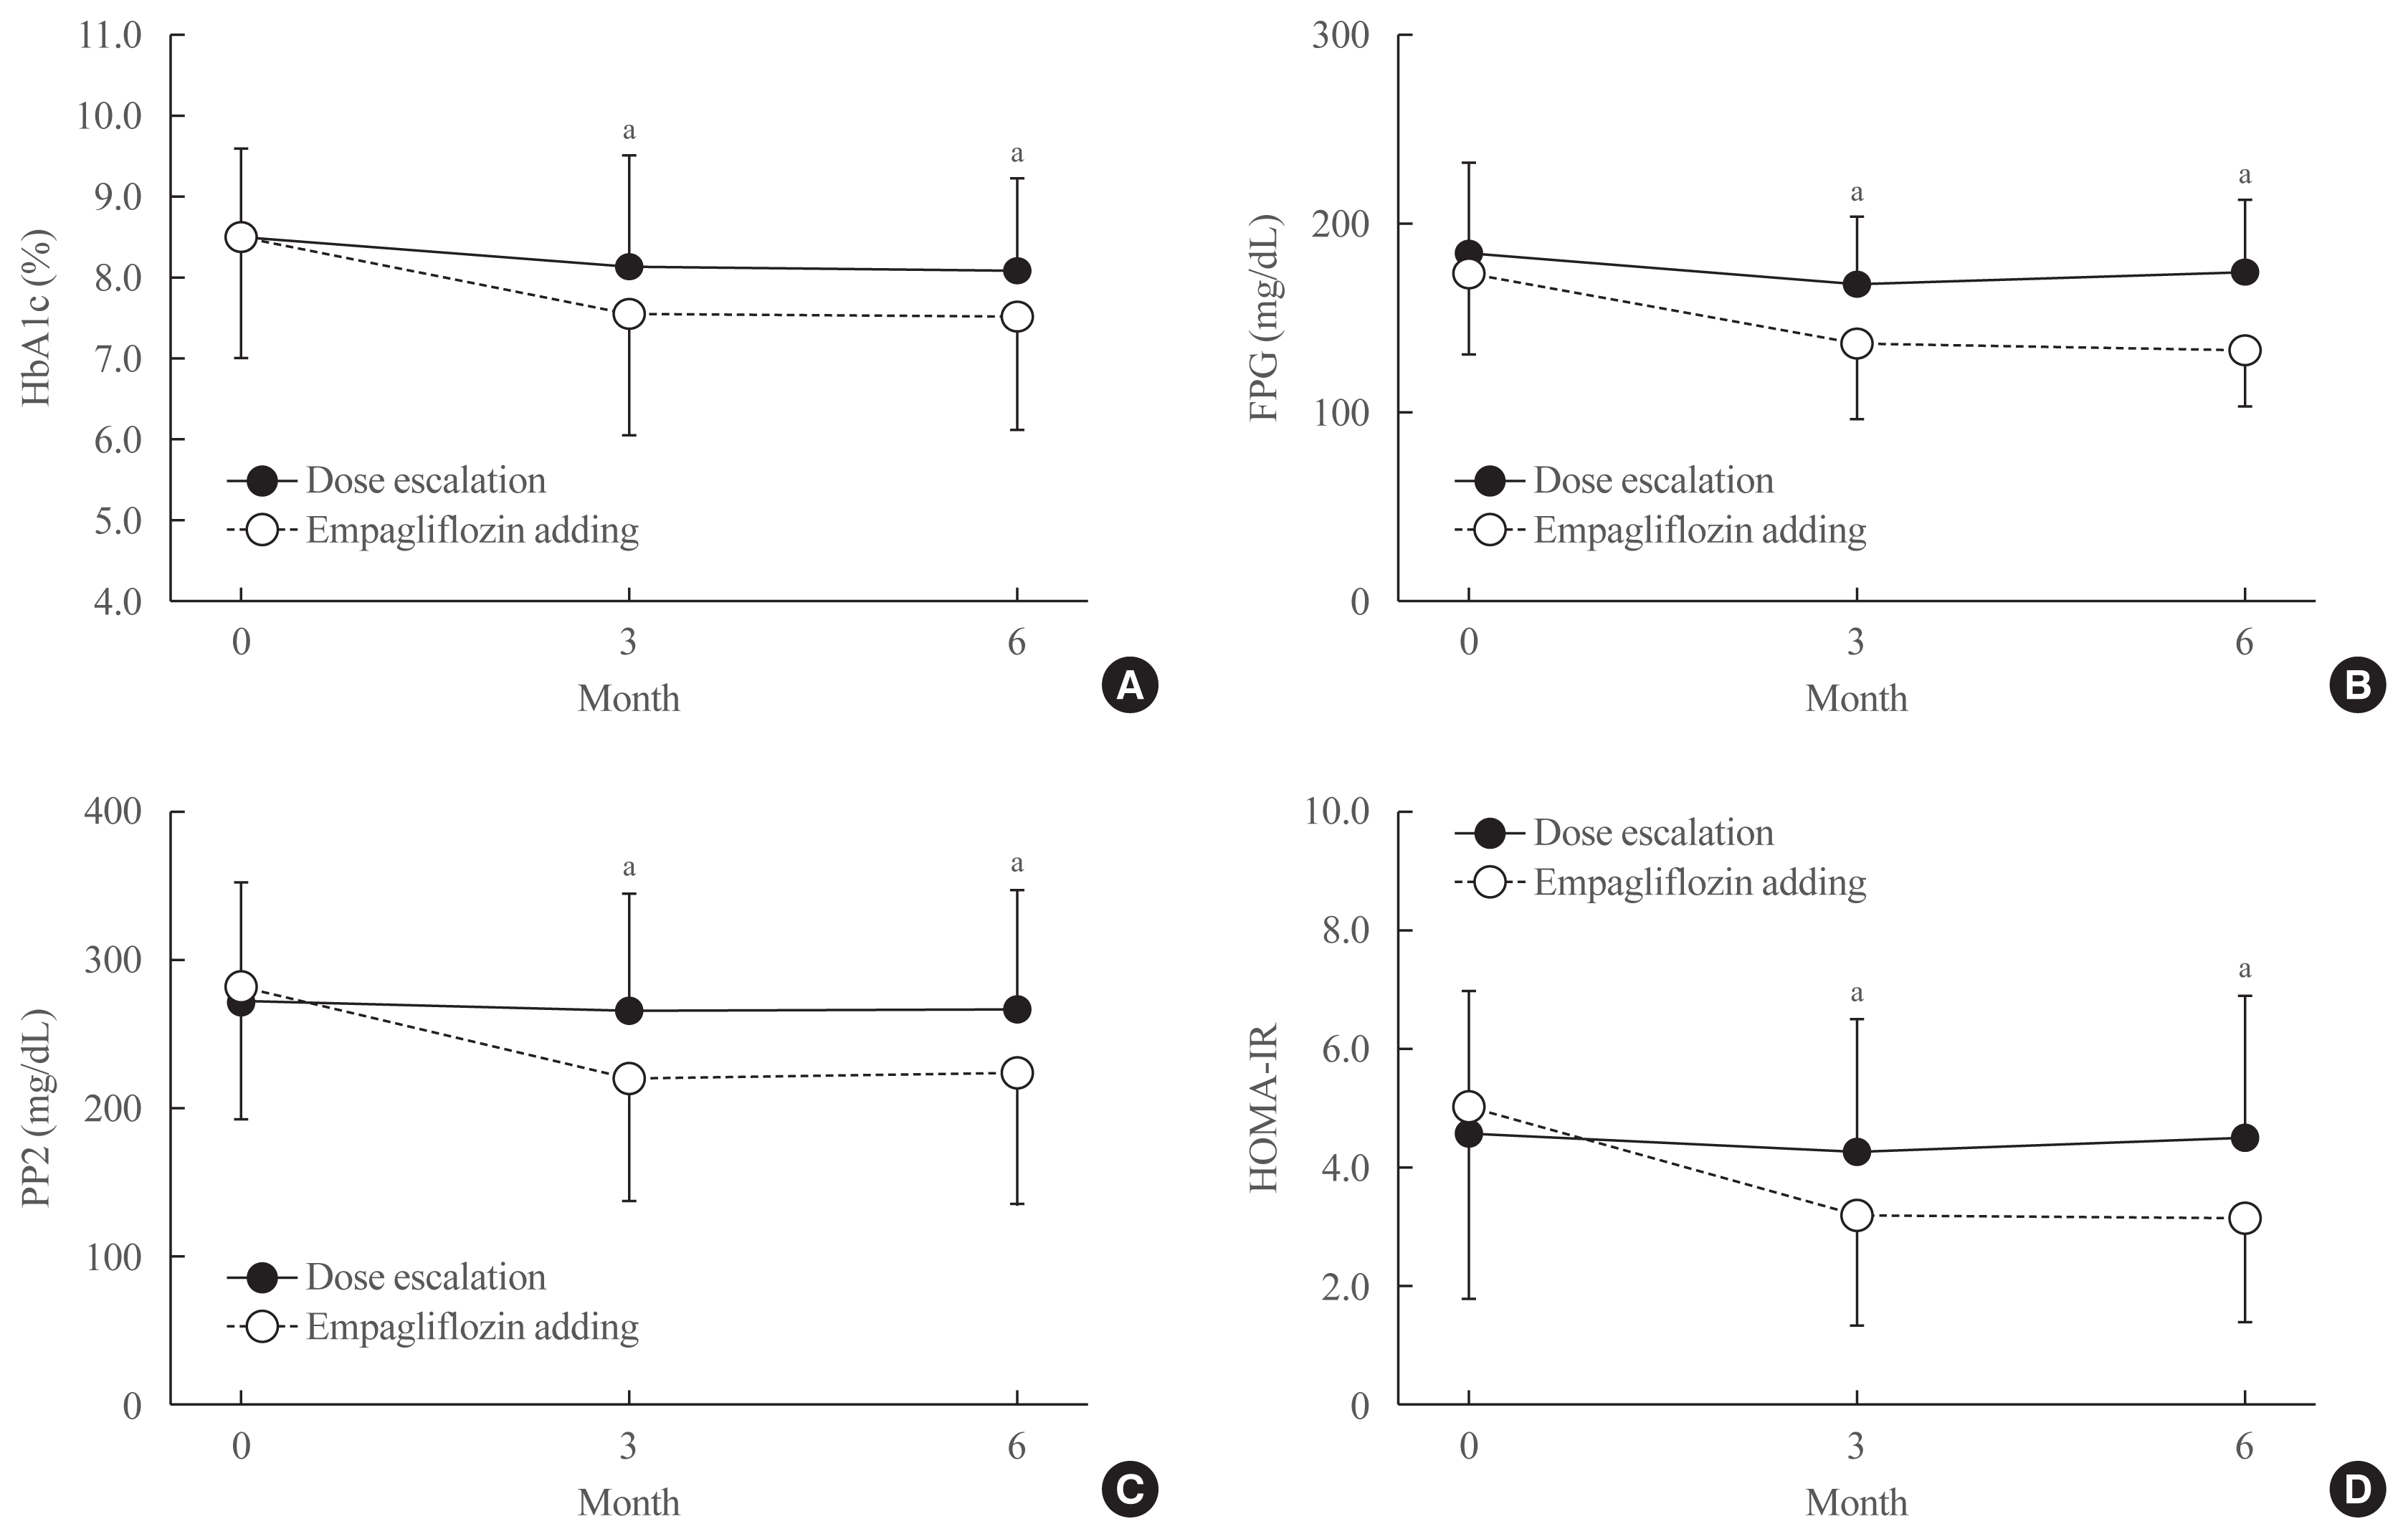
HbA1c levels decreased significantly in both groups after 6 months: from 8.5%±1.1% to 8.1%±1.1% in the control group; and from 8.6%±1.6% to 7.6%±1.5% in the empagliflozin group (P=0.003 for the difference in the respective changes from baseline) (Table 2). Similarly, FPG and PP2 decreased in both groups but the extent of decrease was greater in the empagliflozin group than in the control group (both P values for change <0.01) (Fig. 1). Serum insulin and C-peptide levels decreased, and serum glucagon level increased in the empagliflozin group while there were no changes in these parameters in the control group (Table 2).
Among the control group, there were 29 (48%) in the metformin only subgroup, 20 (33%) in the sulfonylurea only subgroup, and 11 (18%) in the metformin plus sulfonylurea subgroup. In further analyses across these up-titrated subgroups, HbA1c levels decreased by 0.15%±0.92% (from 8.1%±1.0% to 8.0%±0.9%; P>0.05) in the metformin only group, by 0.62%±1.09% (from 9.1%±1.2% to 8.5%±1.4%; P<0.05) in the sulfonylurea only group, and by 0.56%±1.02% (from 8.4%±1.2% to 7.8%±1.2%; P>0.05) in the metformin plus sulfonylurea group after 6 months. Thus, the HbA1c level decreased the most in the sulfonylurea only subgroup, followed by the metformin plus sulfonylurea subgroup, and the least in the metformin only subgroup (0.62%±1.09% vs. 0.56%±1.02% vs. 0.15%±0.92%, respectively; P=0.235). With regard to indices of hepatic insulin resistance, HOMA-IR decreased significantly in the empagliflozin group, but not in the control group (Fig. 1).
Next, we compared glucose-lowering efficacy between the empagliflozin and the sulfonylurea-only groups, which showed the greatest HbA1c reduction among the three control subgroups. Similar patterns were observed, and the empagliflozin add-on therapy demonstrated superior efficacy compared with the sulfonylurea dose-increasing strategy with borderline significance (Supplemental Table S1).

Effects on blood pressure and body composition

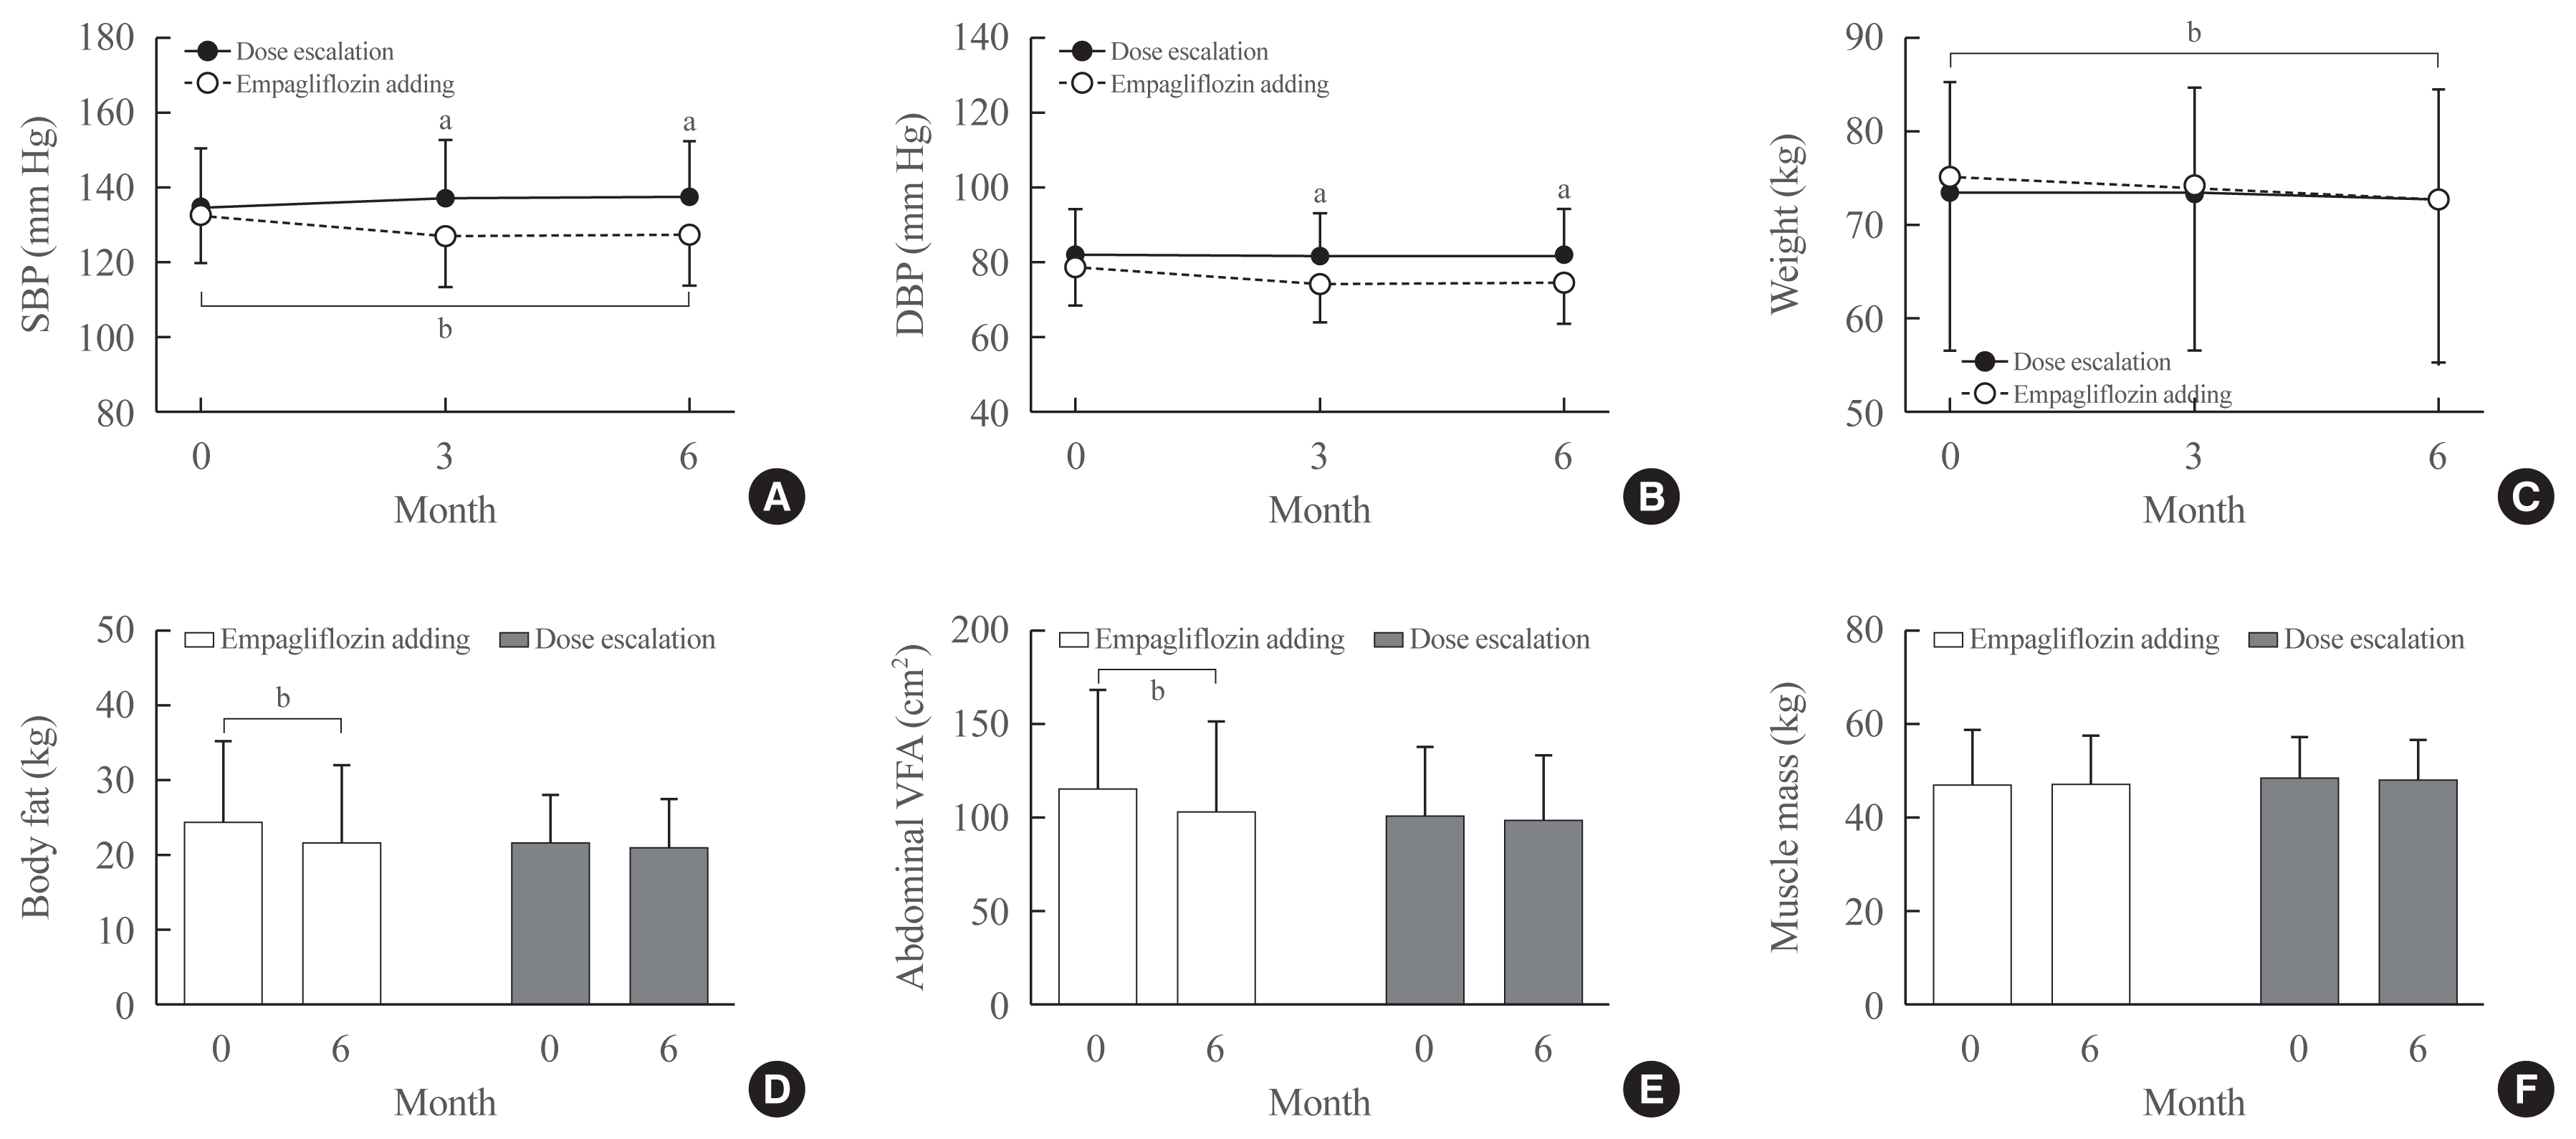
After 6 months of treatment, SBP decreased in the empagliflozin group but it increased in the control group. DBP also decreased in the empagliflozin group but it did not change in the control group (Table 2, Fig. 2). Body weight decreased by 2.5 kg, BMI decreased by 1 kg/m2, and WC decreased by 1.8 cm in the empagliflozin group (all P<0.05), whereas these measures did not change in the control group. There were significant reductions in whole body fat mass and abdominal VFA in the empagliflozin group, but no changes were found in the control group (all P<0.001) (Fig. 2).

Effects on metabolic biomarkers

Total cholesterol and triglycerides decreased significantly in the empagliflozin group but without differences between the two groups (Table 2). In contrast, both AST and ALT levels decreased significantly more in the empagliflozin than the control group. While serum Cr levels and eGFR showed a similar pattern, the empagliflozin group experienced significant reductions in the urine protein/Cr and microalbumin/Cr ratios.

Effects on ketones, glucagon, and FFA

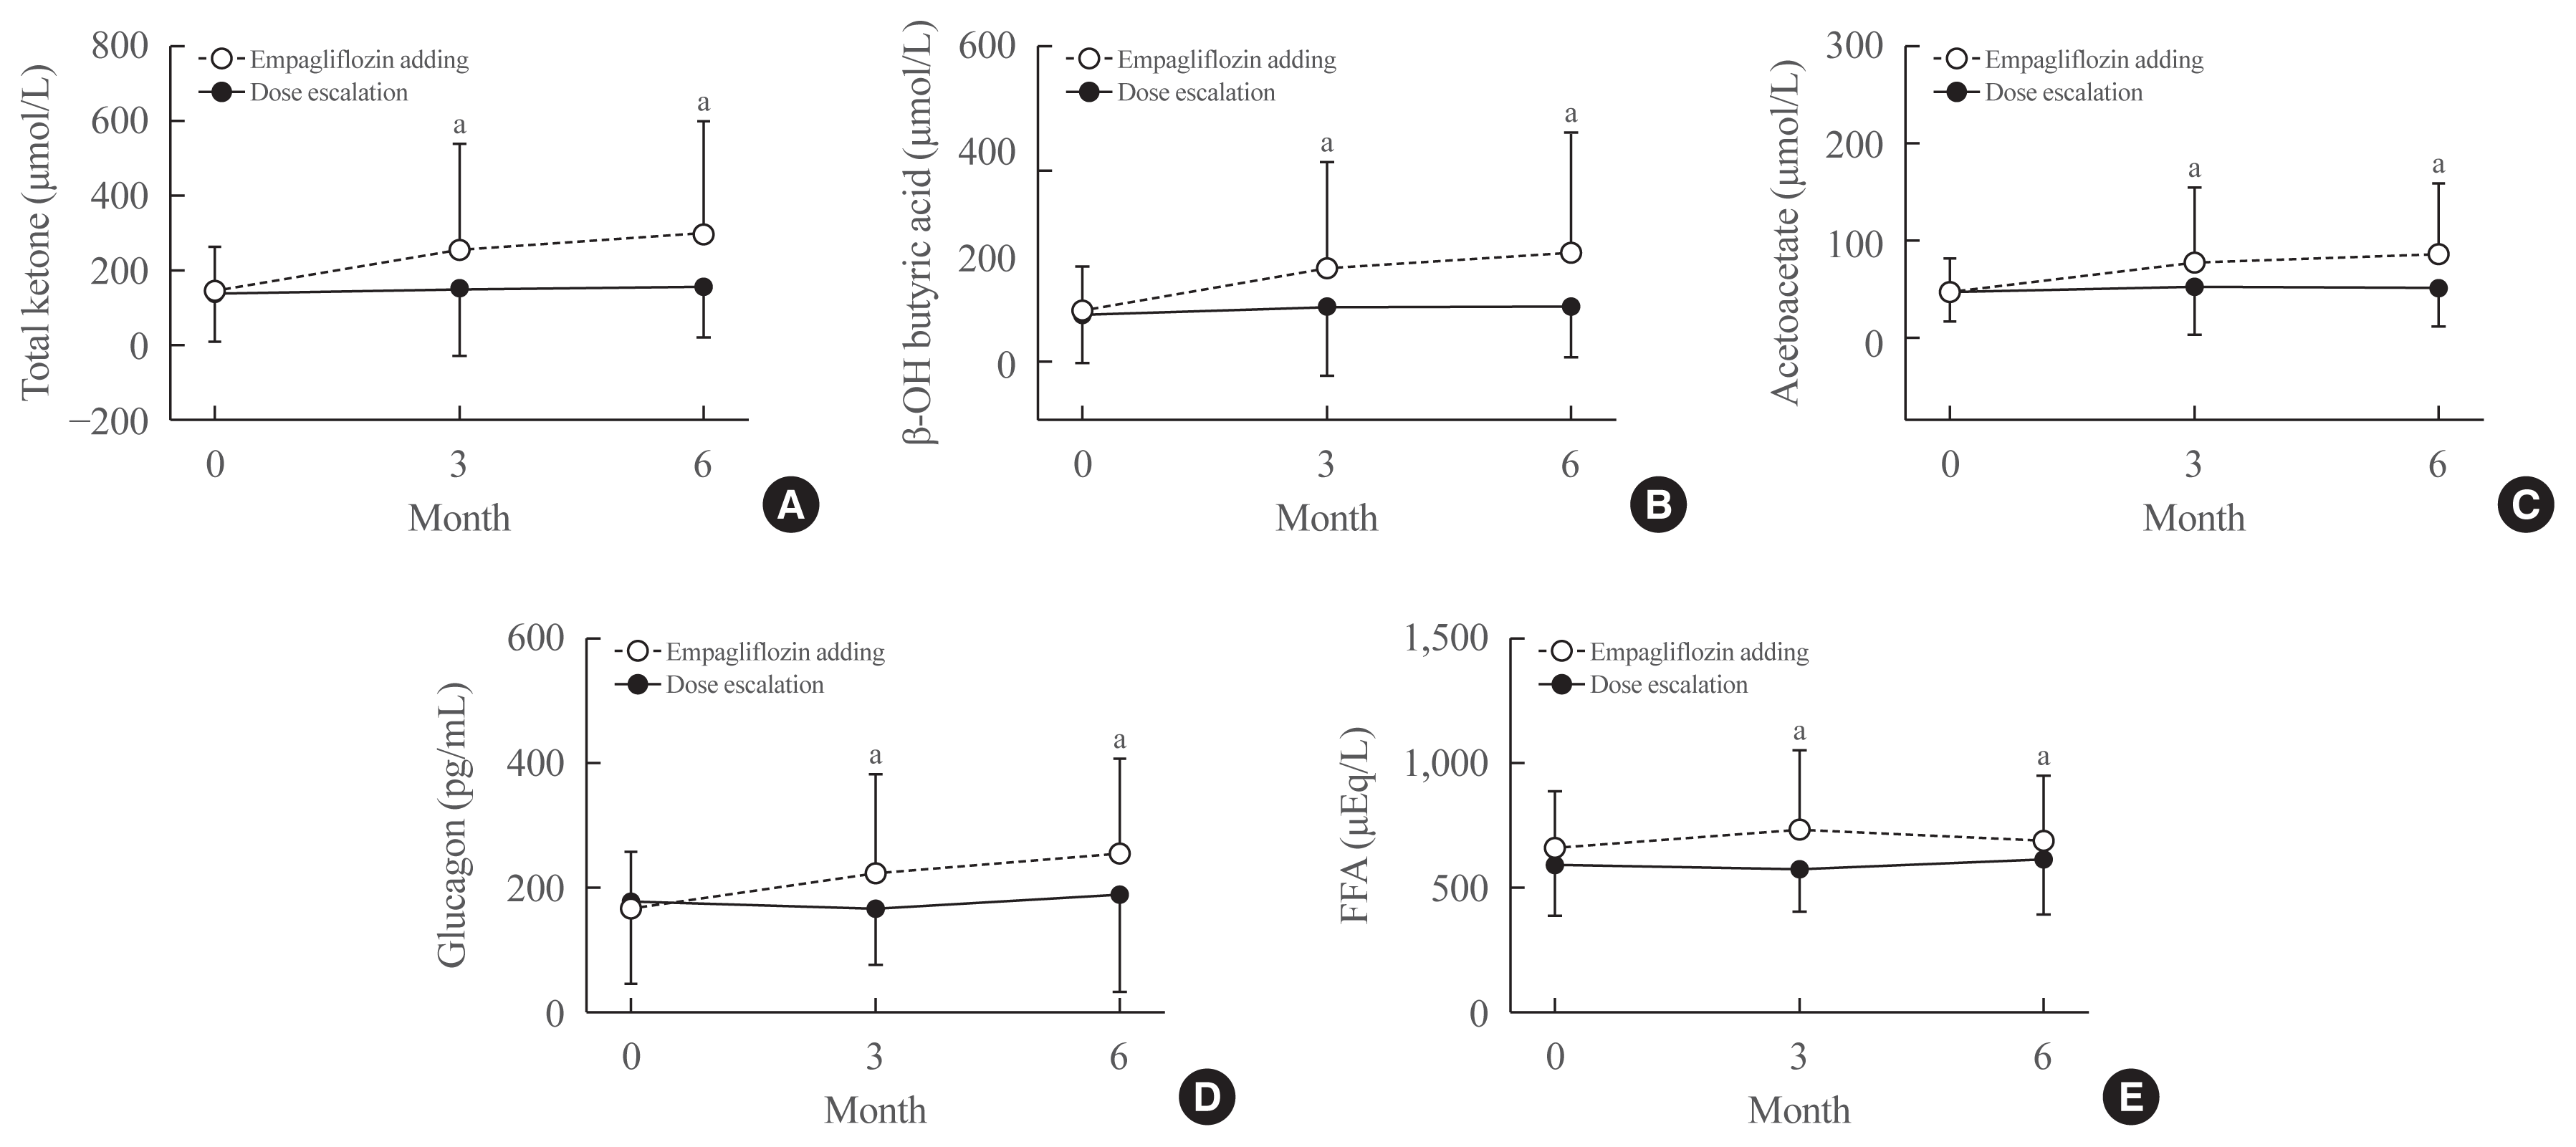
Total ketones, β-hydroxybutyrate, and acetoacetate levels increased significantly after 6 months of treatment in the empagliflozin group, but they did not change in the control group, resulting in significant differences in the degrees of changes between groups (all P<0.01) (Table 2, Fig. 3). Serum glucagon levels increased in the empagliflozin group but there were no changes in the control group. The FFA level also increased in the empagliflozin group but there was no significant difference between the two groups (Fig. 3).

Effects on fractional urinary excretion of glucose and sodium

Fractional urinary excretion of glucose and Na increased after 6 months treatment in the empagliflozin group, whereas these parameters did not change in the control group, leading to significant difference in changes between the two groups. In a correlation analysis between the changes in HbA1c and FE of glucose at 6 months, we found that there was significant negative correlation only in the empagliflozin group, but not in the control group (Supplemental Fig. S1).

Safety

There were no significant safety issues regarding hypoglycemia or hyperglycemic crises in either group. Euglycemic ketoacidosis did not develop in either group, but there was one case of genital infection in the empagliflozin group (Table 3).

DISCUSSION

In this study, addition of empagliflozin to the most commonly used combinations of metformin, sulfonylurea, or a DPP4 inhibitor provided a substantial reduction in HbA1c (1%), FPG (41 mg/dL), and PP2 (62 mg/dL), which was superior to those found in the dose escalation control group. Of note, 48% of the empagliflozin group achieved HbA1c levels <7.0% within 6 months. By contrast, only 27% in the control group achieved HbA1c levels <7.0% with a mean increase of 46% in metformin and 61% in sulfonylurea dosages. These data indicate that add-on therapy with SGLT2 inhibitor was apparently more effective on glycemic control in these patients with T2D than dose increasing in pre-existing metformin or sulfonylurea regimens.
In our study, there were significant decreases in insulin levels and increases in glucagon levels in the empagliflozin group that paralleled elevated concentrations in ketone bodies and favorable change in body composition associated with a reduction in body weight, particularly fat mass. Treatment with SGLT2 inhibitor promotes urinary glucose excretion, thereby decreasing plasma glucose levels [7]. As a result, insulin secretion decreases and glucagon secretion increases, which releases FFA mostly from adipose tissue. Fatty acids are converted to ketones in the liver. SGLT2 inhibitor-induced glycosuria limits the availability of carbohydrates, shifting utilization from glucose to fat oxidation and promotion of hyperglucagonemia, which stimulates ketogenesis [8]. Ketones are known as effective fuels in terms of energy expenditure [9]. These results indicate that SGLT2 inhibitor treatment might accelerate lipolysis from stored body fat.
The antihypertensive effect of empagliflozin in our study is consistent with previous studies [1013]. It is explained by volume contraction via osmotic diuresis, weight loss, and improvement in vascular stiffness and hyperglycemic oxidative stress [14]. The osmotic diuretic and natriuretic effects contribute to the plasma volume contraction that underlies the cardiovascular benefits [1417].
In this study, empagliflozin add-in treatment reduced serum total cholesterol and triglyceride levels while it did not change those of HDL-C or LDL-C. In addition, AST and ALT levels decreased after empagliflozin treatment in our study. Liver enzyme activities were also improved in the Empagliflozin Cardiovascular Outcome Event Trial in Type 2 Diabetes Mellitus Patients–Removing Excess Glucose (EMPA-REG OUTCOME) trial [18]. Thus, SGLT2 inhibitors are believed to attenuate development or progression of non-alcoholic fatty liver disease [19,20]. Because fat accumulation in the liver combined with inflammation is associated with increased risk of cardiovascular diseases [21], improvements in fatty liver disease by SGLT2 inhibitors might also make a contribution to the cardiovascular benefits obtained from those drugs [16].
In the present study, empagliflozin led to a 6-fold increase in the fractional urinary excretion of glucose. Of note, there was a significant negative correlation between the changes in HbA1c and FE of glucose only in the empagliflozin group. This result suggests that glucosuria induced by SGLT2 inhibition contributes to the glucose-lowering efficacy observed in SGLT2 inhibitor treatment.
In this study, empagliflozin induced 20% increase in the fractional Na excretion, coupled with a significant reduction in albuminuria, as shown in other studies [22,23]. In the EMPA-REG OUTCOME trial, an initial decrease in eGFR with empagliflozin was reversed over continued treatment [23], and renal outcomes were markedly improved. These beneficial renal effects have been attributed to a reduction in intraglomerular pressure [15,24,25]. Our study did not show significant changes in eGFR, possibly because of the small sample size, retrospective design, short study duration or different ethnic composition (or combinations thereof).
In a previous study, dapagliflozin treatment for 6 months reduced whole body fat mass by 1.48 kg and WC by 1.52 cm in European patients (baseline BMI, 31.9 kg/m2) with T2D inadequately controlled with metformin [26]. In a previous study with Koreans with T2D, the body weight was decreased significantly by 2.7±2.0 kg after a 12-month treatment with dapagliflozin and metformin with sulfonylurea, or DPP4 inhibitors [27]. In our Korean patients (baseline BMI, 27.4 kg/m2), whole body fat mass decreased by 2.3 kg and WC decreased by 1.8 cm. More importantly, abdominal visceral fat amount decreased significantly by >10%. These data suggest that SGLT2 inhibitor might reduce body fat more effectively in Asian than Western patients.
In this study, empagliflozin was well tolerated when given as add-on therapy to the most commonly used combinations of metformin, sulfonylurea, and DPP4 inhibitors. Euglycemic ketoacidosis or other significant safety issues did not develop.
This study had several limitations. In the control group, pre-existing antidiabetic medications were increased at each physician’s discretion without a fixed protocol; this might have led to submaximal titration in some patients, thereby curbing the corresponding glycemic benefit. However, the mean escalations in doses of metformin and glimepiride were not trivial (46% and 69%, respectively). Even though this was not a well supervised randomized trial, we intended to resolve some of the points that have arisen from real-world clinics. Patients commonly ask how efficient add-on therapy is compared with many different combinations of commonly used oral anti-hyperglycemic agents. As our study reflected the real-world situation, embracing many different drug combinations, our finding is likely to be the answer to patients asking about the efficiency of adding an SGLT2 inhibitor to any combination of the aforementioned drugs regarding glycemic and metabolic profile.
We found that important side effects, such as hypoglycemia and infection, were well described in the electronic medical record (EMR) system. In contrast, given the limitations of the EMR and the retrospective nature of this study, it was possible that mild to moderate side effects were not described thoroughly, but these caveats applied to both groups. Incidentally, we show here that SGLT2 inhibitor-induced natriuresis and glycosuria can be measured easily and related to the observed metabolic changes.
There have been several clinical studies that support the beneficial effects of SGLT2 inhibitors on cardiorenal function and whole-body metabolism [2830]. However, some clinical trial study populations do not mirror those patients treated in routine clinical practice. Real word observational studies may be able to reflect the advantages of using SGLT2 inhibitors when added to other glucose-lowering drugs.
In conclusion, with the benefits of glycemic control and favorable changes in metabolic parameters and body composition, we suggest that adding empagliflozin could be an optimal therapy in patients with T2D who have inadequate glycemic control on standard medications.

Supplementary Information

ACKNOWLEDGMENTS

This research was funded by the Korean Endocrine Society, Korean Diabetes Association, and Seoul National University Bundang Hospital. The funding agency had no role in the study design, data collection and analysis, decision to publish, or preparation of the manuscript.

Notes

CONFLICTS OF INTEREST

No potential conflict of interest relevant to this article was reported.

AUTHOR CONTRIBUTIONS

Conception or design: Y.S., S.L. Acquisition, analysis, or interpretation of data: Y.S., J.H.M., H.J.C., E.F., S.L. Drafting the work or revising: Y.S., H.J.C., E.F., S.L. Final approval of the manuscript: Y.S., J.H.M., H.J.C., E.F., S.L.

REFERENCES

1. Cahn A, Cefalu WT. Clinical considerations for use of initial combination therapy in type 2 diabetes. Diabetes Care. 2016; 39(Suppl 2):S137–45.
crossref
2. American Diabetes Association. 9. Pharmacologic approaches to glycemic treatment: standards of medical care in diabetes-2019. Diabetes Care. 2019; 42:S90–102.
3. Vallon V, Thomson SC. Targeting renal glucose reabsorption to treat hyperglycaemia: the pleiotropic effects of SGLT2 inhibition. Diabetologia. 2017; 60:215–25.
crossref
4. Ridderstrale M, Rosenstock J, Andersen KR, Woerle HJ, Salsali A. EMPA-REG H2H-SU trial investigators. Empagliflozin compared with glimepiride in metformin-treated patients with type 2 diabetes: 208-week data from a masked randomized controlled trial. Diabetes Obes Metab. 2018; 20:2768–77.
crossref
5. Matthews DR, Hosker JP, Rudenski AS, Naylor BA, Treacher DF, Turner RC. Homeostasis model assessment: insulin resistance and beta-cell function from fasting plasma glucose and insulin concentrations in man. Diabetologia. 1985; 28:412–9.
6. Lee DH, Park KS, Ahn S, Ku EJ, Jung KY, Kim YJ, et al. Comparison of abdominal visceral adipose tissue area measured by computed tomography with that estimated by bioelectrical impedance analysis method in Korean subjects. Nutrients. 2015; 7:10513–24.
crossref
7. Daniele G, Xiong J, Solis-Herrera C, Merovci A, Eldor R, Tripathy D, et al. Dapagliflozin enhances fat oxidation and ketone production in patients with type 2 diabetes. Diabetes Care. 2016; 39:2036–41.
crossref
8. Mudaliar S, Alloju S, Henry RR. Can a shift in fuel energetics explain the beneficial cardiorenal outcomes in the EMPA-REG OUTCOME study? A unifying hypothesis. Diabetes Care. 2016; 39:1115–22.
crossref
9. Ferrannini E, Mark M, Mayoux E. CV protection in the EMPA-REG OUTCOME trial: a “thrifty substrate” hypothesis. Diabetes Care. 2016; 39:1108–14.
crossref
10. Weber MA, Mansfield TA, Alessi F, Iqbal N, Parikh S, Ptaszynska A. Effects of dapagliflozin on blood pressure in hypertensive diabetic patients on renin-angiotensin system blockade. Blood Press. 2016; 25:93–103.
crossref
11. Zinman B, Wanner C, Lachin JM, Fitchett D, Bluhmki E, Hantel S, et al. Empagliflozin, cardiovascular outcomes, and mortality in type 2 diabetes. N Engl J Med. 2015; 373:2117–28.
crossref
12. Wiviott SD, Raz I, Bonaca MP, Mosenzon O, Kato ET, Cahn A, et al. Dapagliflozin and cardiovascular outcomes in type 2 diabetes. N Engl J Med. 2019; 380:347–57.
crossref
13. Neal B, Perkovic V, Mahaffey KW, de Zeeuw D, Fulcher G, Erondu N, et al. Canagliflozin and cardiovascular and renal events in type 2 diabetes. N Engl J Med. 2017; 377:644–57.
crossref
14. Muskiet MHA, van Bommel EJ, van Raalte DH. Antihypertensive effects of SGLT2 inhibitors in type 2 diabetes. Lancet Diabetes Endocrinol. 2016; 4:188–9.
crossref
15. Cherney DZ, Perkins BA, Soleymanlou N, Maione M, Lai V, Lee A, et al. Renal hemodynamic effect of sodium-glucose cotransporter 2 inhibition in patients with type 1 diabetes mellitus. Circulation. 2014; 129:587–97.
crossref
16. Lim S, Eckel RH, Koh KK. Clinical implications of current cardiovascular outcome trials with sodium glucose cotransporter-2 (SGLT2) inhibitors. Atherosclerosis. 2018; 272:33–40.
crossref
17. Lee SJ, Lee KH, Oh HG, Seo HJ, Jeong SJ, Kim CH. Effect of sodium-glucose cotransporter-2 inhibitors versus dipeptidyl peptidase 4 inhibitors on cardiovascular function in patients with type 2 diabetes mellitus and coronary artery disease. J Obes Metab Syndr. 2019; 28:254–61.
crossref
18. Sattar N, Fitchett D, Hantel S, George JT, Zinman B. Empagliflozin is associated with improvements in liver enzymes potentially consistent with reductions in liver fat: results from randomised trials including the EMPA-REG OUTCOME® trial. Diabetologia. 2018; 61:2155–63.
crossref
19. Kuchay MS, Krishan S, Mishra SK, Farooqui KJ, Singh MK, Wasir JS, et al. Effect of empagliflozin on liver fat in patients with type 2 diabetes and nonalcoholic fatty liver disease: a randomized controlled trial (E-LIFT Trial). Diabetes Care. 2018; 41:1801–8.
crossref
20. Sumida Y, Yoneda M. Current and future pharmacological therapies for NAFLD/NASH. J Gastroenterol. 2018; 53:362–76.
crossref
21. Lim S, Taskinen MR, Boren J. Crosstalk between nonalcoholic fatty liver disease and cardiometabolic syndrome. Obes Rev. 2019; 20:599–611.
crossref
22. Perkovic V, Jardine MJ, Neal B, Bompoint S, Heerspink HJL, Charytan DM, et al. Canagliflozin and renal outcomes in type 2 diabetes and nephropathy. N Engl J Med. 2019; 380:2295–306.
crossref
23. Wanner C, Inzucchi SE, Lachin JM, Fitchett D, von Eynatten M, Mattheus M, et al. Empagliflozin and progression of kidney disease in type 2 diabetes. N Engl J Med. 2016; 375:323–34.
crossref
24. Dekkers CCJ, Wheeler DC, Sjostrom CD, Stefansson BV, Cain V, Heerspink HJL. Effects of the sodium-glucose co-transporter 2 inhibitor dapagliflozin in patients with type 2 diabetes and stages 3b-4 chronic kidney disease. Nephrol Dial Transplant. 2018; 33:2005–11.
crossref
25. Skrtic M, Yang GK, Perkins BA, Soleymanlou N, Lytvyn Y, von Eynatten M, et al. Characterisation of glomerular haemodynamic responses to SGLT2 inhibition in patients with type 1 diabetes and renal hyperfiltration. Diabetologia. 2014; 57:2599–602.
crossref
26. Bolinder J, Ljunggren O, Kullberg J, Johansson L, Wilding J, Langkilde AM, et al. Effects of dapagliflozin on body weight, total fat mass, and regional adipose tissue distribution in patients with type 2 diabetes mellitus with inadequate glycemic control on metformin. J Clin Endocrinol Metab. 2012; 97:1020–31.
crossref
27. Cho HA, Jung YL, Lee YH, Lee YC, Lee JE, Lee SJ, et al. Efficacy of body weight reduction on the SGLT2 inhibitor in people with type 2 diabetes mellitus. J Obes Metab Syndr. 2017; 26:107–13.
crossref
28. Lim S. Effects of sodium-glucose cotransporter inhibitors on cardiorenal and metabolic systems: latest perspectives from the outcome trials. Diabetes Obes Metab. 2019; 21(Suppl 2):5–8.
crossref
29. Wanner C, Marx N. SGLT2 inhibitors: the future for treatment of type 2 diabetes mellitus and other chronic diseases. Diabetologia. 2018; 61:2134–9.
crossref
30. Lupsa BC, Inzucchi SE. Use of SGLT2 inhibitors in type 2 diabetes: weighing the risks and benefits. Diabetologia. 2018; 61:2118–25.
crossref

Fig. 1
Changes in glucose homeostasis parameters after 6 months of treatment. (A) Glycated hemoglobin (HbA1c), (B) fasting plasma glucose (FPG), (C) 2-hour postprandial glucose (PP2), and (D) homeostatic model assessment of insulin resistance (HOMA-IR). aP<0.05 between the two groups.
enm-2020-35-2-329f1.gif
Fig. 2
Changes in blood pressure and body composition after 6 months of treatment. (A) Systolic blood pressure (SBP), (B) diastolic blood pressure (DBP), (C) weight, (D) body fat, (E) abdominal visceral fat area (VFA), and (F) muscle mass. aP<0.05 between the two groups at 3 or 6 months; bP<0.05 for difference between 0 and 6 months.
enm-2020-35-2-329f2.gif
Fig. 3
Changes in ketone bodies, glucagon, and free fatty acid (FFA) levels after 6 months of treatment. (A) Total ketone, (B) β-OH butyric acid, (C) acetoacetate, (D) glucagon, and (E) FFA. aP<0.05 between the two groups.
enm-2020-35-2-329f3.gif
Table 1
Baseline Characteristics of Study Subjects
Characteristic Dose escalation (n=60) Empagliflozin add-on (n=60) P value
Male sex 44 (73.3) 39 (65.0) NS

Age, yr 55.2±12.1 54.0±12.2 NS

Height, cm 166.6±7.8 166.1±9.2 NS

Body weight, kg 73.6±12.0 76.4±19.8 NS

BMI, kg/m2 26.4±3.1 27.4±5.2 NS

Waist circumference, cm 91.2±8.1 93.4±14.1 NS

SBP, mm Hg 135.5±15.8 134.1±12.6 NS

DBP, mm Hg 82.3±12.6 78.9±9.7 NS

FPG, mg/dL 184.9±49.7 172.6±46.7 NS

PP2, mg/dL 272.2±82.5 280.8±92.2 NS

HbA1c, % 8.5±1.1 8.6±1.5 NS

Total cholesterol, mg/dL 168.6±39.1 167.4±40.6 NS

Triglycerides, mg/dL 182.5±111.4 167.5±112.7 NS

HDL-C, mg/dL 45.8±10.0 49.6±25.8 NS

LDL-C, mg/dL 99.5±26.0 95.4±30.9 NS

Fasting C-peptide, ng/mL 3.0±1.4 3.4±1.7 NS

Fasting glucagon, pg/mL 180.0±137.8 166.7±88.8 NS

AST, IU/L 32.6±22.3 36.6±25.0 NS

ALT, IU/L 35.3±28.7 42.8±34.9 NS

Creatinine, mg/dL 0.81±0.18 0.76±0.17 NS

Duration of T2D, yr 10.5±6.9 10.6±7.0 NS

Family history of T2D 36 (60.0) 31 (51.7) NS

Hypertension 29 (48.3) 26 (43.3) NS

Dyslipidemia 36 (60.0) 41 (68.3) NS

Smoking 16 (26.7) 14 (23.3) NS

Concomitant medication NS
 Monotherapy 11 (18.3) 13 (21.7)
 Dual therapy 45 (75.0) 37 (61.7)
 Triple therapy 4 (6.7) 10 (16.7)

Values are expressed as number (%) or mean±standard deviation.

NS, not significant; BMI, body mass index; SBP, systolic blood pressure; DBP, diastolic blood pressure; FPG, fasting plasma glucose; PP2, 2-hour postprandial glucose; HbA1c, glycated hemoglobin; HDL-C, high-density lipoprotein cholesterol; LDL-C, low-density lipoprotein cholesterol; AST, aspartate aminotransferase; ALT, alanine aminotransferase; T2D, type 2 diabetes.

Table 2
Changes in Anthropometric and Biochemical Parameters after 6 Months of Treatment with Empagliflozin or Dose Escalation
Variable Dose escalation Empagliflozin add-on P valuea


Baseline 6 months P value Baseline 6 months P value
SBP, mm Hg 135.5±15.8 138.7±15.2 0.286 133.6±12.5 128.1±13.3 0.005b 0.008b

DBP, mm Hg 82.3±12.6 82.0±12.3 0.878 78.7±9.8 74.8±11.0 0.009b 0.120

FPG, mg/dL 184.9±49.7 174.5±39.4 0.069 174.0±46.7 132.9±31.3 <0.001b <0.001b

PP2, mg/dL 272.2±82.5 267.2±83.0 0.616 282.9±92.6 222.7±88.5 <0.001b 0.001b

HbA1c, % 8.5±1.1 8.1±1.1 0.005 8.6±1.6 7.6±1.5 <0.001b 0.003b

Insulin, μIU/mL 10.0±4.7 10.3±4.5 0.516 12.1±8.2 10.0±7.0 0.016b 0.016b

C-peptide, ng/mL 3.0±1.4 2.9±1.2 0.592 3.3±1.6 2.7±1.5 0.001b 0.017b

Glucagon, pg/mL 180.0±137.8 178.4±131.6 0.871 167.9±89.8 258.0±154.3 <0.001b 0.002b

Total cholesterol, mg/dL 168.6±39.1 161.7±35.7 0.179 167.6±41.6 157.0±36.5 0.030b 0.730

Triglycerides, mg/dL 182.5±111.4 181.7±159.7 0.944 169.5±114.9 129.0±59.5 0.001b 0.107

HDL-C, mg/dL 45.8±10.0 46.1±11.0 0.974 49.6±26.2 48.6±12.4 0.757 0.761

LDL-C, mg/dL 99.5±26.0 96.7±26.4 0.408 95.9±31.3 92.3±26.5 0.303 0.951

AST, IU/L 32.6±22.3 33.8±17.2 0.661 34.4±17.3 28.8±10.9 0.002b 0.023b

ALT, IU/L 35.3±28.7 38.2±31.7 0.423 40.7±29.9 33.7±22.1 0.015b 0.023b

eGFR, mL/min/1.73 m2 96.3±18.7 95.6±16.7 0.997 100.3±18.4 100.9±21.0 0.703 0.772

Creatinine, mg/dL 0.81±0.18 0.81±0.18 0.673 0.76±0.17 0.76±0.19 0.623 0.520

Sodium, mmol/L 139.9±2.1 139.9±2.2 0.671 139.7±2.5 140.5±1.9 0.003b 0.019b

Potassium, mmol/L 4.5±0.4 4.4±0.3 0.414 4.5±0.4 4.5±0.4 0.766 0.439

Chlorine, mmol/L 103.2±2.5 102.9±2.3 0.149 102.6±2.5 105.2±12.0 0.109 0.060

FFA, μmol/L 602.1±207.8 619.4±221.6 0.336 659.4±233.0 695.6±261.5 0.278 0.892

Total ketone, μmole/L 134.9±121.0 158.0±136.8 0.487 143.0±118.0 294.8±296.4 <0.001b 0.002b

β-Hydroxybutyrate, μmol/L 90.8±93.3 108.0±100.1 0.473 98.2±84.6 207.9±228.3 <0.001b 0.003b

Acetoacetate, μmol/L 45.1±29.9 50.0±38.5 0.688 44.8±34.7 84.9±71.8 <0.001b 0.001b

PCr, mg/mmol 137.3±169.3 180.1±295.9 0.084 165.5±163.8 144.4±133.1 0.114 0.021b

MCr, mg/mmol 44.8±122.4 75.4±223.2 0.065 73.8±138.7 50.8±112.7 0.039b 0.006b

FE-glucose, % 2.77±4.47 3.55±7.42 0.476 5.13±9.87 30.47±14.95 <0.001b <0.001b

FE-Na, % 0.50±0.29 0.48±0.34 0.047 0.46±0.28 0.55±0.30 0.065 0.007b

FE-K, % 9.31±4.61 8.87±3.29 0.185 9.47±4.98 9.91±3.66 0.569 0.188

FE-Cl, % 0.77±0.40 0.79±0.46 0.418 0.73±0.41 0.85±0.48 0.085 0.066

FE-Ca, % 0.70±0.52 0.60±0.39 0.100 0.62±0.43 0.69±0.38 0.182 0.053

FE-P, % 9.64±3.53 10.41±4.73 0.448 9.35±4.31 10.08±3.71 0.461 0.963

Body composition
 Body weight, kg 73.6±12.0 73.0±11.8 0.141 75.5±19.0 73.0±18.0 <0.001b 0.001b
 BMI, kg/m2 26.4±3.1 26.3±2.9 0.174 27.3±5.2 26.3±4.9 <0.001b 0.001b
 Waist circumference, cm 91.2±8.1 91.3±7.4 0.474 92.6±13.8 90.8±12.5 0.053 0.047b
 Total body water, L 38.0±6.8 37.8±6.6 0.394 37.5±8.2 37.1±8.1 0.515 0.925
 Lean body mass, kg 48.8±8.8 48.5±8.6 0.382 47.5±11.5 47.6±10.4 0.434 0.999
 Whole body fat mass, kg 21.9±6.5 21.7±6.0 0.231 24.7±10.9 22.3±9.8 <0.001b <0.001b
 Whole body fat percent (%) 29.7±7.1 29.6±6.4 0.549 31.8±7.9 29.8±7.3 <0.001b <0.001b
 Abdominal VFA, cm2 102.1±36.1 100.5±33.6 0.460 115.8±52.9 104.3±48.8 <0.001b <0.001b

Values are expressed as mean±standard deviation.

SBP, systolic blood pressure; DBP, diastolic blood pressure; FPG, fasting plasma glucose; PP2, 2-hour postprandial glucose; HbA1c, glycated hemoglobin; HDL-C, high-density lipoprotein cholesterol; LDL-C, low-density lipoprotein cholesterol; AST, aspartate aminotransferase; ALT, alanine aminotransferase; eGFR, estimated glomerular filtration rate; FFA, free fatty acid; PCr, protein/creatinine ratio; MCr, microalbumin/creatinine ratio; FE, fractional excretion; VFA, visceral fat area.

a P for comparison of changes between two groups;

b Significant P values.

Table 3
Safety Profile
Dose escalation Empagliflozin add-on
Hypoglycemia 0 0

Infection including UTI, genital infection 0 1
 Male 0 0
 Female 0 1

DKA 0 0

HHS 0 0

UTI, urinary tract infection; DKA, diabetic ketoacidosis; HHS, hyperosmolar hyperglycemic syndrome.

TOOLS
Similar articles