

 PDF
PDF ePub
ePub Citation
 Print
Print


INTRODUCTION
Stress echocardiography was introduced in the early 1980s and has been established as a reliable, non-invasive, and cost-effective diagnostic method and a risk-stratification process for patients with suspected or known coronary artery disease (CAD).1)
According to the 2013 European Society of Cardiology (ESC) guidelines for management of stable CAD,2) dobutamine stress echocardiography has a sensitivity of 76%–83% and a specificity of 82%–86%; vasodilator stress echocardiography has a sensitivity of 72%–79% and a specificity of 92%–95%; and exercise stress echocardiography has a sensitivity of 80%–85% and a specificity of 80%–88%.3) Therefore, overall, stress echocardiography has a sensitivity of 72%–85% and a specificity of 80%–95%.
Despite the very high specificity of stress echocardiography, a high number of false-positive results can still be expected; in other words, many patients who undergo a stress echocardiogram and receive a positive result do not present with obstructive CAD on a subsequent coronary angiography. Possible explanations for false-positive results on stress echocardiography include the presence of a left bundle branch block, hypertensive heart disease, cardiomyopathy, epicardial coronary artery spasm, small-vessel CAD, and overinterpretation of data by reviewing echocardiographers.4)
These false-positive findings present a management challenge that leads to uncertainty about if and how to treat patients who receive a false-positive stress echocardiography result.5)
Herein, we studied patients who received a false-positive stress echocardiogram to evaluate how they differed from patients with a true-positive stress echocardiogram result.
METHODS
Study population
This is a retrospective observational single-center study that included all consecutive patients from 2009–2018 who 1) underwent a stress echocardiogram for clinical suspicion of stable CAD, 2) received a positive result for myocardial ischemia and 3) were referred to the same center to undergo coronary angiography within the following 12 months. All stress echocardiograms regardless of whether they used exercise (in the treadmill), dobutamine, or vasodilators (dipyridamole) were considered. The choice of stressor was made by the requesting physician.
This study was carried out in accordance with the Code of Ethics of the World Medical Association (Declaration of Helsinki) for experiments involving humans and approved by our local ethics committee. The requirement for informed consent was waived due to the retrospective nature of this study.
Stress echocardiography
Echocardiographic examinations with dobutamine or dipyridamole were performed with a commercially available iE33 ultrasound system (Philips Medical Systems, Andover, MA, USA) and echocardiograms with exercise stress were performed with a commercially available Vivid S70 (General Electric Healthcare, Horten, Norway) or the CX50 (Philips Medical Systems) ultrasound system.
Two-dimensional echocardiographic examination was performed before, during, and up to 10 minutes after stressor cessation. We continuously monitored and intermittently stored a two-dimensional echocardiogram in the standard parasternal long- and short-axis views of the left ventricle at the level of the papillary muscles as well as both apical 4- and 2-chambers.
For analysis, the left ventricle was divided into 17 segments as recommended by the American Society of Echocardiography and the European Association of Cardiovascular Imaging.6) The left ventricle was divided into anterior and posterior circulations: the anterior circulation (left anterior descending coronary artery) comprises the anterior wall, anterior septum, mid- and apical inferoseptum, apex, and apical segments of the inferior and lateral walls. The posterior circulation (left circumflex and right coronary arteries) comprises the remaining myocardial segments.7)
Segments were graded based on systolic thickening and excursion: 1 = normal; 2 = hypokinetic; 3 = akinetic; and 4 = dyskinetic. The wall motion score index (WMSI) was calculated as the total score (sum of grades of all segments) divided by the number of segments scored. Change in WMSI (ΔWMSI) was calculated as the difference between peak and basal score. Ischemia was defined as new or worsened wall motion abnormalities during stress as indicated by an increase in wall motion score ≥1 grade in ≥1 segment,8) and ischemia was not considered present when akinetic segments at rest became dyskinetic during stress.9) A quad-screen format was used for comparative analysis of echocardiographic images. Stress echocardiographic results were defined as abnormal if ischemia occurred during stress.
Dobutamine protocol
Dobutamine intravenous infusion was initiated at 5 μg/kg/min, and dosage was increased at 3-min increments to 10, 20, 30, and 40 μg/kg/min. Intravenous atropine (0.25 mg–1.0 mg) was given after the 40-μg/kg/min dose if the target heart rate (85% of 220 bpm minus age) was not achieved.
Dobutamine intravenous infusion was terminated if any of the following occurred: obvious echocardiographic positivity (new or worsening dyssynergy); age-predicted maximum heart rate reached; severe hypertension (systolic blood pressure ≥240 mmHg or diastolic blood pressure ≥120 mmHg); symptomatic reduction in systolic blood pressure ≥40 mmHg from baseline; sustained supraventricular or ventricular arrhythmias; or intolerable side effects.
The test was considered inconclusive if ischemia was not detected by echocardiography and the target heart rate was not achieved.
During the test, a continuous 12-lead electrocardiogram was monitored, and blood pressure was measured every 3 minutes by the cuff method.
Dipyridamole protocol
Dipyridamole intravenous infusion was performed with 0.84 mg/kg over 6 min. Aminophylline was routinely used to reverse the effect of dipyridamole.
During the test, a continuous 12-lead electrocardiogram was monitored, and blood pressure was measured every 3 minutes by the cuff method.
Exercise protocol
Exercise stress echocardiograms were performed using a treadmill. The Bruce protocol was used with 3-minute stages.10)
The treadmill was stopped if any of the following occurred: obvious echocardiographic positivity (new or worsening dyssynergy); age-predicted maximum heart rate reached; fatigue; severe hypertension (systolic blood pressure ≥240 mmHg or diastolic blood pressure ≥120 mmHg); symptomatic reduction in systolic blood pressure ≥40 mmHg from baseline; or sustained supraventricular or ventricular arrhythmias.
The test was considered inconclusive if ischemia was not detected in echocardiographic examination and the target heart rate (85% of 220 bpm minus age) was not achieved.
We used continuous 12-lead electrocardiographic monitoring throughout the test, and blood pressure was measured every 3 minutes by the cuff method.
Coronary angiography
Cardiac catheterization with coronary angiography was performed using standard clinical techniques. Multiple views were obtained to show lesions in orthogonal projections and to avoid vessel overlap. All angiographic studies were interpreted by highly trained observers at the time of the procedure, and visual estimates of maximal percent lumen stenosis for each major artery were recorded and entered into an angiographic database.
A diagnosis of obstructive CAD was established when stenosis ≥50% was found in any epicardial coronary artery in coronary angiography.
Study groups
Enrolled patients were subdivided into either a false-positive result group or a true-positive result group. A false positive was defined as a positive ischemic stress echocardiography result with no obstructive CAD (<50% stenosis) according to subsequent coronary angiography. A true positive was defined as a positive stress echocardiography result with obstructive CAD (≥50% stenosis) according to subsequent coronary angiography.
Statistical analyses
Clinical and echocardiographic variables were compared between patients with true- and false-positive stress echocardiogram results.
Continuous variables are presented as means and standard deviations or medians and interquartile ranges, depending on the Gaussian or skewed distributions, and categorical variables are presented as numbers and percentages. Statistical comparisons between groups for continuous data were performed using the unpaired Student's t-test or the Mann-Whitney rank-sum test, as appropriate. Categorical variables were compared using χ2 statistics or Fisher's exact test, as appropriate.
Multivariable stepwise logistic regression analysis was used to identify independent variables that predict true-positive stress echocardiogram results. Only variables significantly related to false-positive results in univariate analysis were considered for the stepwise forward multiple regression analysis.
Statistical analyses were performed with the STATA v14 statistical package (College Station, Texas, USA). A p-value <0.05 was considered to indicate statistical significance. All reported p-values are two-tailed.
RESULTS
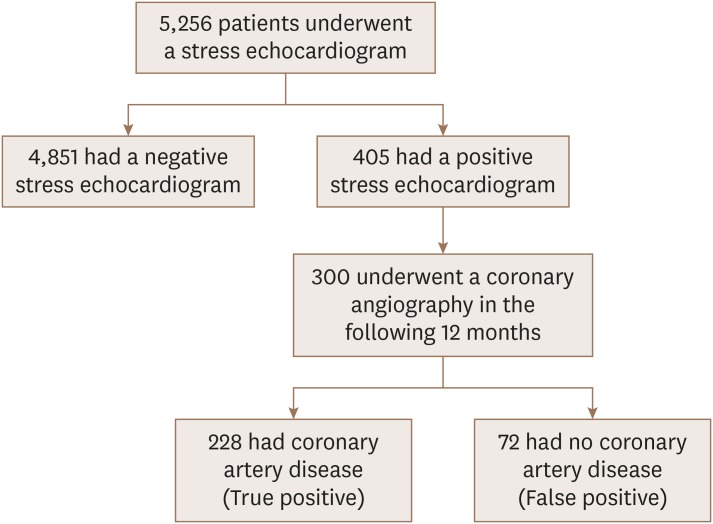
A total of 5,256 patients underwent a stress echocardiogram (using an exercise, dobutamine, or dipyridamole stressor) from 2009–2018, and 405 (7.7%) had a positive result. Among these 405 patients, 300 also underwent a coronary angiography in the following 12 months and these 300 patients were included in this study (Figure 1).
The study population had a mean age of 64.9 ± 9.4 years, mean BMI of 27.0 ± 3.6 kg/m2, and 230 (76.7%) were men. The prevalence of cardiovascular risk factors were: hypertension = 238 (79.3%), dyslipidemia = 217 (72.3%), diabetes mellitus = 115 (38.3%), and smoker = 50 (16.7%) (Table 1).
Table 1
Patient characteristics by stressor
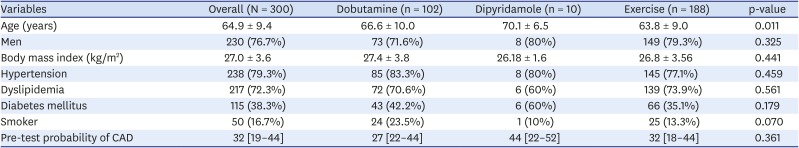
The mean pre-test probability of CAD, based on age, sex, and symptoms, according to the 2019 ESC guidelines for diagnosis and management of chronic coronary syndromes,11) was 31% ± 15.0 (Table 1).
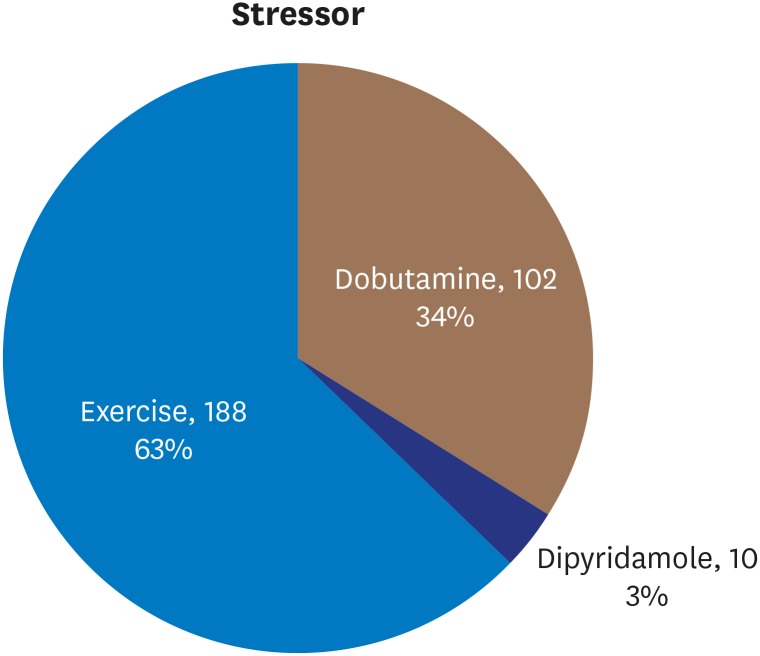
Stressor choice was made by the patients' physicians and stressors were distributed in the dataset as follows: dobutamine 102 (34%), dipyridamole 10 (3%), and exercise 188 (63%) (Figure 2).
Patient characteristics were similar among the groups who underwent different stressors, except for age, where patients who received dipyridamole for their echocardiogram were older than patients in the other stressor groups (Table 1).
Concerning echocardiograms, basal, peak, and ΔWMSI were similar among all stressors: mean basal WMSI = 1.12 ± 0.20, peak WMSI = 1.38 ± 0.25, and ΔWMSI = 0.26 ± 0.15 (Table 2).
Table 2
Wall motion abnormalities by stressor
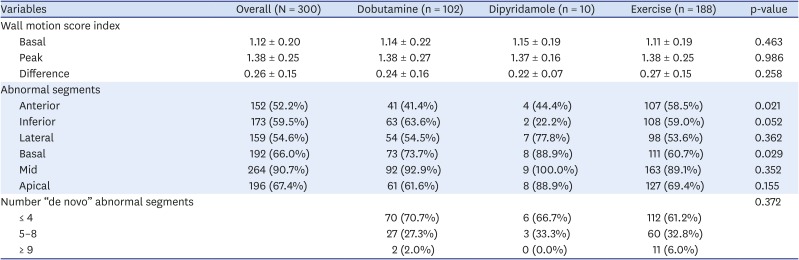
Patients who underwent stress echocardiogram with dobutamine or exercise had wall motion abnormalities more frequently in the inferior wall and mid-segments, while lateral wall and mid-segments were more common among patients who received dipyridamole (Table 2).
The number of “de novo” abnormal segments, usually ≤4, was similar among the different stressor groups (Table 2).
The median number of days between stress echocardiogram and coronary angiography was 46 days, and was similar among the stressor groups (Table 3).
Table 3
Coronary angiography by stressor
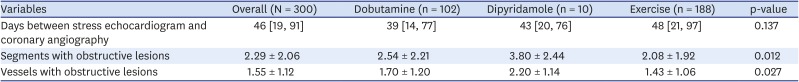
The mean numbers of segments and vessels with obstructive lesions were 2.29 ± 2.06 and 1.55 ± 1.12, respectively, and they were more common in the dipyridamole group (3.80 ± 2.44 and 2.20 ± 1.14) (Table 3).
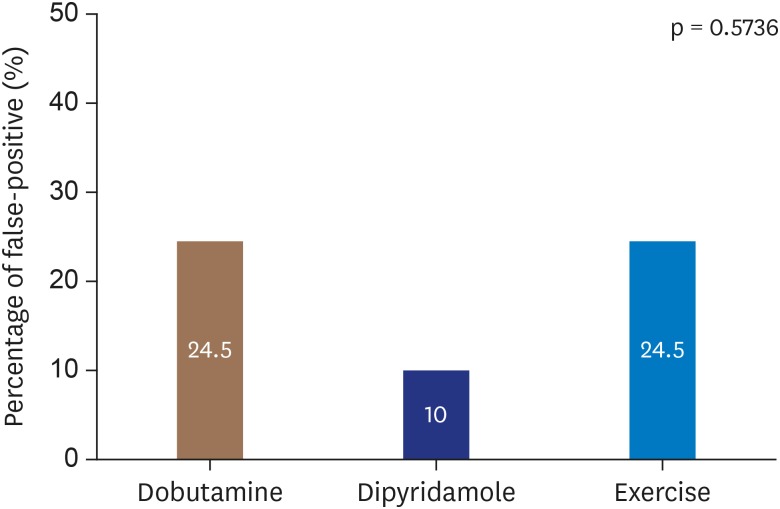
Among the 300 included patients, 72 (24%) had a false-positive stress echocardiogram (Table 4). Similar rates of false-positive results were found across the stressor groups—dobutamine (24.5%), dipyridamole (10%), and exercise (24.5%)—however, there was a non-statistically significant trend toward higher specificity with dipyridamole (p = 0.5736) (Figure 3).
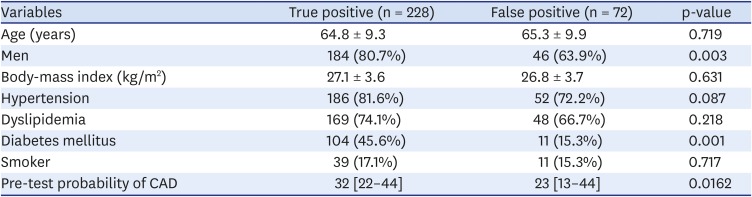
Table 4
Patient characteristics by stress echocardiogram result
Twenty-four percent of false positives from stress echocardiography corresponded to a positive predictive value of 76% in our study.
Compared with the false-positive group, the true-positive group was more likely to be male (80.7% vs. 63.9%, p = 0.003), had a higher diabetes prevalence (45.6% vs. 15.3%, p = 0.001), and had a lower pre-test probability of CAD (32% vs. 23%, p = 0.016). The false-positive and true-positive groups had similar prevalence of obesity (body-mass index: 27.1 vs. 26.8, p = 0.631), hypertension (81.6% vs. 72.2%, p = 0.087), dyslipidemia (74.1% vs. 66.7%, p = 0.218) and smoking (17.1% vs. 15.3%, p = 0.717) (Table 4). Basal, peak, and ΔWMSI were higher in the true-positive group than the false-positive group (Table 5).
Table 5
Wall motion abnormalities by stress echocardiogram result
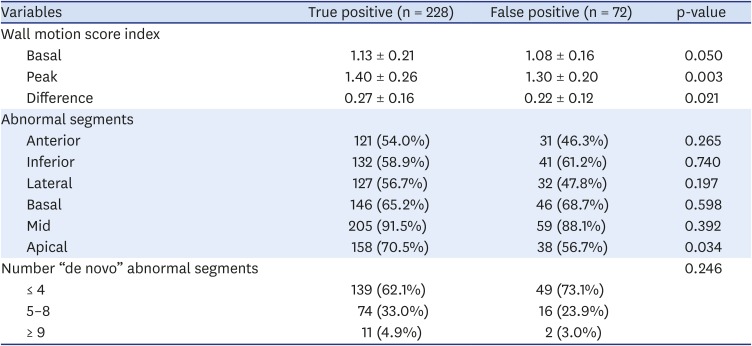
The true-positive group more frequently had wall motion abnormalities in the apical segments (70.5% vs. 56.7%, p = 0.034), but the abnormality distribution among anterior, inferior, and lateral walls was similar (Table 5). The number of “de novo” abnormal segments was similar between the true- and false-positive groups, and was usually ≤ 4 segments (Table 5).
The number of days between stress echocardiogram and coronary angiography was similar between true- and false-positive groups (Table 6).
Table 6
Coronary angiography by stress echocardiogram result

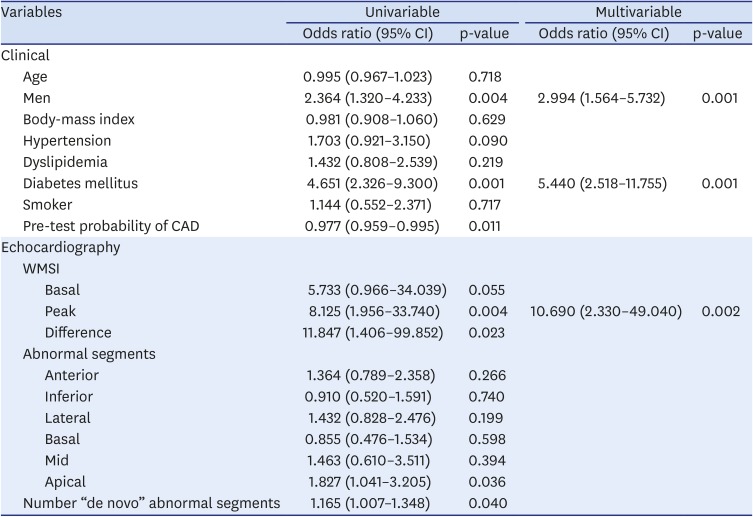
In a multivariable predictive model of true-positive stress echocardiogram results, male sex (odds ratio [OR] = 2.99, 95% confidence interval [CI]: 1.564 – 5.732), diabetes (OR = 5.440, 95% CI: 2.518 – 11.755) and peak WMSI (OR = 10.690, 95% CI: 2.330 – 49.040) were significantly associated with a true-positive result (Table 7).
Table 7
Predictive model for true-positive stress echocardiogram results
DISCUSSION
For patients with suspected CAD, a variety of diagnostic procedures are currently available. According to the 2019 ESC guidelines for diagnosis and management of chronic coronary syndromes,11) non-invasive functional imaging for myocardial ischemia, or coronary computed tomography angiography are recommended as the initial tests to diagnose CAD in symptomatic patients for whom obstructive CAD cannot be excluded by clinical assessment alone (recommendation class I, level of evidence B).
The Cardiology Department at the Hospital Garcia de Orta, in Almada, Portugal, in known for its local expertise in exercise stress echocardiography. Hence, stress echocardiography is the preferred method for non-invasive functional imaging at this center, and exercise is the preferred stressor and was used for 63% of patients in this study.
The reasons there is a center-wide preference for exercise stress echocardiography are because the cardiology team is experienced in performing it, it has low adverse effects and complication rates, and it can provide more information than just the presence of myocardial ischemia, including exercise tolerance and blood-pressure response to exercise.
Dobutamine was used for 34% of the study population because it is the second most preferred stressor at this center, and is chosen when the patient is unable to tolerate the treadmill exercise.
Dipyridamole was the third option and, thus, used infrequently (3% of the study population) and usually with older patients because it was only used when there were contraindications to exercise and dobutamine.
The prevalence of false-positive stress echocardiographic results was 24%, which is a non-negligible subset of patients, and the rate was similar across stressors, suggesting that false positivity is not associated with stressor characteristics but with specific patient characteristics.
The fact that a patient may not have obstructive epicardial CAD despite having a positive stress echocardiogram result does not necessarily indicate that the echocardiogram was incorrect. There are many possible causes of ischemic wall motion abnormalities on stress echocardiogram coinciding with an absence of stenotic plaque on traditional angiography, such as microvascular abnormalities, coronary slow-flow phenomenon, vasomotor changes, endothelial dysfunction, small-vessel coronary disease, and left ventricular hypertrophy.12)
Latcham et al.13) concluded that false-positive dobutamine stress echocardiograms more frequently involved the inferobasal, posterior-basal, and mid-posterior left ventricular segments, which was not consistent with our findings. In our study, wall motion abnormalities on false-positive stress echocardiograms more frequently involved the apical segments, with no trend toward a specific wall. On the other hand, our findings corroborated From et al.,14) in which false-positive stress echocardiograms frequently involved the apical and mid-left ventricular segments, suggesting that some false positives may correspond to a forme fruste variety of apical ballooning syndrome.
From et al.15) investigated the prognoses of patients with false-positive stress echocardiographic results and, during an average follow-up of 2.4 years, they found no significant difference in overall death rates between those with and without 50% luminal narrowing on coronary angiography.12) Nevertheless, some authors think there is insufficient evidence that false-positive stress echocardiography in the absence of obstructive CAD portends a poor outcome.5)
In cases with a positive stress echocardiogram, we concluded that it is more likely to be a true positive if the patient is a man, diabetic, and with a high peak WMSI.
Our study contains the limitations inherent to an observational retrospective study. Furthermore, an inter-operator variability analysis was not performed and, because only patients with positive stress echocardiogram underwent coronary angiography, the sensitivity and specificity of stress echocardiography were impossible to assess.
Patients with false-positive stress echocardiographic results should be better characterized in further research to define appropriate treatments and possibly improve long-term prognosis.
CONCLUSION
Patients with false-positive stress echocardiogram results comprised 24% of our study population, and the false positivity rate was similar across the different stressors. The positive predictive value of stress echocardiography was 76%. Patients with true-positive stress echocardiogram results were more likely to be men, diabetic, and have a high peak WMSI.
 XML Download