

 PDF
PDF ePub
ePub Citation
 Print
Print


INTRODUCTION
Cardiac resynchronization therapy (CRT) is an effective treatment for selected heart failure (HF) patients under optimized pharmacological therapy.1)2)3) However, up to one third of patients with advanced HF do not improve after CRT, which has significant clinical and economic implications.2)4) The need to better identify patients who will respond to this treatment is currently unmet. Both right ventricle (RV) function and pulmonary hypertension (PH) have significant prognostic value in HF.5)6)7) The response to CRT also appears to be influenced by PH8)9) and RV function.10)11)12) However, discordant findings have been published on the predictive value of baseline RV function regarding CRT response.13)
In patients with chronic left ventricle (LV) dysfunction, continuous backward transmission of left-side filling pressures and pulmonary circulation remodeling imposes a chronic increase in RV afterload.14)15) This implies that echocardiographic measures of RV function will reflect not only RV inotropism but also PH (a major determinant of RV afterload). Recently, some studies suggested that combining measures of PH severity and RV function might better capture the RV-pulmonary artery (RV-PA) coupling than the isolated measures.6)16)17)18) The echocardiography derived ratio between tricuspid annular plane systolic excursion (TAPSE) and pulmonary artery systolic pressure (PASP), or TAPSE/PASP, is an indirect estimate of RV-PA coupling that has been shown to correlate with invasive measures.16)19) As HF progresses the TAPSE/PSAP ratio declines, along with a progressive loss of RV efficiency in its pumping function.16)17) However, the uncoupling of RV-PA during HF progression is not straightforward, and some patients can present moderate to severe PH without major RV dysfunction.18) In HF patients undergoing CRT implantation, the clinical implications of these new RV-PA coupling measures are still unknown.
In the present study, we aimed to describe the distribution of RV-PA coupling of HF patients undergoing CRT and examine its correlates and predictive ability of the response to CRT and all-cause mortality.
METHODS
Study population
A retrospective, single-center, study was conducted in 207 patients with HF submitted to CRT between 2012 and 2017 at Centro Hospitalar Universitário do Porto. The study was approved by the Research Ethics Committee of Centro Hospitalar Universitário do Porto (reference number: 2018.055[051-DEFI/051-CES]).
Patient demographic, clinical and echocardiographic data before and after CRT were collected by review of electronic medical records. Patient population was analyzed with respect to age, sex, etiology of HF (ischemic vs non-ischemic) and comorbidities (diabetes, hypertension, chronic obstructive pulmonary disease [COPD], smoke, stroke, atrial fibrillation). All patients were assessed for coronary disease prior to CRT implantation either by ischemic stress testing or coronary angiography. In patients with significant coronary disease, all revascularisation procedures clinically indicated were performed before consideration for CRT. Suitable patients with ischemic cardiomyopathy that remained in NYHA ≥ II and had a left ventricular ejection fraction (LVEF) < 35% despite optimal medical therapy and revascularisation were submitted to CRT implantation. Non-ischemic cardiomyopathy patients were on optimized medical therapy for HF according to current therapeutic guidelines and met criteria for CRT implantation.3) The average follow-up period between baseline echocardiography and follow-up echocardiography after CRT was 21 ± 12 months (median, 19 months). A 6 to 12-month period following CRT implantation was used to assess clinical and echocardiographic impact of this therapy. Biochemical analyses (serum creatinine, blood hemoglobin concentration, N-terminal pro hormone b-type natriuretic peptide [NT-proBNP]) were made at the hospital laboratory with standard methods. Glomerular filtration rate (GFR) was derived from “CKD-EPI” equation20) using the most recent value of serum creatinine before CRT implantation. Response to CRT was defined as an increase of LVEF (Δ LVEF ≥ 5%) at 6 to 12 month following CRT implantation. All-cause mortality was ascertained by review of electronic medical records.
Transthoracic echocardiography was performed by certified sonographers, using a commercial equipment (Phillips IE33 and CX50 (Bothell, WA, USA) according to current international recommendations.21) LVEF was calculated using the biplane Simpson method. The RV and pulmonary circulation function were assessed by measuring TAPSE and PASP. We estimated PASP using right atrial pressure (RAP) and tricuspid regurgitant velocity (TRV) as follows: RAP + 4(TRV)2.22) We assumed RAP based on inferior vena cava measurements: normal respiratory variability and diameter ≤ 21 mm, 3 mmHg; impaired variability or diameter > 21 mm, 8 mmHg; impaired variability and diameter > 21 mm, 15 mmHg. Ratio between early ventricular wave filing (E) and early myocardial velocity (e′) was used to evaluate LV filling pressures. The right ventricular fractional area change (RVFAC) was estimated as the ratio of change in RV end-systolic area (RVESA) and RV end-diastolic area (RVEDA), calculated as follows: RVFAC = (RVEDA − RVESA) / RVEDA. In patients with atrial fibrillation or frequent extrasystoles causing significant beat-to-beat variation, measurements were made by averaging the values of multiple beats.
Statistical analysis
Continuous variables are shown as the mean ± standard deviation. Categorical variables are expressed as percentage of patients (%). Cox proportional hazards model were used to assess the impact of baseline PASP, TAPSE and TAPSE/PASP on all-cause mortality over maximum follow-up period of 4 years after CRT implantation. Coefficient of Pearson was used for correlations performed between PASP vs log (NT-proBNP) before CRT. Receiver operator characteristic (ROC) curves were plotted for TAPSE, PASP and TAPSE/PASP ratio to determine area under the curve (AUC), specificity and sensitivity of the optimal cut-offs. Data were assessed for normal distribution using the D'Agostino-Pearson test. Differences between groups were tested by using the Fisher's exact test and Student's t-test followed by the Holm-Sidak test for multiple comparisons. All analyses were performed using STATA Statistical Software, (StataCorp, College Station, TX, USA; version 15 for macOS). Data were plotted and graphed using GraphPad Prism (GraphPad Software, La Jolla, CA, USA, 7.0a for macOS). A p value < 0.05 was considered statistically significant.
RESULTS
Studied population
Complete clinical and echocardiographic data were available in 70 of the initial 207 patients; Inclusion and exclusion criteria are summarized in Figure 1. Demographic and clinical characteristics of these seventy patients are showed in Table 1 and subdivided according to median TAPSE/PASP for this population (0.43 mm/mmHg). The average age was 69 ± 9 years and 69% were male. A total prevalence of 42% diabetes, 80% arterial hypertension, 57% atrial fibrillation, 20% COPD and 10% stroke were observed in our cohort. About half of patients (52%) had ischemic cardiomyopathy. Most patients were on NYHA III class (76%) before CRT implantation. The mean baseline LVEF was 26% ± 7%; the other echocardiographic features are displayed in Table 2.
Figure 1
Criteria for patient inclusion and exclusion in this retrospective observational study. CRT: cardiac resynchronization therapy, EACVI: European Association of Cardiovascular Imaging.
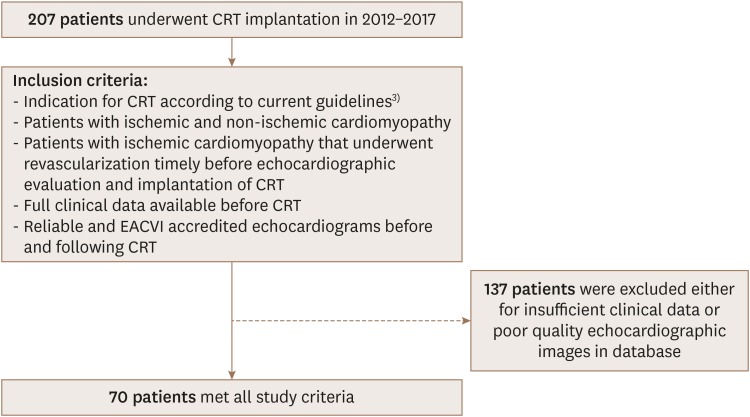
Table 1
Clinical characteristics of the studied population according to TAPSE/PASP
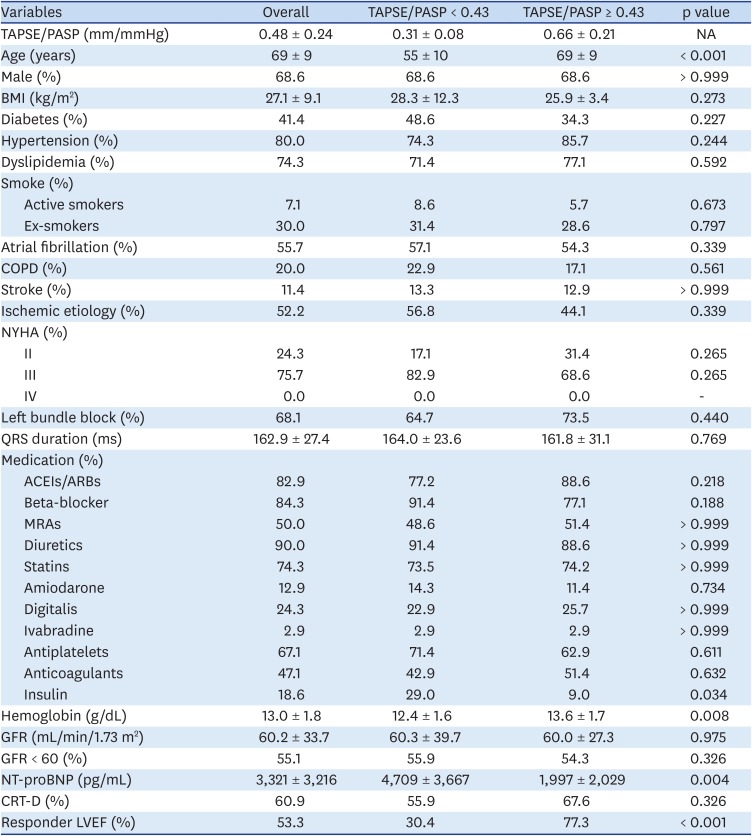
Clinical data was grouped according median value of TAPSE/PASP (0.43 mm/mmHg) for the studied population.
Data are presented as mean ± standard deviation.
ACEIs: angiotensin-covering enzyme inhibitors, ARBs: angiotensin II receptor blockers; BMI: body mass index, COPD: chronic obstructive pulmonary disease, CRT: cardiac resynchronization therapy, GFR: glomerular filtration rate, LVEF: left ventricular ejection fraction, MRAs: mineralocorticoid receptor antagonist, NA: not applicable, NT-proBNP: N-terminal pro-B-type natriuretic peptide, NYHA: New York Heart Association, PASP: estimated pulmonary artery systolic pressure, QRS: Duration of the QRS complex in the electrocardiogram . TAPSE: tricuspid annular plane systolic excursion.
Responder means an increase of LVEF ≥ 5% following CRT.
In continuous variables statistical significance between groups were calculated using Student's t-test; for categorical variables Fisher's exact test was used. A p value < 0.05 was considered significant.
Table 2
Echocardiographic characteristics of the studied population according to TAPSE/PASP
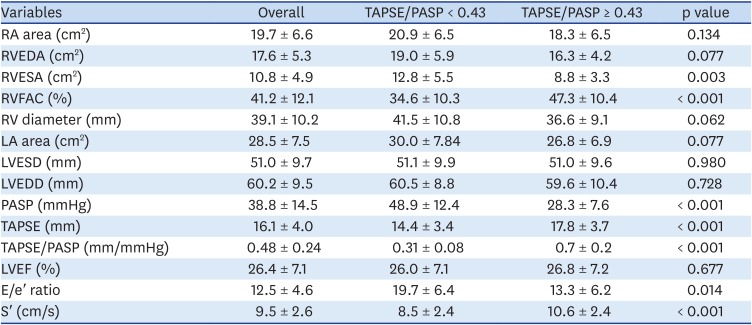
Clinical data was grouped according median value of TAPSE/PASP (0.43 mm/mmHg) for the studied population.
Data are presented as mean ± standard deviation.
E/E′: early diastolic transmitral flow velocity to averaged annular early diastolic velocity ratio, LA: left atrial, LVEDD: LV end-diastolic diameter, LVEF: left ventricular ejection fraction, LVESD: LV end-systolic diameter, PASP: pulmonary systolic artery pressure, RA: right atria, RV: right ventricle, RVEDA: RV end-diastolic area, RVESA: RV end-systolic area, RVFAC: right ventricular fractional area change, S′: tricuspid annular systolic velocity, TAPSE: tricuspid annular plane systolic excursion.
Statistical significance between groups was calculated using Student's t-test. A p value < 0.05 was considered significant.
TAPSE/PASP ratio subgroups
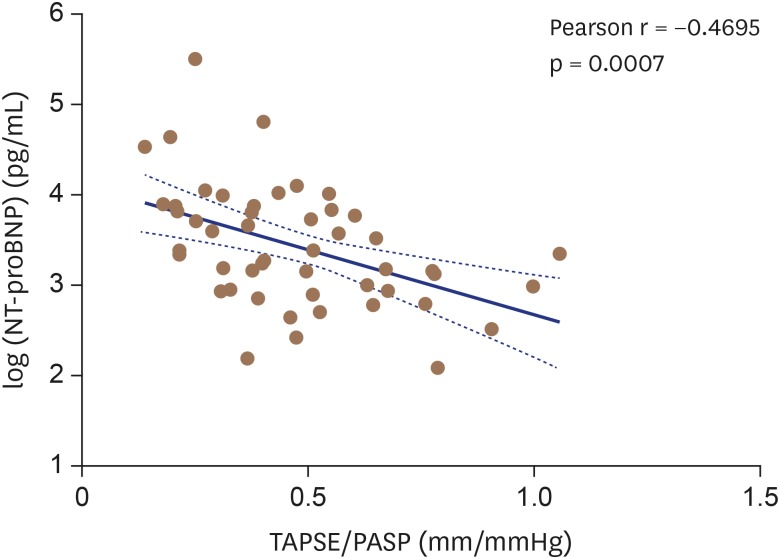
Patients with lower TAPSE/PASP ratios (worse RV-PA coupling) were younger than those with a higher ratio; no other demographic difference was found between subgroups. There were no significant differences in HF medication across subgroups, except for insulin therapy. Patients with lower TAPSE/PASP ratios exhibited lower levels of hemoglobin (Table 1). NT-proBNP levels were negatively correlated with TAPSE/PASP ratio (Table 1 and Figure 2).
Figure 2
Pearson's correlation analysis between TAPSE/PASP and log-transformed NT-proBNP before cardiac resynchronization therapy. Solid line represents its linear relationship, with 95% confidence interval limited by dashed lines. p < 0.05 was considered significant. NT-proBNP: N-terminal pro-B-type natriuretic peptide, PASP: pulmonary artery systolic pressure, TAPSE: tricuspid annular plane systolic excursion.
Higher RVESA and a trend for higher RV diameters, as well as for higher RVEDA, were seen in patients with lower TAPSE/PASP ratios. Likewise, patients with worse baseline RV systolic function, measured by RVFAC, also had lower TAPSE/PASP ratios (Table 2) and worse CRT response (Supplementary Figure 1). Higher tricuspid annular systolic velocity (S′) was associated with higher TAPSE/PASP (p < 0.05). LV filling pressures, estimated by mitral E/e′ ratio, were higher in groups with lower TAPSE/PASP ratios (p < 0.05). A trend toward larger left atria was found in the subgroup with lower TAPSE/PASP (Table 2).
TAPSE/PASP prognostic associations
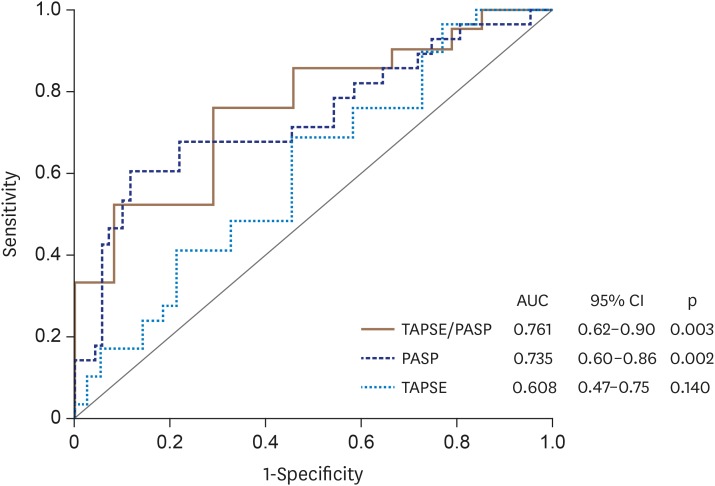
Regarding to CRT response, 53% of the 70 studied patients had an LVEF improvement (defined as Δ ≥ 5%) (Table 1). Dichotomous analysis of TAPSE, PASP and TAPSE/PASP ratio based on median values for each variable are displayed in Figure 3. PASP below threshold was significantly (p = 0.0006) associated with LVEF improvement. Likewise, TAPSE/PASP higher than 0.43 mm/mmHg was associated with LVEF improvement (p = 0.005). TAPSE per se was not associated with LVEF improvement. In Figure 4, we show ROC analysis for RV-PA variables addressed in this study for non-responders to CRT (LVEF improvement < 5%). The optimal cut-off points were 17.5 mm for TAPSE, 39 mmHg for PASP and 0.44 mm/mmHg for TAPSE/PASP. Among them, TAPSE/PASP ratio demonstrated the best discriminative ability (AUC of 0.76) to detect non-responders to CRT. The full diagnostic performance of the TAPSE/PASP ratio was the following: sensibility 76%, specificity 71%, positive predictive value 75%, negative predictive value 72%, positive likelihood ratio 2.6 and negative likelihood ratio 0.33.
Figure 3
Percentage of patients with improved LVEF response by baseline PASP, TAPSE and TAPSE/PASP (categorized by median) during maximum follow-up period after CRT. Patients with an increase of LVEF ≥ 5% after CRT were considered to have an improved response. Small inset indicates median values for the variables presented. Number of patients that showed improved LVEF is indicated inside bars. p-values were calculated with use of the chi-square test. *p < 0.05 was considered significant. CRT: cardiac resynchronization therapy, LVEF: left ventricular ejection fraction, ns: not-significant, PASP: pulmonary artery systolic pressure, TAPSE: tricuspid annular plane systolic excursion.
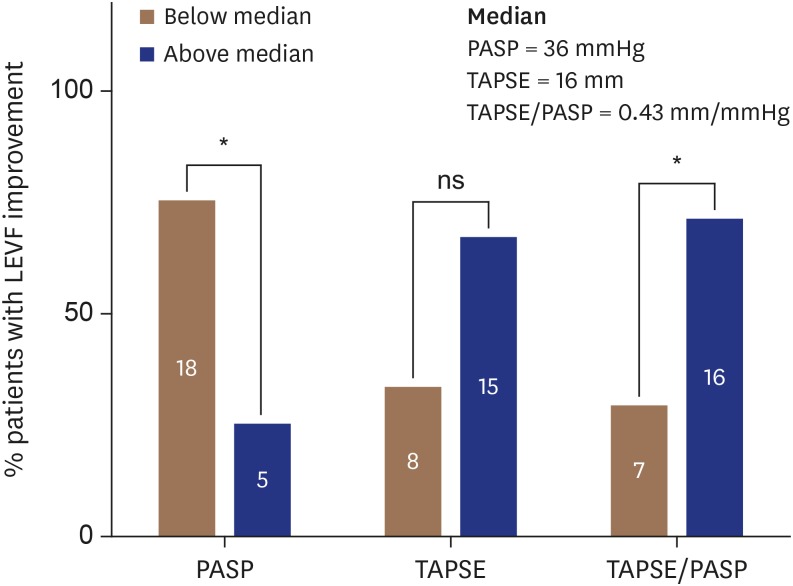
Figure 4
ROC curves for baseline TAPSE, PASP and TAPSE/PASP to identify unimproved LVEF (defined as Δ LVEF < 5%) after CRT. AUC: area under the curve, CI: confidence interval, LVEF: left ventricular ejection fraction, PASP: pulmonary artery systolic pressure, ROC: Receiver operator characteristic, TAPSE: tricuspid annular plane systolic excursion. p < 0.05 was considered significantly different from dotted line (AUC = 0.5).
In this study we also look for RV-PA coupling changes induced by CRT. Patients that responded to CRT also showed an improvement of RV-PA coupling during the follow-up period, as both TAPSE and TAPSE/PASP significantly increased in this subgroup, contrary to non-responders' (Table 3).
Table 3
Effect of CRT on right ventriculo-arterial coupling variables
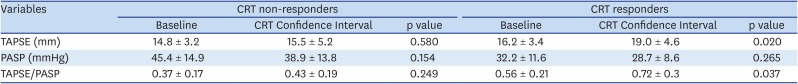
Data was grouped according to non-responders (Δ LVEF < 5%) and responders (Δ LVEF ≥ 5%) to CRT.
Data are presented as mean ± standard deviation.
CRT: cardiac resynchronization therapy, PASP: pulmonary artery systolic pressure, TAPSE: tricuspid annular plane systolic excursion.
Statistical significance between groups was calculated using Student's t-test. A p value < 0.05 was considered significant.
The average follow-up was 33 ± 15 months (median, 30 months). One-year survival was 96% and four-year survival was 78%. No significant differences in survival were observed between groups with different RV-PA coupling (TAPSE/PASP < 0.43 mm/mmHg vs ≥ 0.43 mm/mmHg: one-year survival 91% vs 100%; four-year survival of 80% vs 76%, p = 0.72). Higher baseline PASP was independently associated with prognosis (p = 0.025). TAPSE did not independently predicted adverse events in this population (Table 4).
Table 4
Survival analysis for echocardiographic variables at 4-year follow-up after CRT
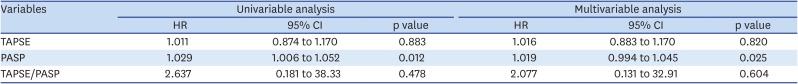
Data were calculated using Cox regression model. PASP, TAPSE and TAPSE/PASP correspond to baseline data before CRT. Multivariable models included adjustment for age, sex, log(NT-proBNP).
CI: confidence interval, CRT: cardiac resynchronization therapy, HR: hazard ration, PASP: pulmonary artery systolic pressure, TAPSE: tricuspid annular plane systolic excursion.
DISCUSSION
HF patients with an indication for CRT are a well-defined group since they share multiple common features namely: symptomatic HF, significant cardiac dyssynchrony and impaired LVEF. These particularities provided an opportunity to study patients with a well-defined clinical phenotype and try to report new relevant clinical information. We focused on the RV-PA coupling, in its clinical correlations and in its ability to predict response to resynchronization.
The main findings of our study are the following: First, the demographic and clinical features of patients across RV-PA coupling spectrum did not differ significantly. In contrast, biochemical and echocardiographic biomarkers associated with worse prognosis in HF populations (increased NT-proBNP and increased E/e′ ratio) were related to impaired RV-PA coupling. Second, TAPSE/PASP ratio and PASP outperformed TAPSE in predicting the response to CRT; TAPSE/PASP ratio demonstrated the best discriminative power. Third, only PASP was independently associated with overall mortality in this group of HF patients. Forth, patients that improved their LVEF with CRT also showed improvement of right ventriculo-arterial coupling.
Patients with worse RV-PA coupling measured by TAPSE/PASP ratio exhibited a phenotype linked to worse prognosis characterized by lower hemoglobin levels, higher NT-proBNP and higher E/e′ ratio, which have all been associated to worse prognosis.23)24)25) Anemia in the HF setting, usually results from various mechanisms leading to decreased erythropoiesis26) and increased bleeding risk due to antithrombotic medications,25) signalling a more advanced HF status and increased patient frailty. The ability of NT-proBNP to predict response to CRT and 1-year adverse outcomes has been described previously.27) Patients with lower baseline NT-proBNP and with a greater reduction after CRT exhibit significant symptom improvement and the most favourable prognosis in follow-up.23)28)29) A higher E/e′ ratio reflects restrictive filling patterns and correlates negatively with symptoms and prognosis regardless of LVEF.30)31) Restrictive filling patterns are the consequence of chronic increase in load that leads to dilatation and stiffening of the myocardium.32) Likewise, higher E/e′ ratios are associated with impaired outcomes in the CRT population.33)
Indexes of RV dysfunction are major prognostic predictors of outcomes in the general HF population,5)6)7) but in patients undergoing CRT correlation between RV function and outcome remains uncertain.13) In the CARE-HF study CRT did not influence RV function measured by TAPSE,27) but in the MADIT-CRT trial34) CRT improved RV function measured by fractional area change and PASP reduction at rest. A subsequent systematic review concluded that the improvement in RV function parameters after CRT was a function of baseline characteristics and LVEF,35) while echocardiographic variables related with RV function, including TAPSE, strain, RV ejection fraction and RV fractional area change were not determinants of response to CRT.36) Likewise, we did not observe an association between TAPSE and the response rate to CRT in our study. Our data shows that baseline TAPSE as the weakest predictor of LVEF improvement compared to PASP and TAPSE/PASP. TAPSE alone might be insufficient because it's a regional parameter with angle-dependency and doesn't account for load conditions which are of critical importance to RV function.37)
The usefulness of the TAPSE/PASP ratio as an accurate surrogate marker of RV-PA coupling has emerged both in HF and in PH.5)6)16)18)19) In a recent work Tello et al.19) compared the TAPSE/PASP ratio to pressure-volume loops measurements acquired by right heart catheterization in a severe PH population. They confirmed the accuracy of this ratio as a surrogate marker of coupling and reported a TAPSE/PASP cutoff of 0.31 mm/mmHg to discriminate RV-arterial uncoupling. In the general HF population, a pivotal trial by Guazzi et al.18) found the TAPSE/PASP value of 0.36 mm/mmHg to be the best cut-off to identify patients at increased risk of adverse outcomes irrespective of LVEF. Despite these advances, the predictive value of the TAPSE/PASP ratio in the specific CRT population hasn't been previously explored. In our study, a cut-off value of 0.43 mm/mmHg demonstrated a good accuracy (AUC 0.76) to predict non-response in HF patients undergoing CRT.
CRT acts acutely on the reduction of cardiac dyssynchrony and chronically on ventricular remodeling inducing positive cardiac structural changes that normally translate into improved functional status. The beneficial effects of CRT in pulmonary hemodynamics and RV function depend on: 1. the ability to induce chronic positive remodeling, 2. the reduction of mitral regurgitation and of the backwards transmission of high pressures and 3. the reversibility of the alterations in pulmonary circulation. The extent of irreversible cardiac and pulmonary damage before CRT undoubtedly influences response, however, its assessment is particularly challenging by any single method.
Martens et al.38) studied the effects of CRT in patients with exercise-induced PH and found that CRT decreased pulmonary pressures and improved RV-PA coupling during exercise test 6 months after implantation, mainly due to the positive ventricular remodelling and a reduction in PASP. However, CRT did not influence TAPSE or TAPSE/PASP ratio at rest. In another recent study, a positive LV remodeling following 6 months after CRT was associated with better RV-PA coupling.39) Likewise, we report that a better RV-PA coupling is associated not only to CRT response but also to a continued improvement of the RV-PA coupling during follow-up. Contrarily, patients with impaired RV-PA coupling were less likely to respond to CRT. A worse RV-PA coupling might reflect both a significant adverse remodeling of the RV and a fixed increase in pulmonary vascular resistances. Clinically these means that these patients probably have irreversible structural damage and are less prone to benefit from CRT.
We observed a better predictive value with TAPSE/PASP for LVEF improvement, with a sensitivity and a specificity around 70%. This moderate discriminative ability indicates that the use of a single parameter will fall short to identify patients that will not benefit from CRT. Our data suggest that TAPSE/PASP ratio might be a useful descriptor to be added in a comprehensive clinical and echocardiographic evaluation of patients candidates to this treatment.
Regarding to outcomes, TAPSE/PASP wasn't significantly associated with all-cause mortality but correlated with robust prognostic surrogate markers in HF such as increased E/e′ ratio and NT-proBNP plasma concentrations. In contrast to TAPSE and TAPSE/PASP ratio, isolated baseline PASP independently predicted all-cause mortality in patients that received CRT.9)40) Our data build up on the bulk of evidence showing PASP as an invaluable prognostic marker in patients with HF.8)41)
Our study has limitations that should be considered. The retrospective nature, and the small sample size limit the internal and external validity of our conclusions. We only used data from patients with available PASP, TAPSE and follow-up LVEF (34% of our cohort), which make our dataset more vulnerable to selection bias. Lastly, we used TAPSE/PASP to assess RV-PA coupling. The gold-standard method to assess RV-PA coupling in clinical practice should use right heart catheterization and cardiac magnetic resonance. However, the echocardiographic-based TAPSE/PASP was already validated against the gold-standard that is costly and not feasible on a routine basis.
In conclusion, our study reinforces the usefulness of studying right heart and pulmonary circulation in patients with HF. TAPSE/PASP ratio is an easily obtained measure that provides a more comprehensive evaluation of the RV length/force relationship and has both pathophysiological and prognostic significance. In addition, it outperformed isolated PASP and TAPSE in identifying patients who did not respond to CRT.
 XML Download