

 PDF
PDF ePub
ePub Citation
 Print
Print


INTRODUCTION
MATERIALS AND METHODS
RESULTS
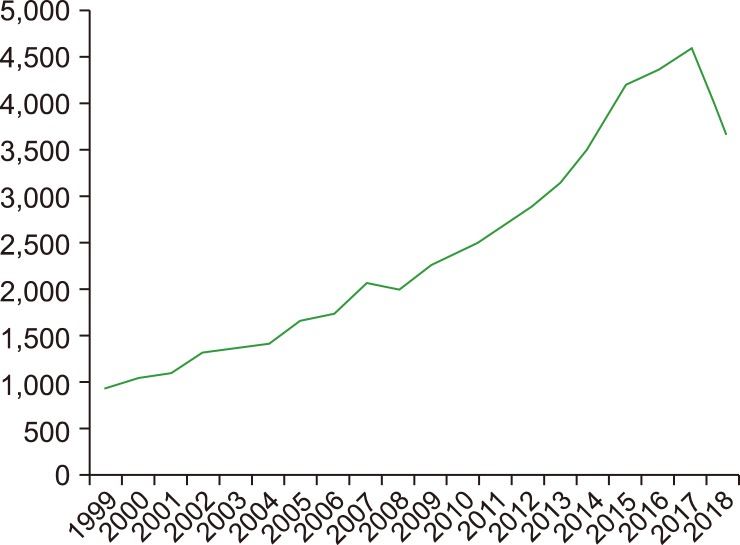
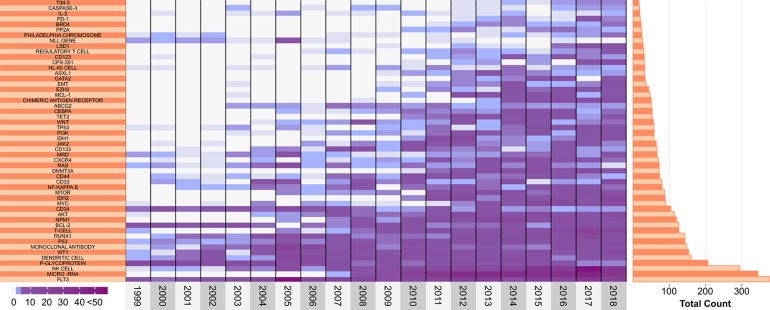
Analysis of the number of AML publications
Analysis of AML research that was externally funded
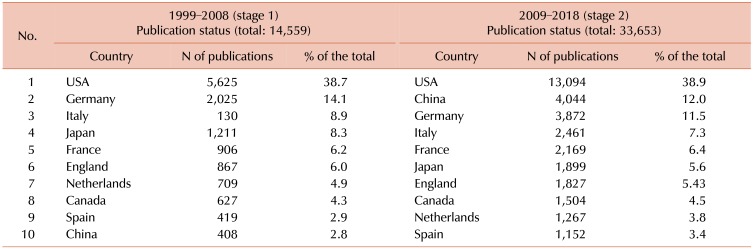
Table 1
Publication status of research funded by various agencies from 1999 to 2008 (stage 1) and from 2009 to 2018 (stage 2).
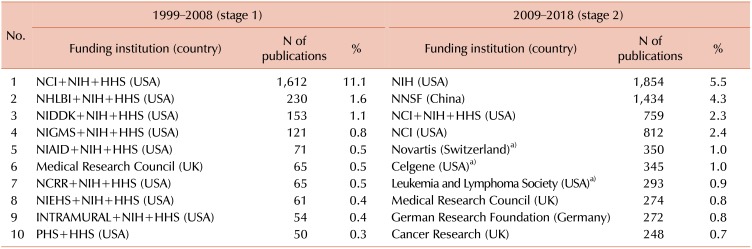
a)Based on the location of the headquarters.
Abbreviations: DFG, Deutsche Forschungsgemeinschaft (German Research foundation); HHS, Health and Human Services; IRP, Intramural Research Program; NCI, National Cancer Institute; NCRR, National Center for Research Resources; NHLBI, National Heart, Lung, and Blood Institute; NIAID, National Institute of Allergy and Infectious Diseases; NIDDK, National Institute of Diabetes and Digestive and Kidney Diseases; NIEHS, National Institute of Environmental Health Sciences; NIGMS, National Institute of General Medical Sciences; NIH, National Institutes of Health; NNSF, National Natural Science Foundation of China; PHS, Public Health Service.
![]()
Analysis of journals based on h-index
Table 2
Top 15 journals that published papers about acute myeloid leukemia from 1999 to 2018.
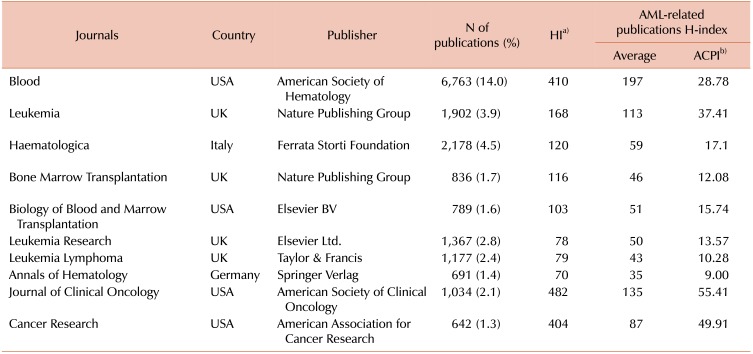
a)HI: the h-index value was based on a list of publications ranked in descending order by the Times Cited count. The h-index indicates that there are h papers that have been cited at least h times. The H-index score from the WoSCC (1999–2018).
b)Average citations per item (ACPI): ACPI is the average number of cited articles for all items in the resultset. It is the sum of the times cited divided by the number of results in the timespan (1999–2018) [24].
![]()
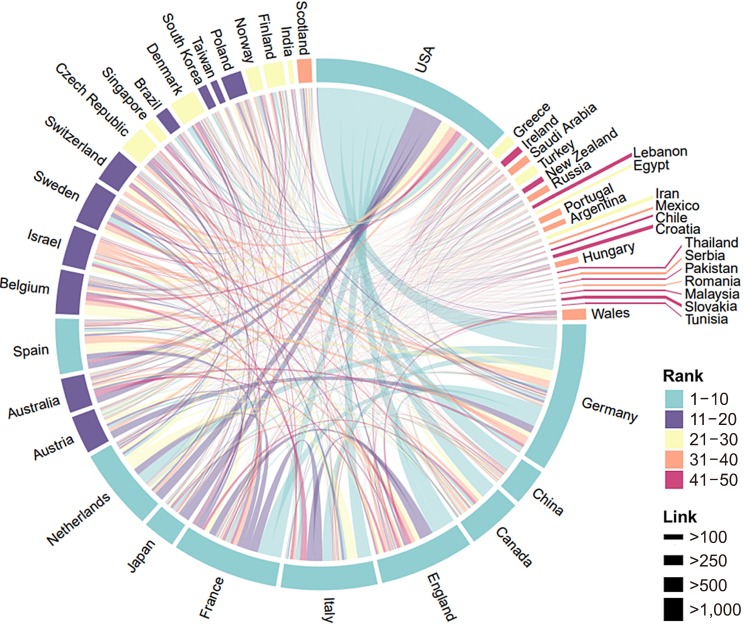
Analysis of the countries of publication
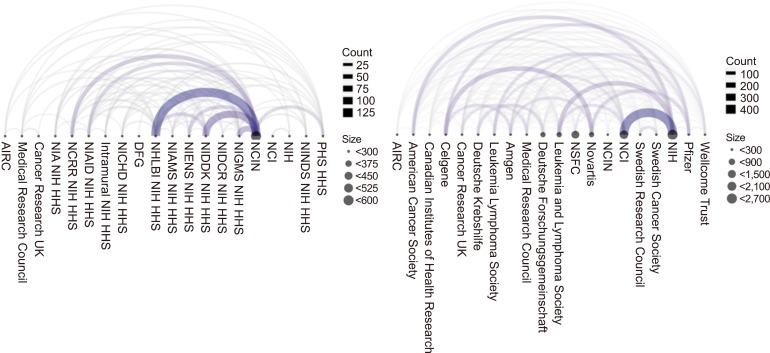
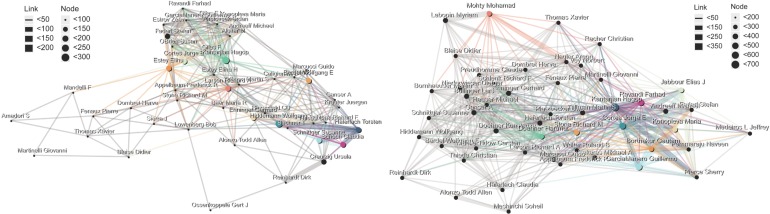
Network analysis of institutions and authors
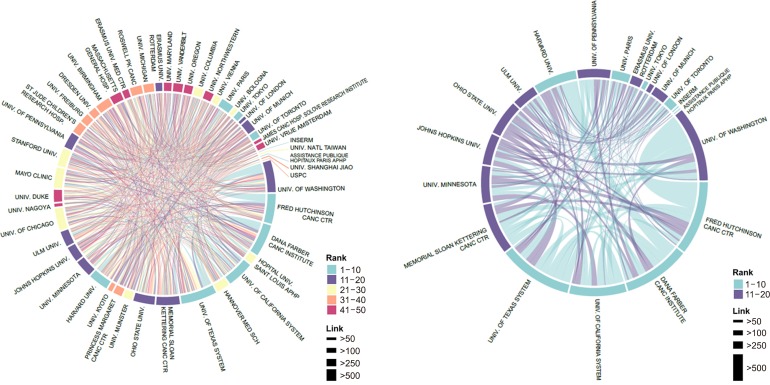 | Fig. 4Network mapping of the top 50 and 20 institutions that copublished publications related to acute myeloid leukemia from 1999 to 2018. *Government agencies (e.g., NIH, NCI, and MRC) were excluded from the analysis. The organization was unified as much as possible via machine learning.
|
Table 4
Top 10 active authors (affiliations) who published articles related to acute myeloid leukemia from 1999 to 2018 (centrality, eigen closeness data not shown).
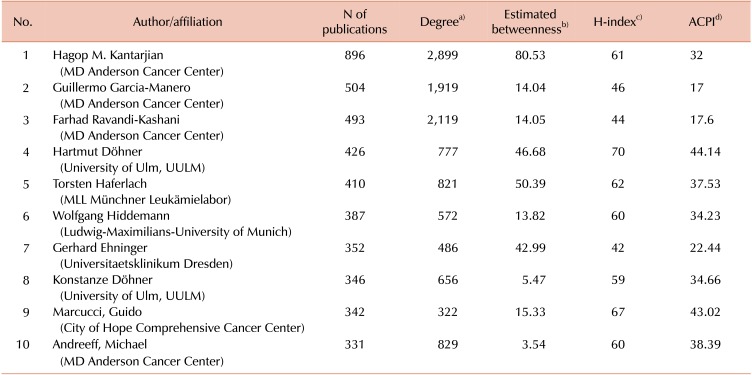
a)Degree: the degree of a vertex is its most basic structural property and the number of its adjacent edges.
b)Estimated betweenness: the vertex and edge betweenness are (roughly) defined by the number of geodesics (shortest paths) going through a vertex or an edge [16].
c)H-index: the h-index value is based on a list of publications ranked in descending order by the Times Cited count. An index of h indicates that there are h papers that have been cited at list h times.
d)Average citations per item (ACPI): this is the average number of cited articles for all items in the result set. It is the sum of the times cited divided by the number of results in the timespan [22].
![]()
 XML Download