Journal List > J Vet Sci > v.21(2) > 1144500

Perri, Poljak, Dewey, Harding, and O'Sullivan: A descriptive study of on-farm biosecurity and management practices during the incursion of porcine epidemic diarrhea into Canadian swine herds, 2014

Abstract

Porcine epidemic diarrhea virus (PEDV) emerged into Canada in January 2014, primarily affecting sow herds. Subsequent epidemiological analyses suggested contaminated feed was the most likely transmission pathway. The primary objective of this study was to describe general biosecurity and management practices implemented in PEDV-positive sow herds and matched control herds at the time the virus emerged. The secondary objective was to determine if any of these general biosecurity and farm management practices were important in explaining PEDV infection status from January 22, 2014 to March 1, 2014. A case herd was defined as a swine herd with clinical signs and a positive test result for PEDV. A questionnaire was used to a gather 30-day history of herd management practices, animal movements on/off site, feed management practices, semen deliveries and biosecurity practices for case (n = 8) and control (n = 12) herds, primarily located in Ontario. Data was analyzed using descriptive statistics and random forests (RFs). Case herds were larger in size than control herds. Case herds had more animal movements and non-staff movements onto the site. Also, case herds had higher quantities of pigs delivered, feed deliveries and semen deliveries on-site. The biosecurity practices of case herds were considered more rigorous based on herd management, feed deliveries, transportation and truck driver practices than control herds. The RF model found that the most important variables for predicting herd status were related to herd size and feed management variables. Nonetheless, predictive accuracy of the final RF model was 72%.

References

1. EFSA Panel on Animal Health and Welfare (AHAW). Scientific opinion on porcine epidemic diarrhoea and emerging porcine deltacoronavirus. EFSA J. 2014; 12:3877.
2. Stevenson GW, Hoang H, Schwartz KJ, Burrough ER, Sun D, Madson D, Cooper VL, Pillatzki A, Gauger P, Schmitt BJ, Koster LG, Killian ML, Yoon KJ. Emergence of Porcine epidemic diarrhea virus in the United States: clinical signs, lesions, and viral genomic sequences. J Vet Diagn Invest. 2013; 25:649–654.
crossref
3. Wang L, Byrum B, Zhang Y. New variant of porcine epidemic diarrhea virus, United States, 2014. Emerg Infect Dis. 2014; 20:917–919.
crossref
4. Pasick J, Berhane Y, Ojkic D, Maxie G, Embury-Hyatt C, Swekla K, Handel K, Fairles J, Alexandersen S. Investigation into the role of potentially contaminated feed as a source of the first-detected outbreaks of porcine epidemic diarrhea in Canada. Transbound Emerg Dis. 2014; 61:397–410.
crossref
5. Kim YK, Lim SI, Cho IS, Cheong KM, Lee EJ, Lee SO, Kim JB, Kim JH, Jeong DS, An BH, An DJ. A novel diagnostic approach to detecting porcine epidemic diarrhea virus: The lateral immunochromatography assay. J Virol Methods. 2015; 225:4–8.
crossref
6. Alvarez J, Goede D, Morrison R, Perez A. Spatial and temporal epidemiology of porcine epidemic diarrhea (PED) in the Midwest and Southeast regions of the United States. Prev Vet Med. 2016; 123:155–160.
crossref
7. Ayudhya SN, Assavacheep P, Thanawongnuwech R, Thanawongnuwech R. One world–one health: the threat of emerging swine diseases. an Asian perspective. Transbound Emerg Dis. 2012; 59(Suppl 1):9–17.
8. Pospischil A, Stuedli A, Kiupel M. Update on porcine epidemic diarrhea. J Swine Health Prod. 2002; 10:81–85.
9. Sasaki Y, Alvarez J, Sekiguchi S, Sueyoshi M, Otake S, Perez A. Epidemiological factors associated to spread of porcine epidemic diarrhea in Japan. Prev Vet Med. 2016; 123:161–167.
crossref
10. Dee S, Neill C, Clement T, Singrey A, Christopher-Hennings J, Nelson E. An evaluation of porcine epidemic diarrhea virus survival in individual feed ingredients in the presence or absence of a liquid antimicrobial. Porcine Health Manag. 2015; 1:9.
crossref
11. Opriessnig T, Xiao CT, Gerber PF, Zhang J, Halbur PG, Halbur P. Porcine epidemic diarrhea virus RNA present in commercial spray-dried porcine plasma is not infectious to naïve pigs. PLoS One. 2014; 9:e104766.
crossref
12. Perri AM, Poljak Z, Dewey C, Harding JCS, O'Sullivan TL. An epidemiological investigation of the early phase of the porcine epidemic diarrhea (PED) outbreak in Canadian swine herds in 2014: A case-control study. Prev Vet Med. 2018; 150:101–109.
crossref
13. Perri AM, Poljak Z, Dewey C, Harding JCS, O'Sullivan TL. Network analyses using case-control data to describe and characterize the initial 2014 incursion of porcine epidemic diarrhea (PED) in Canadian swine herds. Prev Vet Med. 2019; 162:18–28.
crossref
14. Pasma T, Furness MC, Alves D, Aubry P. Outbreak investigation of porcine epidemic diarrhea in swine in Ontario. Can Vet J. 2016; 57:84–89.
15. Chen X, Ishwaran H. Random forests for genomic data analysis. Genomics. 2012; 99:323–329.
crossref
16. Flori J, Mousing J, Gardner I, Willeberg P, Have P. Risk factors associated with seropositivity to porcine respiratory coronavirus in Danish swine herds. Prev Vet Med. 1995; 25:51–62.
crossref
17. Lambert ME, Arsenault J, Poljak Z, D'Allaire S. Epidemiological investigations in regard to porcine reproductive and respiratory syndrome (PRRS) in Quebec, Canada. Part 2: prevalence and risk factors in breeding sites. Prev Vet Med. 2012; 104:84–93.
crossref
18. Liaw A, Wiener M. Classification and regression by randomForest. R News. 2002; 2:18–22.
19. Kuhn M. Classification and Regression Training. [updated 2018;cited 2018 September 19]. Available from:. https://cran.r-project.org/web/packages/caret/caret.pdf.
20. Paluszyńska A. Understanding Random Forests with randomForestExplainer. [updated 2017;cited 2018 September 19]. Available from:. https://cran.rstudio.com/web/packages/randomForestExplainer/vignettes/randomForestExplainer.html.
21. Jung K, Saif LJ. Porcine epidemic diarrhea virus infection: Etiology, epidemiology, pathogenesis and immunoprophylaxis. Vet J. 2015; 204:134–143.
crossref
22. United States Department of Agriculture Economics, Statistics and Market Information System. Overview of the United States Hog Industry. [updated 2015;cited 2018 October 1]. Available from:. http://usda.mannlib.cornell.edu/usda/current/hogview/hogview-10-29-2015.pdf.
23. Ojkic D, Hazlett M, Fairles J, Marom A, Slavic D, Maxie G, Alexandersen S, Pasick J, Alsop J, Burlatschenko S. The first case of porcine epidemic diarrhea in Canada. Can Vet J. 2015; 56:149–152.
24. Lowe J, Gauger P, Harmon K, Zhang J, Connor J, Yeske P, Loula T, Levis I, Dufresne L, Main R. Role of transportation in spread of porcine epidemic diarrhea virus infection, United States. Emerg Infect Dis. 2014; 20:872–874.
crossref
25. Casanova LM, Jeon S, Rutala WA, Weber DJ, Sobsey MD. Effects of air temperature and relative humidity on coronavirus survival on surfaces. Appl Environ Microbiol. 2010; 76:2712–2717.
crossref
26. Strobl C, Boulesteix AL, Zeileis A, Hothorn T. Bias in random forest variable importance measures: illustrations, sources and a solution. BMC Bioinformatics. 2007; 8:25.
crossref

Fig. 1.
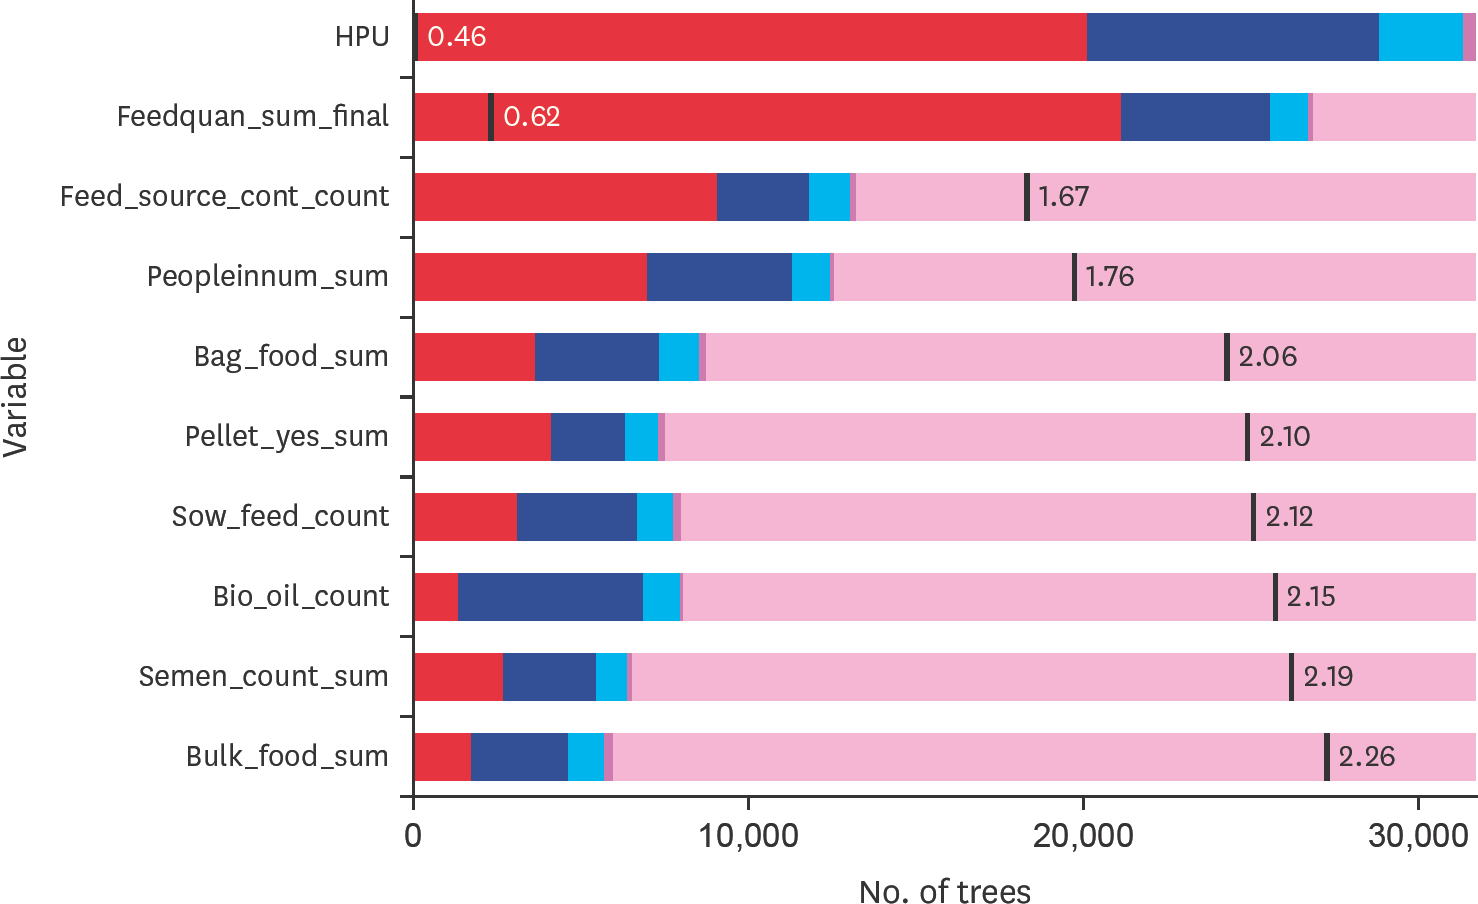
The distribution and mean minimal depth for the top variables for predicting porcine epidemic diarrhea virus during the incursion of the virus in Canadian swine herds, 2014. The vertical black line represents the mean minimal depth. The x-axis ranges from zero to 30 000 trees in which is the maximum any variable was used for splitting on X j. Variable HPU is the only variable that reaches the maximum number of trees. HPU, heat producing unit.
jvs-21-e25f1.tif
Fig. 2.
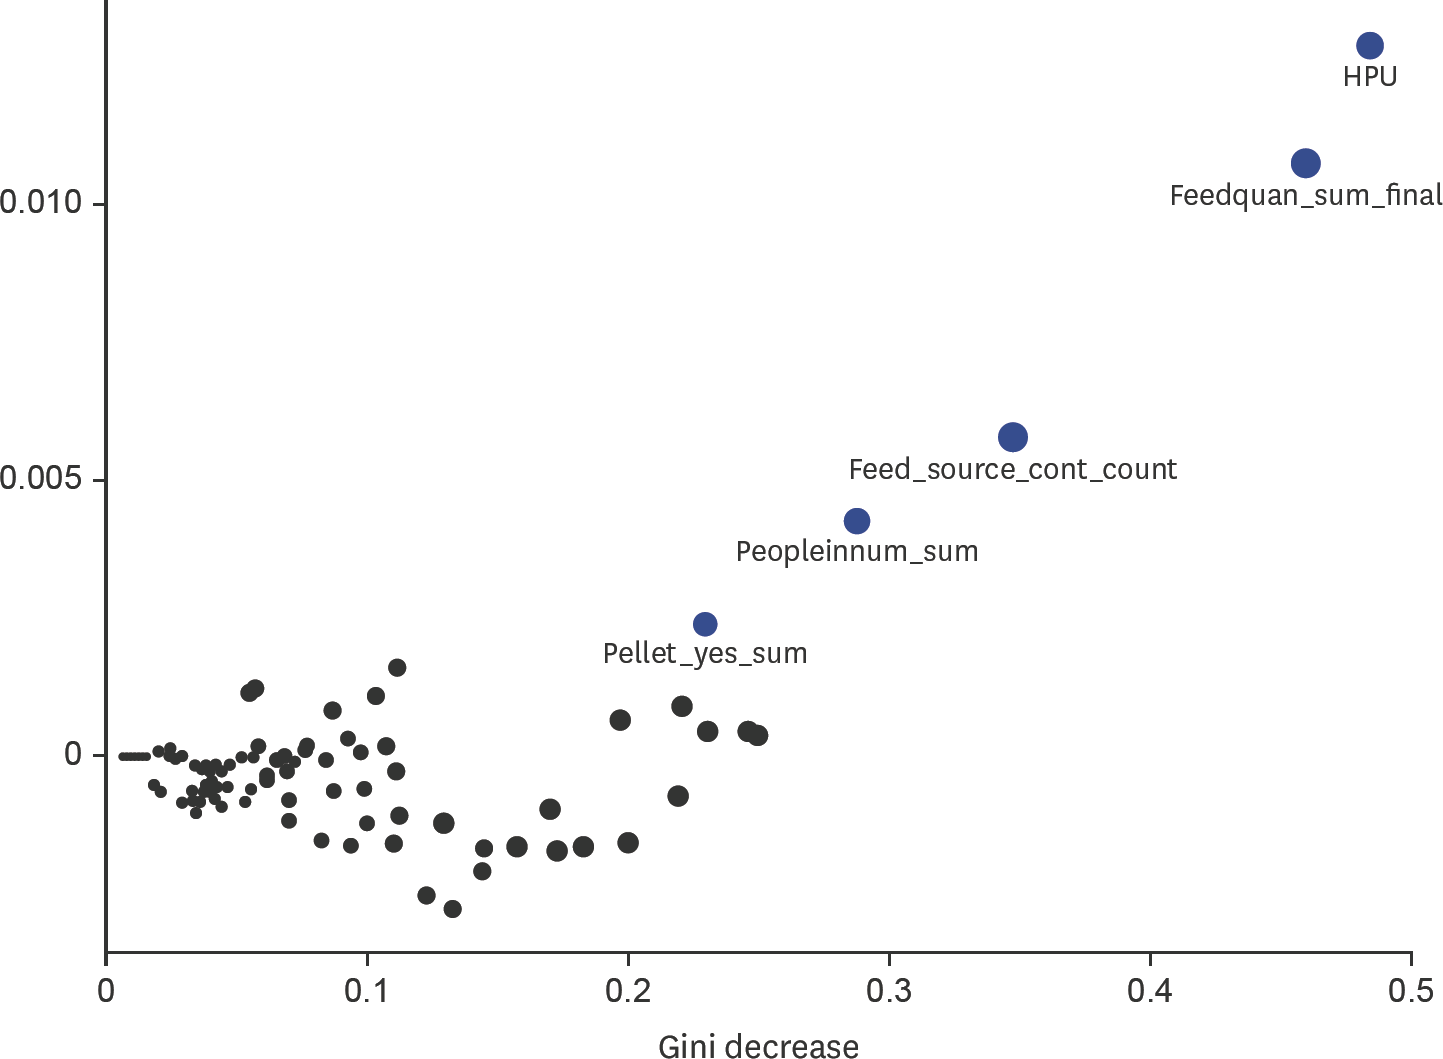
Multi-importance plot using the accuracy decrease, Gini decrease and number of times as a root node to visually identify variables for predicting porcine epidemic diarrhea virus during the incursion of the virus in Canadian swine herds using random forests. The blue circles represent the top variables (most important) for predicting herd status (case versus control herd) and the black variables are the remaining variables using in the random forest model. HPU, heat producing unit.
jvs-21-e25f2.tif
Table 1.
The number and distance* of nearby herds from PED-affected and non-PED-affected Canadian swine herds
Variables Proportion of case herds (n = 8) Proportion of control herds (n = 12)
Number of herds within a 3-km radius
0 2/8 (0.25) 1/12 (0.08)
1–3 2/8 (0.25) 7/12 (0.58)
> 3 4/8 (0.50) 4/12 (0.33)
Number of herds within a 3-km radius (same ownership)
0 4/8 (0.50) 6/12 (0.50)
1 3/8 (0.38) 2/12 (0.17)
2–3 1/8 (0.13) 4/12 (0.33)
Distance to nearest herd (km)
≤ 0.5 3/8 (0.38) 4/12 (0.33)
> 0.5 and ≤ 1.5 2/8 (0.25) 6/12 (0.50)
> 1.5 3/8 (0.38) 2/12 (0.17)
Distance to nearest herd (same ownership) (km)
≤ 0.25 6/8 (0.75) 6/12 (0.50)
> 0.25 and ≤ 1.0 1/8 (0.13) 3/12 (0.25)
> 1.0 1/8 (0.13) 3/12 (0.25)

PED, porcine epidemic diarrhea.* Distance to herds were measured in kilometers (km);

PED-affected and non-affected herds were selected from the case-control study conducted by Perri et al. [20]. PED-affected herds were confirmed positive using real-time reverse, transcriptase polymerase chain reaction. The study period for recruiting PED-affected and non-affected herds was from January 22, 2014 to March 1, 2014.

Table 2.
The number of buildings by pig flow for PED-affected and non-PED-affected* Canadian swine herds
Variables Proportion of case herds (n = 8) Proportion of control herds (n = 12)
Pig flow for nursery pigs
All-in/all-out by building 1/8 (0.13)
All-in/all-out by room 4/8 (0.50) 8/12 (0.67)
Continuous flow 1/8 (0.13) 1/12 (0.08)
Pig flow for finisher pigs
All-in/all-out by building 1/8 (0.13) 1/12 (0.08)
All-in/all-out by room 1/8 (0.13) 1/12 (0.08)
Continuous flow 2/8 (0.25) 3/12 (0.25)
Gilts in isolation/acclimation
Continuous flow 3/8 (0.38) 3/12 (0.25)
Gilts in main herd
Continuous flow 4/8 (0.50) 8/12 (0.67)

PED, porcine epidemic diarrhea.

* PED-affected and non-affected herds were selected from the case-control study conducted by Perri et al. [20]. PED-affected herds were confirmed positive using real-time reverse, transcriptase polymerase chain reaction. The study period for recruiting PED-affected and non-affected herds was from January 22, 2014 to March 1, 2014.

Table 3.
The quantity and frequency of pigs and pig movements on- and off-site by production class identified in PED-affected and non-PED-affected* Canadian swine herds
Variables Case herds (n = 8) Control herds (n = 12)
Mean ± SD Median (IQR) Range Total observations Mean ± SD Median (IQR) Range Total observations
Total on/off site Movements 9.9 ± 5.4 7.0 (10.5) 5–17 79 6.9 ± 3.8 7.0 (5.0) 0–13 83
Pigs Off-site movements 3,678.3 ± 4,298.8 1,284.0 (5,656.0) 120–11,708 29,426 1,436.7 ± 1,091.9 1,074.5 (1,704.5) 0–3,187 7 17,061
Total pig movements 8.4 ± 3.8 6.5 (6.0) 5–15 67 6.5 ± 3.7 6.5 (4.0) 0–12 78
Quantity of pigs 3,619.4 ± 4,204.3 1,268.5 (5,556.0) 120–11,468 28,955 1,421.8 ± 1,179.5 1,100.0 (1,796.0) 0–3,391 1 20,452
Cull sows 2.0 ± 1.6 2.0 (3.0) 0–4 16 1.5 ± 1.5 1.5 (3.0) 0–4 18
Mature gilts 1.5 ± 2.5 0 (3.0) 0–6 13 0.4 ± 0.5 0 (1.0) 0–1 5
Young gilts 0.13 ± 0.35 0 (0) 0–1 1
Nursery pigs 2.4 ± 3.3 0.5 (5.0) 0–9 19 1.6 ± 2.7 0.5 (2.0) 0–9 19
Grower pigs 1.9 ± 3.7 0 (2.5) 0–10 15 1.1 ± 2.0 0 (1.5) 0–6 13
Market hogs 1.75 ± 2.4 0 (4.5) 0–5 14 2.0 ± 3.0 0 (5.0) 0–8 24
On-site                
Total pig movements 1.5 ± 2.5 0 (3.0) 0–6 12 0.4 ± 0.5 0 (1.0) 0–1 5
Quantity of pigs 58.9 ± 100.6 0 (115.5) 0–240 471 14.9 ± 19.6 0 (35.0) 0–49 179
Mature gilts 1.2 ± 2.4 0 (1) 0–6 12 0.4 ± 0.5 0 (1) 0–1 5
Nursery pigs 0.6 ± 1.5 0 (0) 0–4 8 0.3 ± 1.2 0 (0) 0–4 4
Grower pigs 0.1 ± 0.3 0 (0) 0–1 1
Movements using                
Site owned transportation 4.0 ± 5.0 2.5 (6.5) 0–14 32 4.2 ± 3.8 5 (6) 0–12 50
Contracted transportation 2.0 ± 3.3 0.5 (3.0) 0–9 16 1.1 ± 2.1 0 (1) 0–6 13

PED, porcine epidemic diarrhea; SD, standard deviation; IQR, interquartile range.

* PED-affected and non-affected herds were selected from the case-control study conducted by Perri et al. [20]. PED-affected herds were confirmed positive using real-time reverse, transcriptase polymerase chain reaction. The study period for recruiting PED-affected and non-affected herds was from January 22, 2014 to March 1, 2014.

Table 4.
The biosecurity protocols of trailers and truck drivers when pigs were delivered on site PED-affected and non-PED-affected* Canadian swine herds
Variables Proportion of case herds (n = 8) Proportion of control herds (n = 12)
Trailers
Washed and disinfected 3/8 (0.38) 4/12 (0.33)
Not washed 1/12 (0.08)
Dedicated to transporting pigs within the same system only 1/12 (0.08)
Used to transport pigs between pig sources and this site within the system 2/8 (0.25)
Not dedicated to the site 1/8 (0.13) 3/12 (0.25)
Truck drivers
Helped unload the pigs but did not enter barn, and stepped on the laneway 3/8 (0.38) 2/12 (0.17)
Stayed in the cabin 1/12 (0.08)
Helped unload pigs, entered barn and stepped on laneway 1/12 (0.08)
Truck drivers helped unload the pigs but did not enter barn 1/12 (0.08)

PED, porcine epidemic diarrhea.

* PED-affected and non-affected herds were selected from the case-control study conducted by Perri et al. [20]. PED-affected herds were confirmed positive using real-time reverse, transcriptase polymerase chain reaction. The study period for recruiting PED-affected and non-affected herds was from January 22, 2014 to March 1, 2014.

Table 5.
The biosecurity protocols of trailers and truck drivers when pigs were delivered off site PED-affected and non-PED-affected* Canadian swine herds
Variables Proportion of case herds (n = 8) Proportion of control herds (n = 12)
Trailers
Washed and disinfected 5/8 (0.63) 5/12 (0.42)
Not washed 5/12 (0.42)
Contained pigs from other pig sites within the production system 2/8 (0.25)
Truck drivers
Helped unload the pigs, stepped on laneway but did not enter barn 7/8 (0.88) 6/12 (0.50)
Helped unload pigs, entered barn and stepped on laneway 3/12 (0.25)
Stayed in the cabin 1/12 (0.08)

PED, porcine epidemic diarrhea.

* PED-affected and non-affected herds were selected from the case-control study conducted by Perri et al. [20]. PED-affected herds were confirmed positive using real-time reverse, transcriptase polymerase chain reaction. The study period for recruiting PED-affected and non-affected herds was from January 22, 2014 to March 1, 2014.

Table 6.
The biosecurity protocols of staff and non-staff members on site PED-affected and non-PED-affected* Canadian swine herds
Variables Proportion of case herds (n = 8) Proportion of control herds (n = 12)
Staff members
Visited another swine site prior to this site 1/8 (0.13) 3/12 (0.25)
Visitors
Visited another swine site prior to this site 1/8 (0.13) 1/12 (0.08)
Brought their own equipment to the farm 4/8 (0.50) 3/12 (0.25)
Had downtime before visiting the farm (if visited a different farm prior) 2/8 (0.25) 1/12 (0.08)
Staff members and visitors
Wore barn boots dedicated to the farm 7/8 (0.88) 12/12 (1.00)
Wore coveralls dedicated to the farm 7/8 (0.88) 10/12 (0.83)
Showered-in 7/8 (0.88) 7/12 (0.58)
Danish entry 4/8 (0.50) 7/12 (0.58)
Must wash their hands while arriving on site 2/8 (0.25) 4/12 (0.33)

PED, porcine epidemic diarrhea.

* PED-affected and non-affected herds were selected from the case-control study conducted by Perri et al. [20]. PED-affected herds were confirmed positive using real-time reverse, transcriptase polymerase chain reaction. The study period for recruiting PED-affected and non-affected herds was from January 22, 2014 to March 1, 2014.

Table 7.
Descriptive feed deliveries and storage practices on farm for PED-affected and non-PED-affected* Canadian swine herds
Variables Case herds (n = 8) Control herds (n = 12)
Mean ± SD Median (IQR) Range Total Mean ± SD Median (IQR) Range Total
Quantity of feed delivered
Total quantity of feed (tonnes) 272.8 ± 219.3 251.7 (281.6.7) 11.9–672.2 2,183.1 70.5 ± 63.5 58.4 (84.6) 0–201.8 846.2
Feed deliveries on-site
Pelleted feed 2.6 ± 2.2 2.5 (2.5) 0–7 21 2.1 ± 4.3 0 (2.5) 0–15 25
Non-pelleted feed 3.5 ± 4.6 2.0 (5.5) 0–13 28 4.4 ± 4.5 3.0 (7.5) 0–14 53
Bagged feed 4.0 ± 3.8 3.0 (5.5) 0–11 32 1.6 ± 2.3 0.5 (3.0) 0–7 19
Bulk feed 7.5 ± 8.1 5.0 (13.0) 0–22 60 8.1 ± 5.6 7.5 (8.5) 0–18 97
Feed deliveries on-site by production
Sow feed 1.6 ± 3.5 0 (1.5) 0–10 13 2.8 ± 3.0 2.0 (4.0) 0–10 34
Nursing sow feed 0.5 ± 1.4 0 (0) 0–4 4 0.08 ± 0.3 0 (0) 0–1 1
Creep feed 1.8 ± 2.5 0.5 (3.0) 0–7 14 0.5 ± 0.8 0 (1.0) 0–2 6
Dry nursing feed 0.9 ± 1.1 0.5 (1.5) 0–3 7 0.5 ± 0.7 0 (1.0) 0–2 6
Dry nursery feed 4.6 ± 5.4 3.5 (7.0) 0–16 37 3.5 ± 4.0 2.5 (5.5) 0–11 42
Liquid nursery feed 0.9 ± 2.5 0 (0) 0–7 7 0.08 ± 0.3 0 (0) 0–1 1
Dry grower feed 1.3 ± 0.3 0 (0) 0–1 1 0.7 ± 1.3 0 (1.0) 0–4 8
Liquid grower feed 0.6 ± 1.8 0 (0) 0–5 5
Dry finisher feed 0.3 ± 0.7 0 (0) 0–2 2 0.7 ± 1.3 0 (1.0) 0–4 8
Liquid finisher feed 1.0 ± 2.8 0 (0) 0–8 8
Feed storage based on feed deliveries
Stored inside the farm in a cold area 2.3 ± 2.9 0.5 (5.0) 0–7 18 2.8 ± 7.1 0 (1.5) 0–25 33
Stored inside the farm in a warm area 0.3 ± 0.7 0 (0) 0–2 2 0.08 ± 0.3 0 (0) 0–1 1
Stored outside the farm in bin 3.4 ± 5.6 0.5 (5.0) 0–16 27 5.5 ± 5.5 3.5 (7.0) 0–16 66
Feed delivered by
Contracted transportation companies 10.4 ± 8.7 7.0 (9.5) 3–29 83 8.5 ± 7.4 7.0 (10.5) 0–25 102

PED, porcine epidemic diarrhea; SD, standard deviation; IQR, interquartile range.

* PED-affected and non-affected herds were selected from the case-control study conducted by Perri et al. [20]. PED-affected herds were confirmed positive using real-time reverse, transcriptase polymerase chain reaction. The study period for recruiting PED-affected and non-affected herds was from January 22, 2014 to March 1, 2014.

Table 8.
Feed mixing practices of PED-affected and non-PED-affected* Canadian swine herds
Variables Proportion of case herds (n = 8) Proportion of control herds (n = 12)
Feed is mixed
Solely for pigs on the site 4/8 (0.50) 6/12 (0.50)
Mixed on site and distributed for pigs off site 1/8 (0.13) 2/12 (0.17)
Feed is not mixed
Not mixed on-site 3/8 (0.38) 4/12 (0.33)

PED, porcine epidemic diarrhea.

* PED-affected and non-affected herds were selected from the case-control study conducted by Perri et al. [20]. PED-affected herds were confirmed positive using real-time reverse, transcriptase polymerase chain reaction. The study period for recruiting PED-affected and non-affected herds was from January 22, 2014 to March 1, 2014.

TOOLS
Similar articles