Journal List > J Vet Sci > v.21(2) > 1144494

Lee, Choi, and Kim: Relationship between the values of blood parameters and physical status in Korean native calves with diarrhea

Abstract

Dehydration, electrolyte disturbance, and acid-base imbalance are the most significant consequences of diarrhea in calves. We aimed to determine blood gas, hematological, electrolyte, and biochemical values and investigate the relationship between the physical status and blood parameters in Korean native calves (KNCs) with diarrhea. One hundred eighty KNCs with diarrhea (age < 75 days) were investigated. Blood samples were collected from the external jugular vein and analyzed using a portable clinical blood gas analyzer. The measured parameters were statistically compared according to the status of physical activity, dehydration, or prognosis. The mean values of parameters in the Calves with diarrhea showed metabolic acidosis, hyponatremia, and azotemia. The mean values of potassium, chloride, hematocrit, and hemoglobin were in the upper limit of their reference ranges. More than 75% of the calves had metabolic acidosis caused by bicarbonate loss, and 63.6% had high blood urea nitrogen (BUN) values. Moreover, BUN showed the highest correlation with the physical activity status and dehydration. pH, base excess of the extracellular fluid (BE), anion gap, potassium, hematocrit, bicarbonate, and hemoglobin were closely correlated with physical deterioration and dehydration (p < 0.001). BUN, pH, BE, and anion gap were closely correlated with physical deterioration and dehydration. These correlations between clinical symptoms and blood gas parameters can be clinically relevant in predicting the status of parameters according to clinical symptoms.

References

1. Omole OO, Nappert G, Naylor JM, Zello GA. Both L- and D-lactate contribute to metabolic acidosis in diarrheic calves. J Nutr. 2001; 131:2128–2131.
crossref
2. Gunn AA, Naylor JA, House JK. Diarrhea. Smith BP, editor. (ed.).Large Animal Internal Medicine. 4th ed.pp.p. 340–363. Mosby;St Louis: 2009.
3. Torsein M, Lindberg A, Sandgren CH, Waller KP, Törnquist M, Svensson C. Risk factors for calf mortality in large Swedish dairy herds. Prev Vet Med. 2011; 99:136–147.
crossref
4. Bleul U, Götz E. Evaluation of the i-STAT portable point-of-care analyzer for determination of blood gases and acid-base status in newborn calves. J Vet Emerg Crit Care (San Antonio). 2014; 24:519–528.
crossref
5. Kim D, Lyoo YS, Lyoo HS, Yoon CK. Etiology and clinical aspects of diarrhea of Korean native calves during the suckling period. Korean J Vet Res. 1990; 30:255–260.
6. Hur TY, Jung YH, Choe CY, Cho YI, Kang SI, Lee HJ, Ki KS, Baek KS, Suh GH. The dairy calf mortality: the causes of calf death during ten years at a large dairy farm in Korea. Korean J Vet Res. 2013; 53:103–108.
crossref
7. Trefz FM, Lorch A, Feist M, Sauter-Louis C, Lorenz I. Metabolic acidosis in neonatal calf diarrhea-clinical findings and theoretical assessment of a simple treatment protocol. J Vet Intern Med. 2012; 26:162–170.
crossref
8. Lim KG, Kang MI, Kim SK, Nam KW, Park HJ, Park JR, Cho KO, Lee BJ. Identification and characterization of Shiga toxin-producing Escherichia coli isolated from diarrhea in calves. Korean J Vet Res. 2006; 46:135–142.
9. Fayet JC, Overwater J. Prognosis of diarrhoea in the newborn calf: statistical analysis of blood biochemical data. Ann Rech Vet. 1978; 9:55–61.
10. Bardell D, West E, Mark Senior J. Evaluation of a new handheld point-of-care blood gas analyser using 100 equine blood samples. Vet Anaesth Analg. 2017; 44:77–85.
crossref
11. Iwabuchi S, Suzuki K, Abe I, Asano R. Comparison of the effects of isotonic and hypertonic sodium bicarbonate solutions on acidemic calves experimentally induced by ammonium chloride administration. J Vet Med Sci. 2003; 65:1369–1371.
crossref
12. Sayers RG, Kennedy A, Krump L, Sayers GP, Kennedy E. An observational study using blood gas analysis to assess neonatal calf diarrhea and subsequent recovery with a European Commission-compliant oral electrolyte solution. J Dairy Sci. 2016; 99:4647–4655.
crossref
13. Naylor JM. Severity and nature of acidosis in diarrheic calves over and under one week of age. Can Vet J. 1987; 28:168–173.
14. Peiró JR, Borges AS, Gonçalves RC, Mendes LC. Evaluation of a portable clinical analyzer for the determination of blood gas partial pressures, electrolyte concentrations, and hematocrit in venous blood samples collected from cattle, horses, and sheep. Am J Vet Res. 2010; 71:515–521.
crossref
15. Izzo MM, Kirkland PD, Mohler VL, Perkins NR, Gunn AA, House JK. Prevalence of major enteric pathogens in Australian dairy calves with diarrhoea. Aust Vet J. 2011; 89:167–173.
crossref
16. Constable PD, Walker PG, Morin DE, Foreman JH. Clinical and laboratory assessment of hydration status of neonatal calves with diarrhea. J Am Vet Med Assoc. 1998; 212:991–996.
17. Lee S, Ok S, Kwon H, Kim D. Arterial and venous blood gas, electrolytes, biochemical and hematological values in healthy Korean native calves. J Vet Clin. 2015; 32:499–503.
crossref
18. Constable PD, Hinchcliff KW, Done SH, Grünberg W. Veterinary Medicine: A Textbook of the Diseases of Cattle, Horses, Sheep, Pigs, and Goats. 11th ed.pp.p. 384–409. Elsevier;St Louis: 2017.
19. Klein P, Kleinová T, Volek Z, Simů nek J. Effect of Cryptosporidium parvum infection on the absorptive capacity and paracellular permeability of the small intestine in neonatal calves. Vet Parasitol. 2008; 152:53–59.
crossref
20. Naylor JM. A retrospective study of the relationship between clinical signs and severity of acidosis in diarrheic calves. Can Vet J. 1989; 30:577–580.
21. Aldridge BM, Garry FB, Adams R. Neonatal septicemia in calves: 25 cases (1985–1990). J Am Vet Med Assoc. 1993; 203:1324–1329.
22. Abutarbush SM, Petrie L. Treatment of hypernatremia in neonatal calves with diarrhea. Can Vet J. 2007; 48:184–187.
23. Constable PD, Grünberg W. Hyperkalemia in diarrheic calves: implications for diagnosis and treatment. Vet J. 2013; 195:271–272.
crossref
24. Hendrix CM, Sirois M. Laboratory Procedures for Veterinary Technicians. 5th ed.p. 416, Kansas: Mosby, St. Louis;2007.
25. Trefz FM, Feist M, Lorenz I. Hypoglycaemia in hospitalised neonatal calves: Prevalence, associated conditions and impact on prognosis. Vet J. 2016; 217:103–108.
crossref

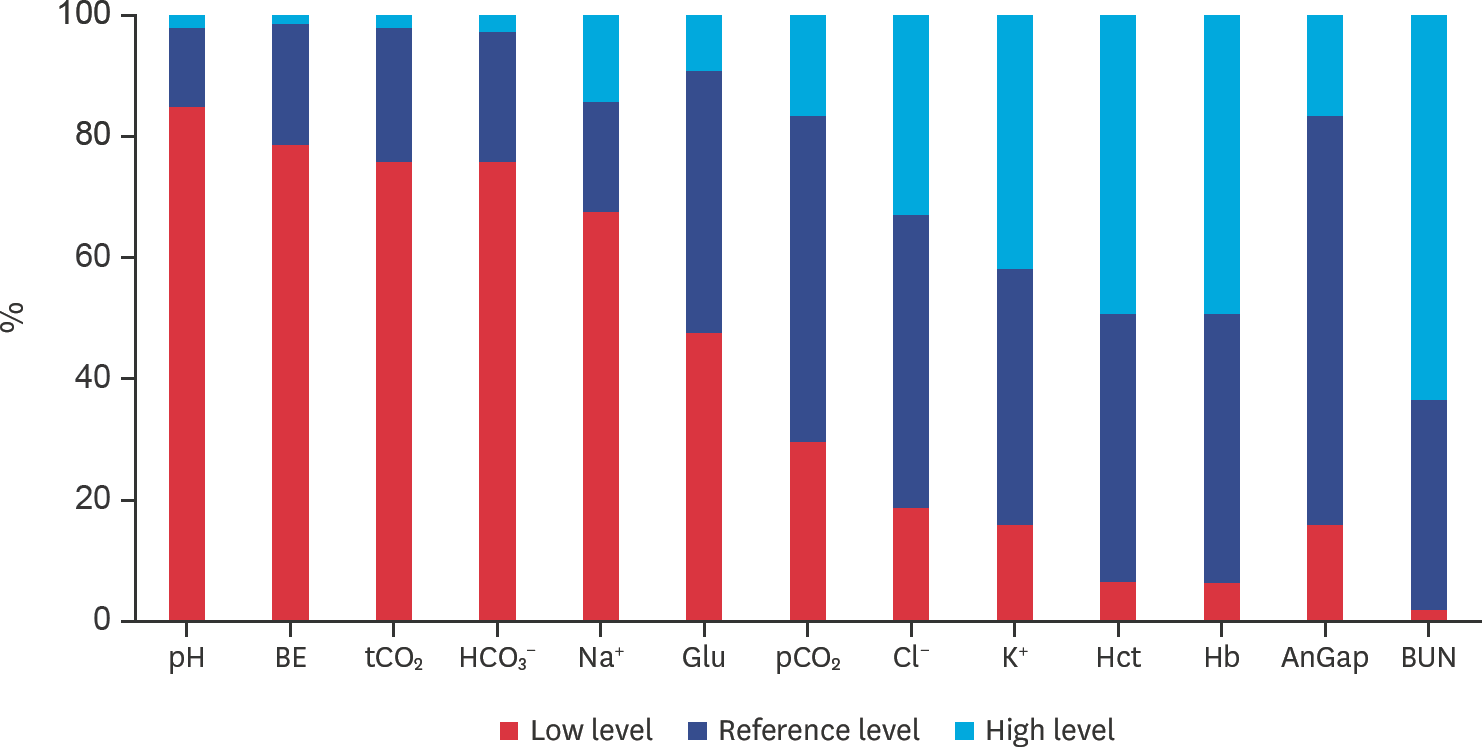
Fig. 1.
Distribution of Korean native calves with diarrhea according to the levels of blood parameters (reference range, low, and high) (n = 180). BE, base excess of carbon dioxide; tCO2, total carbon dioxide; HCO3, bicarbonate; Na+, sodium; Glu, glucose; pCO2, partial pressure of carbon dioxide; Cl, chloride; K+, potassium; Hct, hematocrit; Hb, hemoglobin; AnGap, anion gap; BUN, blood urea nitrogen.
jvs-21-e17f1.tif
Table 1.
The blood parameters measured in Korean native calves with diarrhea (n = 180)
Blood values Number Mean ± SD (Min–Max) Reference range
Na+ (mmol/L) 180 132.52 ± 10.56 (104.0–167.0) 136.5–142.4
K+ (mmol/L) 180 5.55 ± 1.54 (2.0–9.0) 4.1–5.6
Cl (mmol/L) 172 103.06 ± 10.96 (75.0–140.0) 94.5–105.2
tCO2 (mmol/L) 180 19.34 ± 8.49 (5.0–40.0) 25.3–35.4
2 BUN (mg/dL) 176 58.99 ± 44.82 (4.0–140.0) 6.0–30.0
Glu (mg/dL) 180 103.96 ± 66.78 (20.0–700.0) 95.1–161.0
Hct (%) 180 36.03 ± 7.53 (10.0–59.0) 24.3–36.6
pH 180 7.19 ± 0.17 (6.6–7.6) 7.35–7.48
pCO2 (mmHg) 180 43.50 ± 12.64 (18.0–94.9) 36.9–54.6
HCO3 (mmol/L) 179 18.10 ± 8.29 (3.7–38.3) 24.0–33.9
BE (mmol/L) 180 −10.13 ± 10.68 (−30.0–13.0) −1.4–10.0
AnGap (mmol/L) 168 16.65 ± 4.61 (7.0–32.0) 10.7–20.3
Hb (g/dL) 180 12.30 ± 2.65 (3.4–21.6) 8.3–12.5

SD, standard deviation; BE, base excess of the extracellular fluid; tCO2, total carbon dioxide, HCO3

bicarbonate; Na

+ sodium; Glu, glucose; pCO2, partial pressure of carbon dioxide; Cl

chloride; K

+ potassium; Hct, hematocrit; Hb, hemoglobin; AnGap, anion gap; BUN, blood urea nitrogen.

Table 2.
Changes in blood parameter values according to the physical activity status (n = 180)
Blood values Bright (n = 15) Dull (n = 67) Dummy (n = 58) Coma (n = 40) F-value p value
Na+ (mmol/L) 133.13 ± 4.76 131.06 ± 8.25 133.45 ± 13.16 133.38 ± 11.37 0.678 0.567
K+ (mmol/L) 4.81 ± 0.86 5.13 ± 0.96 5.64 ± 1.65 6.41 ± 1.94 7.847 < 0.001
Cl (mmol/L) 100.40 ± 3.00 100.20 ± 7.79 105.22 ± 13.09 106.11 ± 13.08 3.606 0.015
tCO2 (mmol/L) 22.93 ± 4.22 22.10 ± 7.15 18.31 ± 8.90 14.85 ± 9.05 8.140 < 0.001
BUN (mg/dL) 18.53 ± 11.90 41.02 ± 33.63 69.38 ± 45.74 90.05 ± 43.35 19.596 < 0.001
Glu (mg/dL) 130.27 ± 51.85 101.18 ± 25.94 104.09 ± 64.45 98.58 ± 109.49 0.900 0.443
Hct (%) 31.20 ± 6.45 34.43 ± 6.44 36.26 ± 7.15 40.18 ± 8.32 7.953 < 0.001
pH 7.25 ± 0.10 7.26 ± 0.12 7.20 ± 0.16 7.05 ± 0.19 17.276 < 0.001
pCO2 (mmHg) 48.96 ± 9.59 44.54 ± 9.36 40.11 ± 11.18 44.63 ± 18.37 2.653 0.050
HCO3 (mmol/L) 21.56 ± 4.15 20.80 ± 7.00 17.08 ± 8.68 13.67 ± 8.85 8.098 < 0.001
BE (mmol/L) −5.67 ± 5.45 −6.30 ± 8.68 −11.00 ± 10.99 −16.95 ± 11.29 10.841 < 0.001
AnGap (mmol/L) 16.07 ± 2.66 14.97 ± 3.35 17.29 ± 4.78 19.68 ± 4.79 10.341 < 0.001
Hb (g/dL) 10.61 ± 2.19 11.70 ± 2.19 12.33 ± 2.43 13.89 ± 3.10 8.957 < 0.001

Bright is a state of normal response to stimuli; dull is a state of sluggishness wherein the animal exhibits relative indifference to normal stimuli; dummy is a pronounced state of indifference in which the animal does not respond at all to external stimuli, but has the ability to stand and move; and coma is a terminal state of apathy or depression, in which the animal is unconscious and cannot be roused. Blood parameters were compared among groups by using one-way analysis of variance.

BE, base excess of the extracellular fluid; tCO2, total carbon dioxide, HCO3 −, bicarbonate; Na+, sodium; Glu, glucose; pCO2, partial pressure of carbon dioxide; Cl −, chloride; K+, potassium; Hct, hematocrit; Hb, hemoglobin; AnGap, anion gap; BUN, blood urea nitrogen.

Table 3.
Coefficients of correlation between the clinical and laboratory parameters
Blood values Physical activity Dehydration
Pearson, r p value Pearson, r p value
Na+ (mmol/L) 0.066 0.380 −0.052 0.491
K+ (mmol/L) 0.338 < 0.001 0.519 < 0.001
Cl (mmol/L) 0.223 0.003 0.093 0.225
tCO2 (mmol/L) −0.341 < 0.001 −0.285 < 0.001
BUN (mg/dL) 0.503 < 0.001 0.571 < 0.001
Glu (mg/dL) − 0.075 0.317 −0.099 0.187
Hct (%) 0.340 < 0.001 0.442 < 0.001
pH −0.434 < 0.001 −0.438 < 0.001
pCO2 (mmHg) −0.091 0.223 0.115 0.124
HCO3 (mmol/L) −0.340 < 0.001 −0.291 < 0.001
BE (mmol/L) −0.380 < 0.001 −0.343 < 0.001
AnGap (mmol/L) 0.355 < 0.001 0.342 < 0.001
Hb (g/dL) 0.355 < 0.001 0.425 < 0.001

Physical activity was classified into bright, dull, dummy, and coma. Dehydration scores were classified according to the percentage of dehydration as score 1 in cases of less than 6%, score 2 in cases of less than 8%, score 3 in cases of less than 10%, and score 4 in cases of 10% or more. Pearson's correlations were used to evaluate the relationships. Correlations were defined as weakly positive (r = 0.1 to 0.3), moderately positive (r = 0.3 to 0.7), strongly positive (r = 0.7 to 1.0), weakly negative (r = −0.1 to −0.3), moderately negative (r = −0.3 to −0.7), or strongly negative (r = −0.7 to −1.0).

BE, base excess of the extracellular fluid; tCO2, total carbon dioxide; HCO3 −, bicarbonate; Na+, sodium; Glu, glucose; pCO2, partial pressure of carbon dioxide; Cl −, chloride; K+, potassium; Hct, hematocrit; Hb, hemoglobin; AnGap, anion gap; BUN, blood urea nitrogen.

Table 4.
Evaluation of blood parameter values according to the dehydration status (n = 180)
Blood values Score 1 (4–6%) (n = 65) Score 2 (6–8%) (n = 58) Score 3 (8–10%) (n = 37) Score 4 (10–12%) (n = 20) F-value p value
Na+ (mmol/L) 132.75 ± 8.51 132.16 ± 11.64 135.05 ± 11.75 128.10 ± 10.21 1.943 0.124
K+ (mmol/L) 4.92 ± 0.86 5.14 ± 1.54 6.32 ± 1.53 7.41 ± 1.28 25.024 < 0.001
Cl (mmol/L) 100.92 ± 7.98 104.26 ± 12.80 106.06 ± 12.33 101.11 ± 10.23 2.155 0.095
tCO2 (mmol/L) 22.92 ± 7.16 17.35 ± 8.82 18.49 ± 8.96 15.05 ± 6.65 7.480 < 0.001
BUN (mg/dL) 31.48 ± 31.79 60.16 ± 39.83 76.19 ± 42.75 112.75 ± 32.18 28.586 < 0.001
Glu (mg/dL) 105.52 ± 36.69 115.41 ± 98.00 91.95 ± 49.13 87.90 ± 56.02 1.374 0.252
Hct (%) 33.08 ± 5.74 34.66 ± 7.77 39.68 ± 6.19 42.85 ± 7.67 15.300 < 0.001
pH 7.27 ± 0.11 7.19 ± 0.18 7.14 ± 0.15 7.03 ± 0.18 14.373 < 0.001
pCO2 (mmHg) 45.05 ± 10.28 37.94 ± 10.57 45.68 ± 12.62 50.55 ± 18.66 7.182 < 0.001
HCO3 (mmol/L) 21.63 ± 7.02 16.18 ± 8.60 17.16 ± 8.63 13.76 ± 6.56 7.613 < 0.001
BE (mmol/L) −5.26 ± 8.62 −12.07 ± 11.29 −11.84 ± 10.81 −17.15 ± 8.45 9.518 < 0.001
AnGap (mmol/L) 15.11 ± 4.02 16.92 ± 4.28 17.92 ± 4.43 19.78 ± 4.17 7.314 < 0.001
Hb (g/dL) 11.25 ± 1.95 11.94 ± 2.94 13.49 ± 2.11 14.57 ± 2.61 13.443 < 0.001

Dehydration scores were classified according to the percentage of dehydration as score 1 in cases of less than 6%, score 2 in cases of less than 8%, score 3 in cases of less than 10%, and score 4 in cases of 10% or more. Blood parameters were compared among groups by using one-way analysis of variance followed by Tukey's post hoc multiple-comparison tests.

BE, base excess of the extracellular fluid; tCO2, total carbon dioxide; HCO3 −, bicarbonate; Na+, sodium; Glu, glucose; pCO2, partial pressure of carbon dioxide; Cl −, chloride; K+, potassium; Hct, hematocrit; Hb, hemoglobin; AnGap, anion gap; BUN, blood urea nitrogen.

Table 5.
Blood parameters of Korean native calves with diarrhea classified into the survival and death groups
Blood values Prognosis p value
Survival Death
Mean ± SD No. Mean ± SD No.
Na+ (mmol/L) 132.05 ± 9.09 100 130.63 ± 14.03 41 0.553
K+ (mmol/L) Cl (mmol/L) 5.62 ± 1.53 104.11 ± 10.17 100 97 5.88 ± 1.72 103.50 ± 14.05 41 36 0.381 0.812
tCO2 (mmol/L) 17.42 ± 7.06 100 16.00 ± 6.55 41 0.270
BUN (mg/dL) 54.99 ± 42.88 99 93.08 ± 46.88 38 < 0.001
Glu (mg/dL) 100.13 ± 32.89 100 124.34 ± 120.91 41 0.213
Hct (%) 36.11 ± 7.45 100 35.08 ± 8.84 41 0.835
pH 7.16 ± .15 100 7.12 ± .17 41 0.188
pCO2 (mmHg) 42.30 ± 12.18 100 42.71 ± 14.16 41 0.864
HCO3 (mmol/L) 16.18 ± 6.83 100 14.81 ± 6.39 40 0.277
BE (mmol/L) −12.52 ± 8.95 100 −14.51 ± 8.52 41 0.226
AnGap (mmol/L) 16.90 ± 4.12 93 19.03 ± 5.05 35 0.016
Hb (g/dL) 12.37 ± 2.70 100 12.17 ± 3.01 41 0.705

Blood parameters were compared between two prognosis groups (survival vs death) by using Student's t-tests.

SD, standard deviation; BE, base excess of the extracellular fluid; tCO2, total carbon dioxide; HCO3 −, bicarbonate; Na+, sodium; Glu, glucose; pCO2, partial pressure of carbon dioxide; Cl −, chloride; K+, potassium; Hct, hematocrit; Hb, hemoglobin; AnGap, anion gap; BUN, blood urea nitrogen.

TOOLS
Similar articles