Abstract
Tietze's syndrome is an inflammatory condition associated with painful swelling of the costochondral, costosternal, and sternoclavicular joints. Tietze's syndrome has been mostly attributed to microtrauma until now; however, this etiology is currently disputed. The diagnosis is based on clinical findings, although a few studies suggest the advantages of imaging. We report a case of Tietze's syndrome with a review of radiological findings, especially magnetic resonance imaging (MRI) with dynamic contrast enhancement.
Go to : 
REFERENCES
1.Kaplan T., Gunal N., Gulbahar G, et al. Painful chest wall swellings: Tietze syndrome or chest wall tumor? Thorac Cardiovasc Surg. 2016. 64:239–244.

2.Volterrani L., Mazzei MA., Giordano N., Nuti R., Galeazzi M., Fioravanti A. Magnetic resonance imaging in Tietze's syndrome. Clin Exp Rheumatol. 2008. 26:848–853.
4.Aeschlimann A., Kahn MF. Tietze's syndrome: a critical review. Clin Exp Rheumatol. 1990. 8:407–412.
5.Edelstein G., Levitt RG., Slaker DP., Murphy WA. Computed tomography of Tietze syndrome. J Comput Assist Tomogr. 1984. 8:20–23.

6.Martino F., D'amore M., Angelelli G., Macarini L., Cantatore FP. Echographic study of Tietze's syndrome. Clin Rheumatol. 1991. 10:2–4.

8.Oh JH., Park SB., Oh HC. 18F-FDG PET/CT and bone scintigraphy findings in Tietze syndrome. Clin Nucl Med. 2018. 43:832–834.

Go to : 
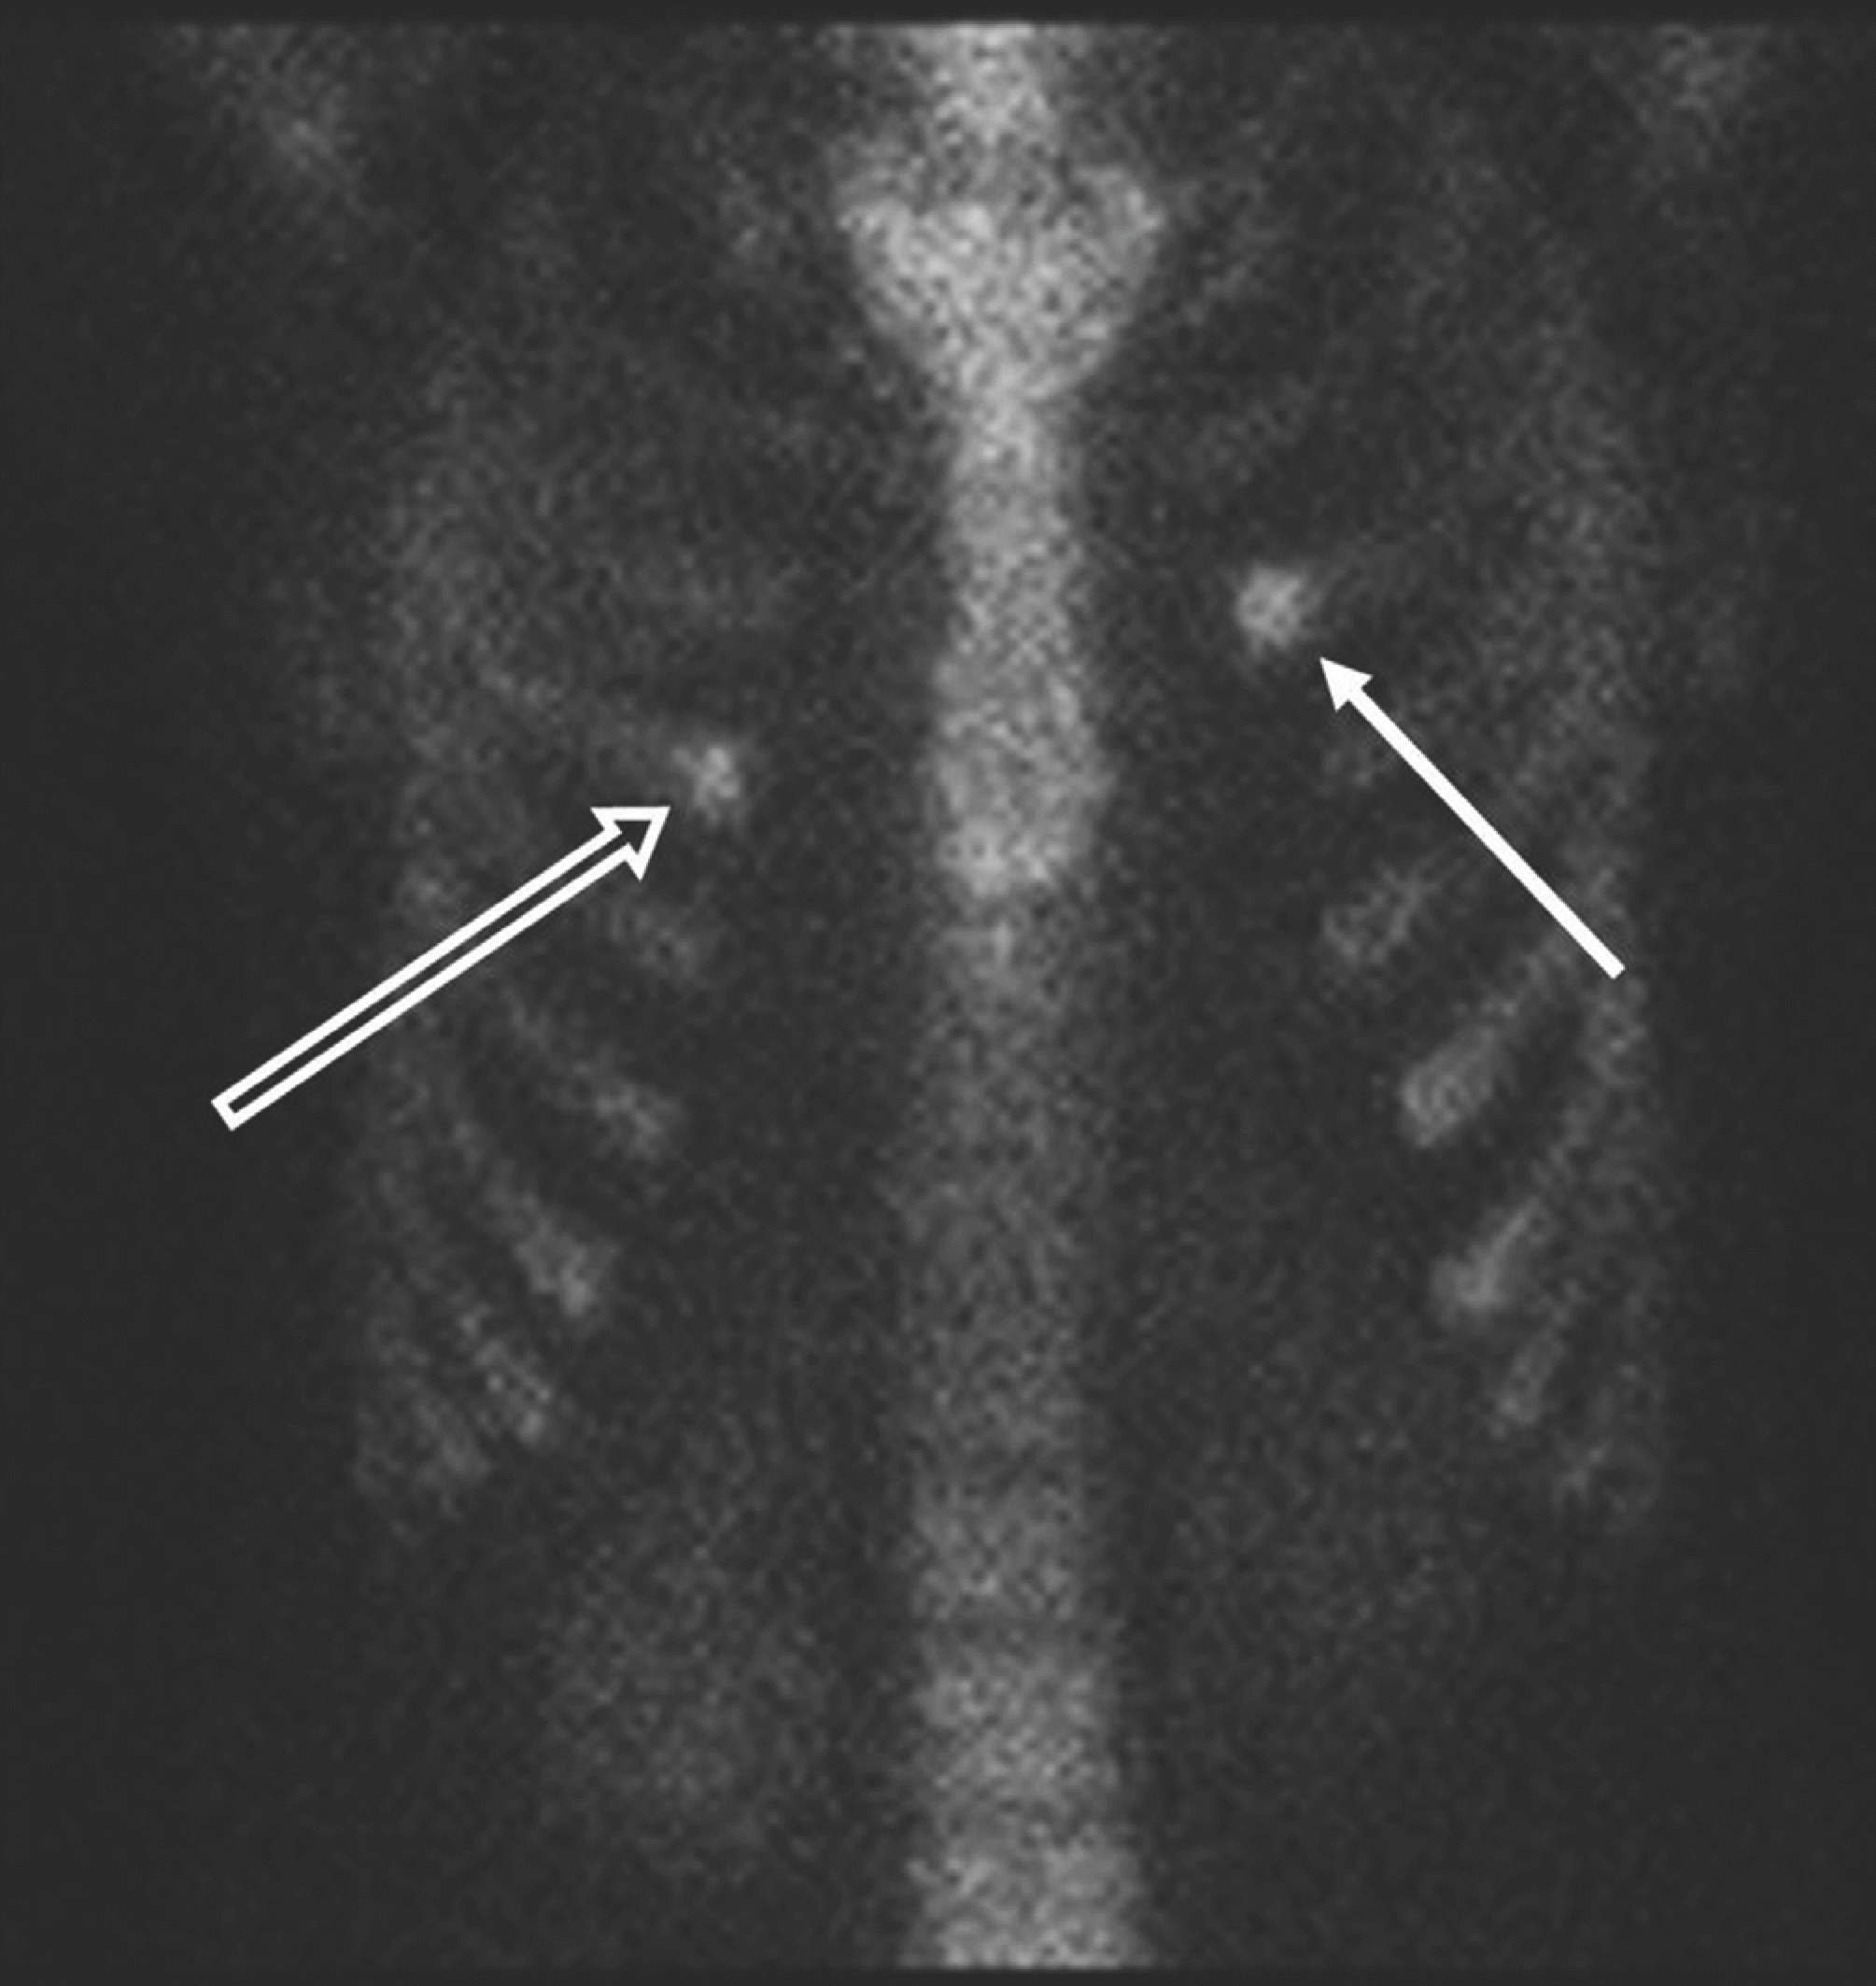 | Fig. 1.The 99mTc-MDP bone scan shows a focal increase in MDP uptake at the anterior end of left 3rd rib (arrow) and the right 4th rib (open arrow) on the anterior static image. |
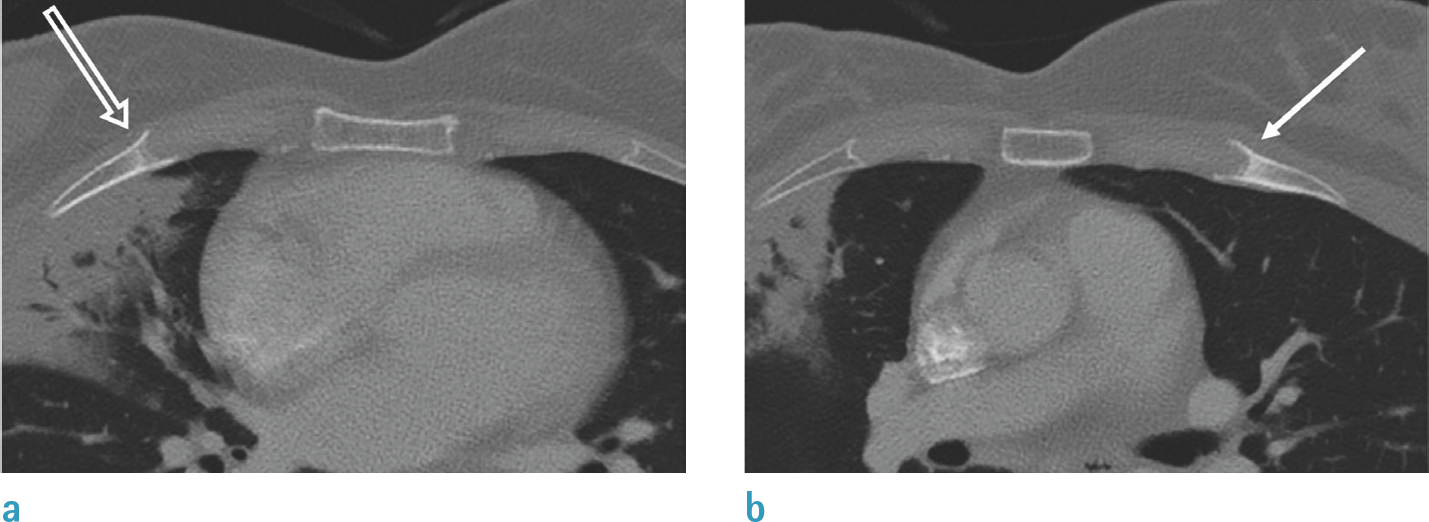 | Fig. 2.Axial CT images (bone window setting) show enlargement of subchondral bone with sclerotic changes at the anterior end of the (a) right 4th (open arrow) and (b) left 3rd (arrow) ribs. |
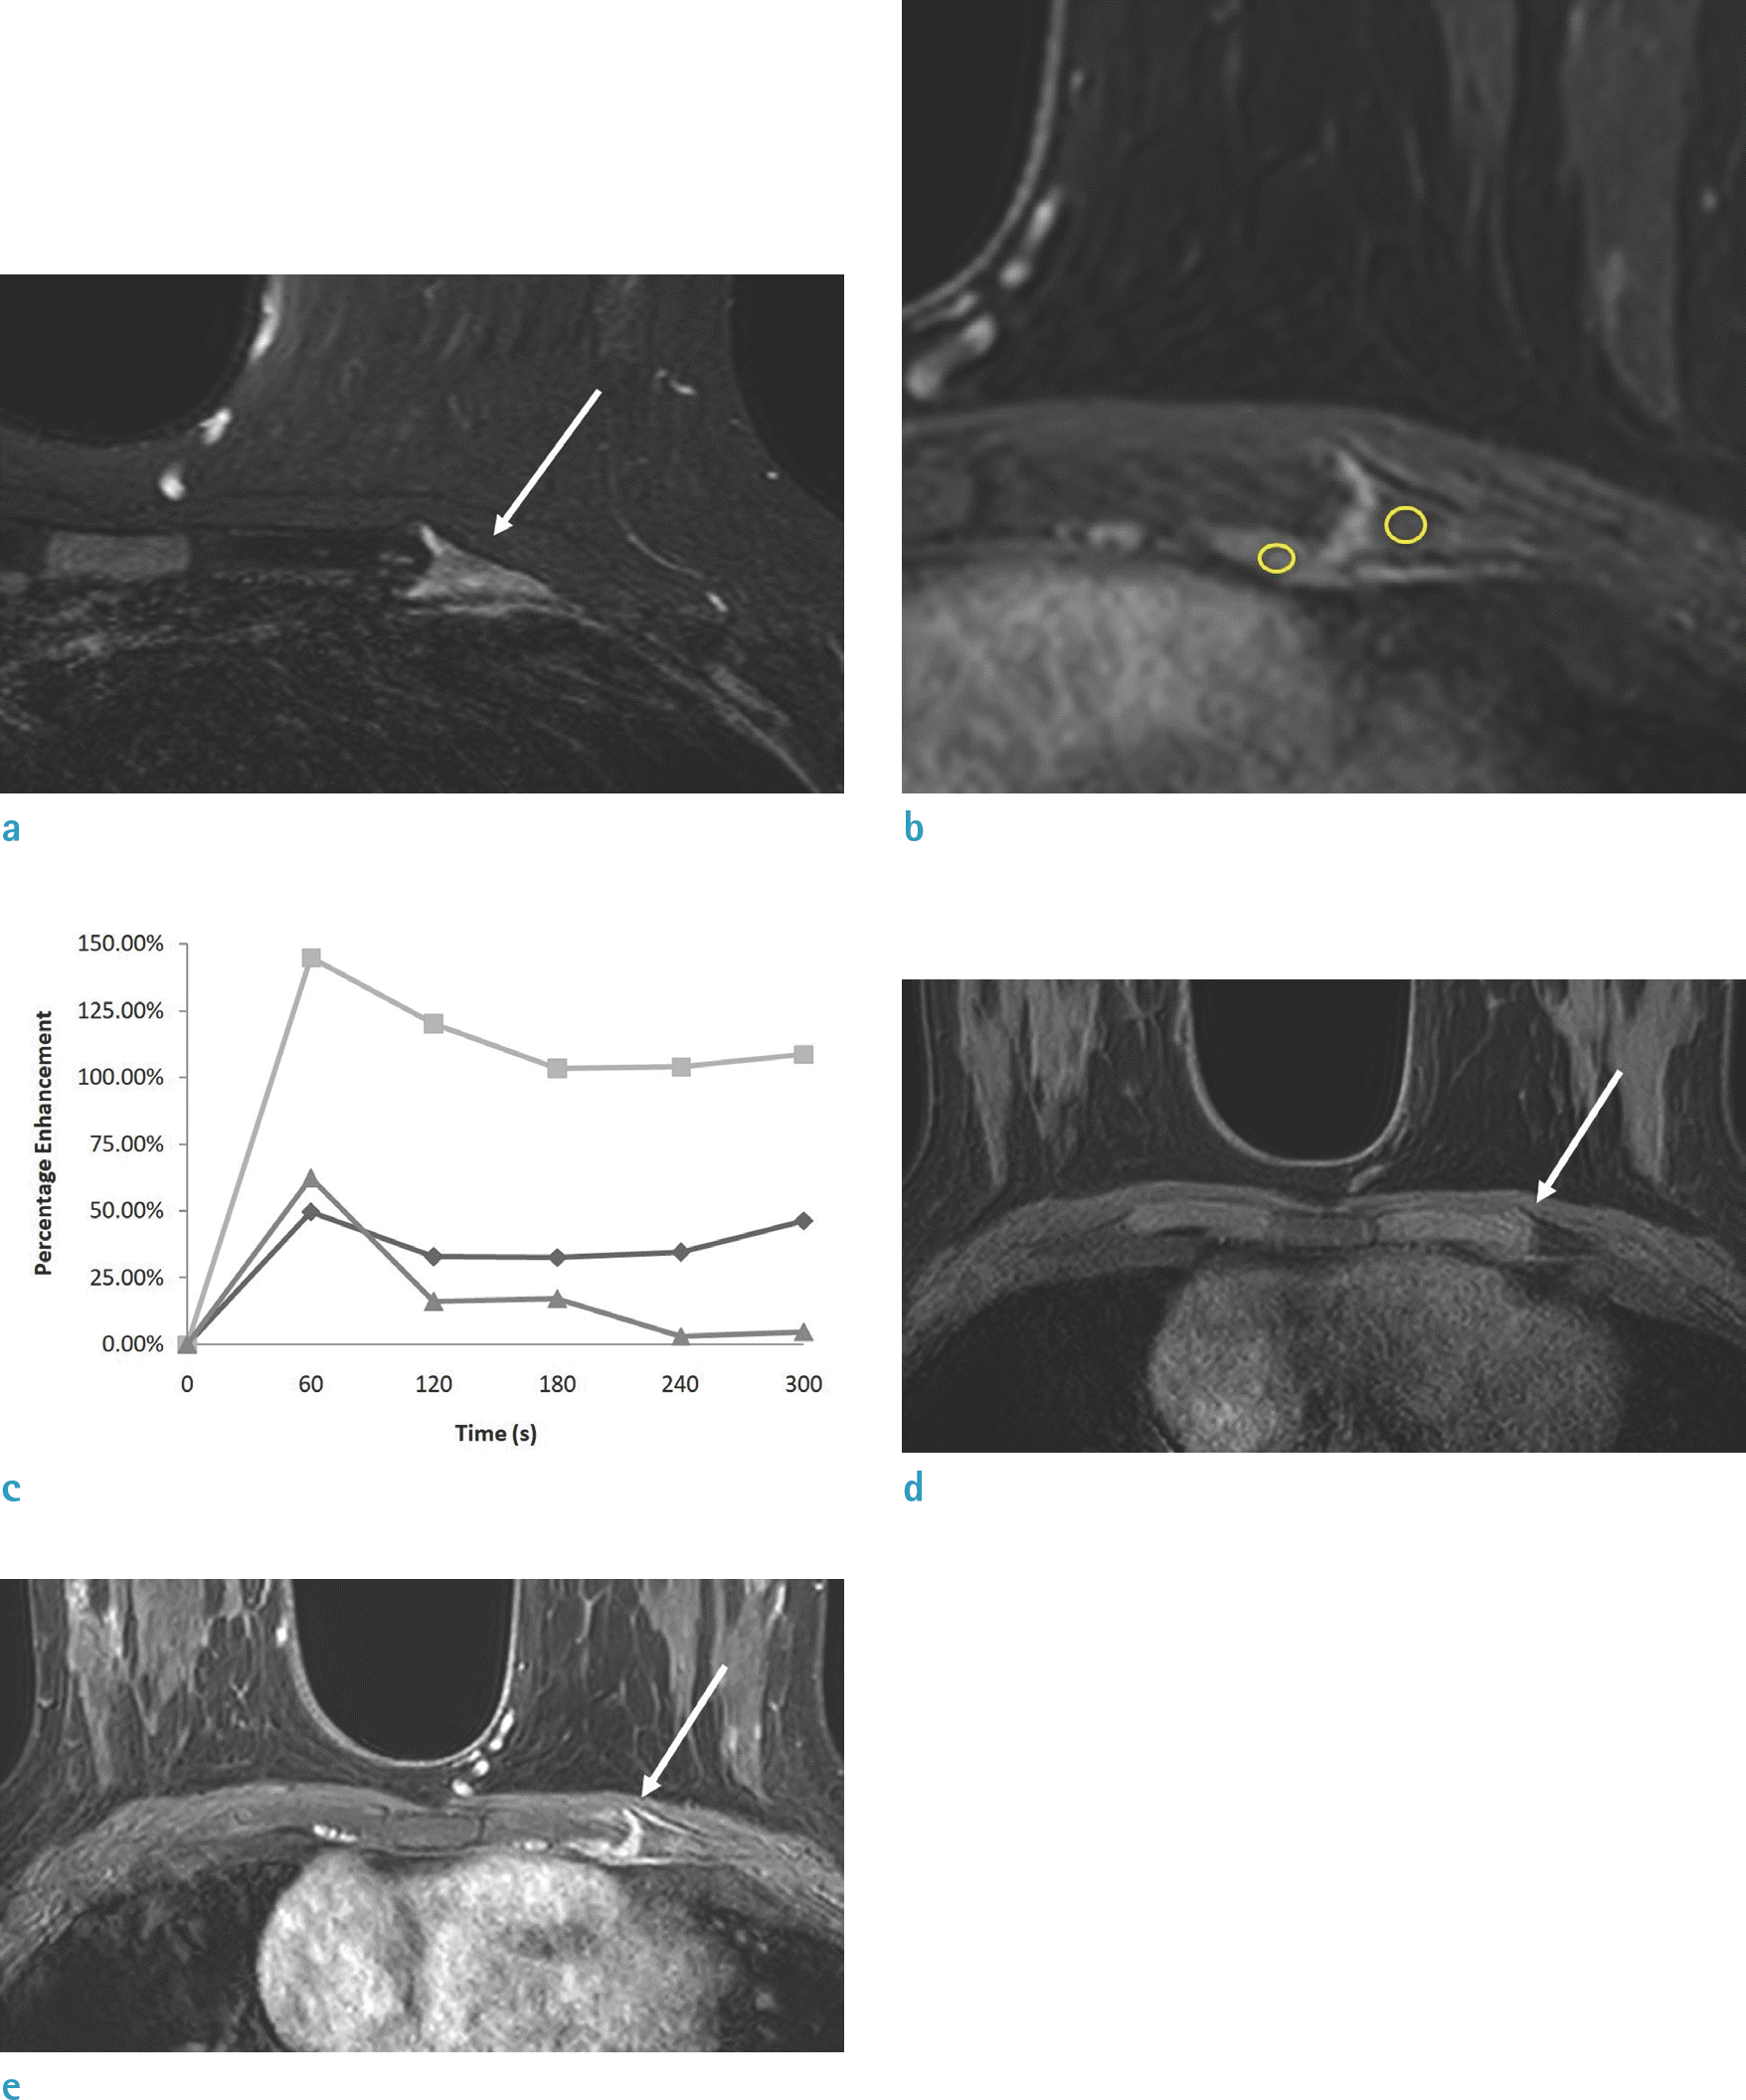 | Fig. 3.Conventional MRI combined with dynamic contrast-enhanced images and kinetic curves. MR fat-suppressed T2-weighted images (a) show enlargement of subchondral bone with bone marrow edema in the anterior end of left 3rd rib (arrow). Regions of interest (b) are placed in the subchondral bone marrow and the capsular component of the left 3rd costochondral joint to calculate the kinetic variables in the DCE-MRI. Kinetic curves (c) of the capsular component (◆) and the subchondral bone marrow (■) suggest an early steep and strong enhancement, followed by a transition to a stable level or a slight decline. In contrast, the kinetic curve in the subchondral bone marrow of the contralateral joint (▲) shows early enhancement followed by a rapid wash-out phase. Precontrast axial T1-weighted fat-suppressed images (d) and the 5-min delayed enhanced T1-weighted fat-suppressed images (e) show thick enhancement at the capsular component of left 3rd costochondral joint (arrows). |


 PDF
PDF ePub
ePub Citation
 Print
Print


 XML Download