Abstract
Background:
Differentiation of cerebellopontine angle (CPA) schwannoma from meningioma is often a difficult process to identify.
Purpose:
To identify imaging features for distinguishing CPA schwannoma from meningioma and to investigate the usefulness of susceptibility-weighted imaging (SWI) in differentiating them.
Materials and Methods:
Between March 2010 and January 2015, this study pathologically confirmed 11 meningiomas and 20 schwannomas involving CPA with preoperative SWI were retrospectively reviewed. Generally, the following MRI features were evaluated: 1) maximal diameter on axial image, 2) angle between tumor border and adjacent petrous bone, 3) presence of intratumoral dark signal intensity on SWI, 4) tumor consistency, 5) blood-fluid level, 6) involvement of internal auditory canal (IAC), 7) dural tail, and 8) involvement of adjacent intracranial space. On CT, 1) presence of dilatation of IAC, 2) intratumoral calcification, and 3) adjacent hyperostosis were evaluated. All features were compared using Chi-squared tests and Fisher's exact tests. The univariate and multivariate logistic regression analysis were performed to identify imaging features that differentiate both tumors.
Results:
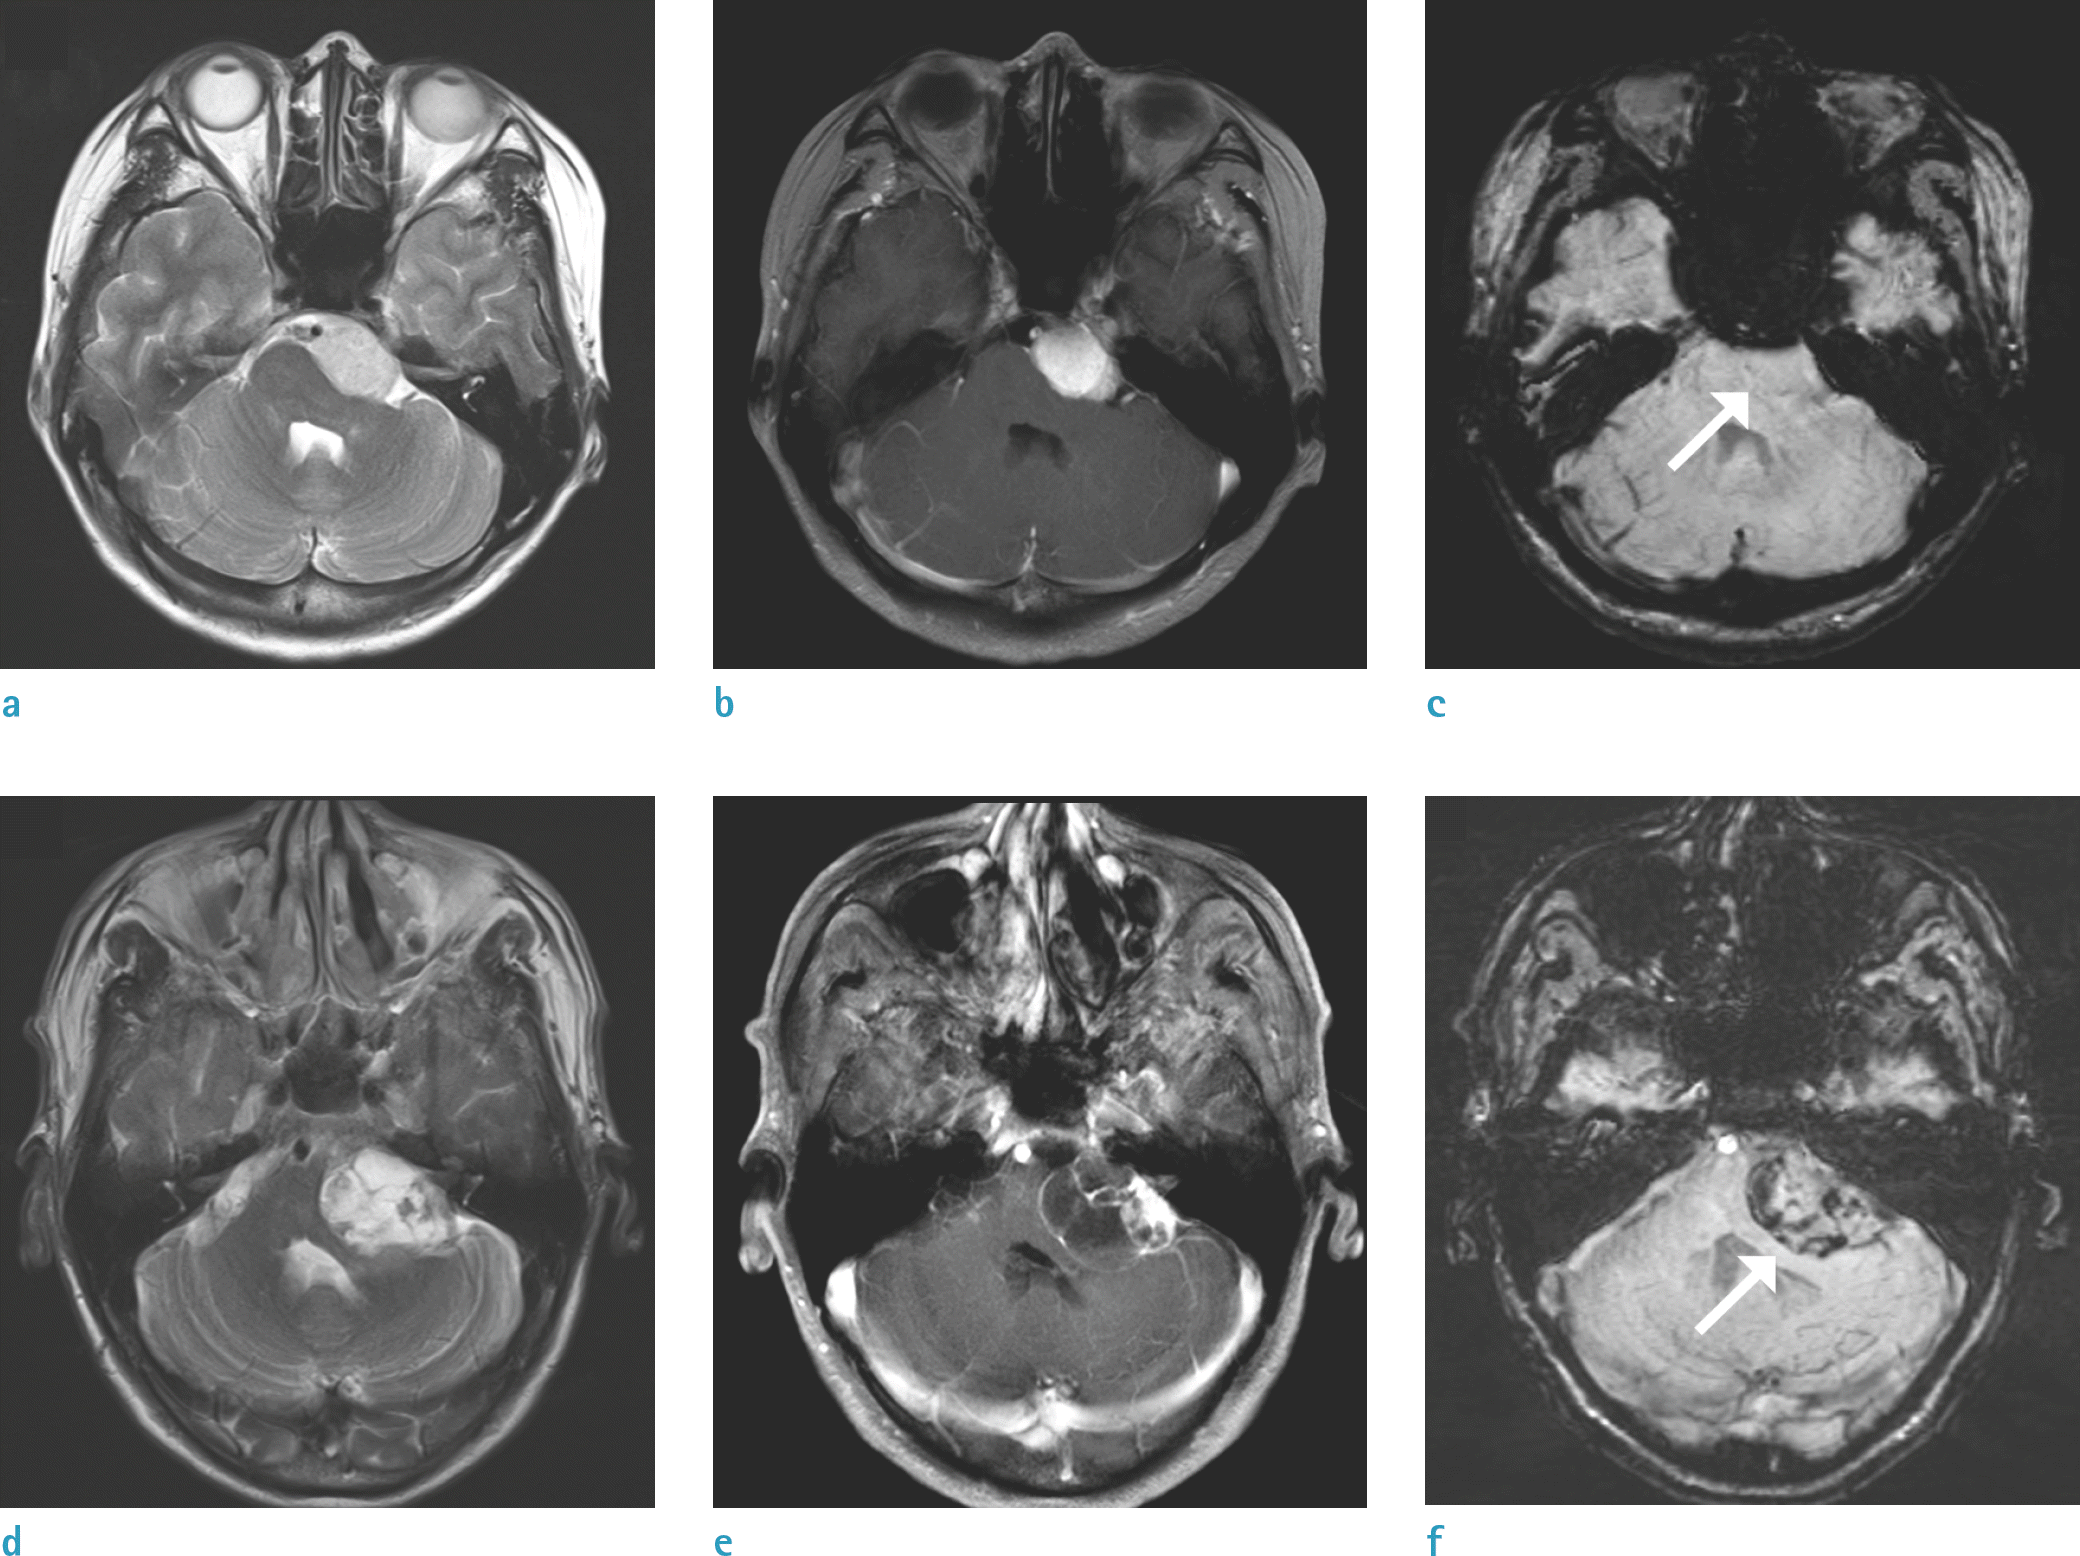
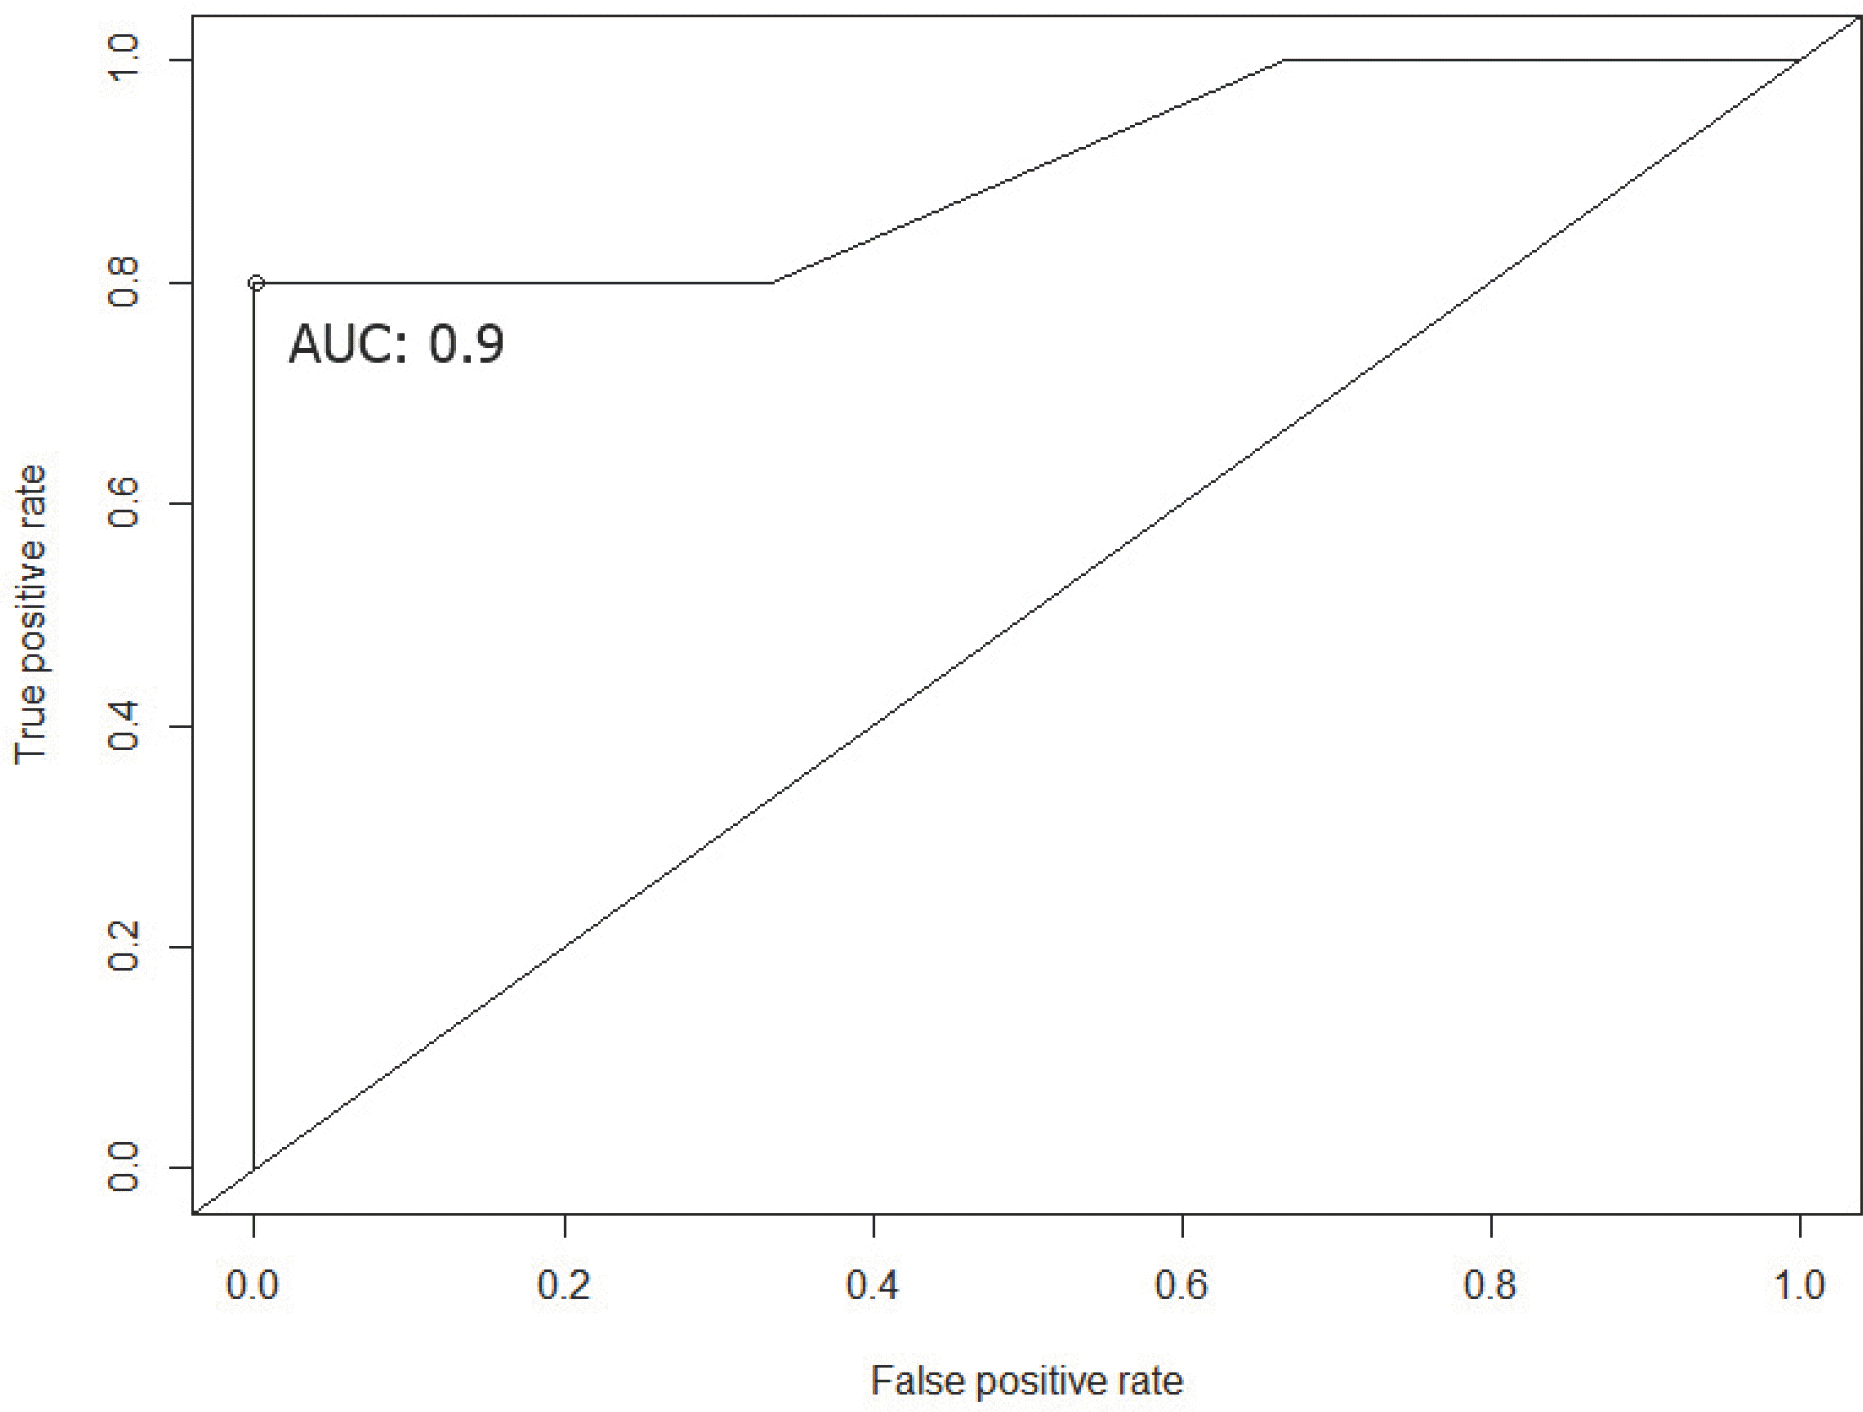
The results noted that schwannomas more frequently demonstrated dark spots on SWI (P = 0.025), cystic consistency (P = 0.034), and globular angle (P = 0.008); schwannomas showed more dilatation of internal auditory meatus and lack of calcification (P = 0.008 and P = 0.02, respectively). However, it was shown that dural tail was more common in meningiomas (P < 0.007). In general, dark spots on SWI and dural tail remained significant in multivariate analysis (P = 0.037 and P = 0.012, respectively). In this case, the combination of two features showed a sensitivity and specificity of 80% and 100% respectively, with an area under the receiver operating characteristic curve of 0.9.
Go to : 
REFERENCES
1.Schlieter M., Zoubaa S., Kress B., Unterberg A., Jacobi C., Hahnel S. Hemorrhagic acoustic schwannoma: radiological and histopathological findings. J Neuroradiol. 2005. 32:210–212.

2.Grey PL., Moffat DA., Hardy DG. Surgical results in unusual cerebellopontine angle tumours. Clin Otolaryngol Allied Sci. 1996. 21:237–243.

3.Xia L., Zhang H., Yu C, et al. Fluid-fluid level in cystic vestibular schwannoma: a predictor of peritumoral adhesion. J Neurosurg. 2014. 120:197–206.

4.Thamburaj K., Radhakrishnan VV., Thomas B., Nair S., Menon G. Intratumoral microhemorrhages on T2∗-weighted gradient-echo imaging helps differentiate vestibular schwannoma from meningioma. AJNR Am J Neuroradiol. 2008. 29:552–557.

5.Liang L., Korogi Y., Sugahara T, et al. Detection of intracranial hemorrhage with susceptibility-weighted MR sequences. AJNR Am J Neuroradiol. 1999. 20:1527–1534.
6.Tomogane Y., Mori K., Izumoto S, et al. Usefulness of PRESTO magnetic resonance imaging for the differentiation of schwannoma and meningioma in the cerebellopontine angle. Neurol Med Chir (Tokyo). 2013. 53:482–489.

7.Haacke EM., Xu Y., Cheng YC., Reichenbach JR. Susceptibility weighted imaging (SWI). Magn Reson Med. 2004. 52:612–618.

8.Zamani AA. Cerebellopontine angle tumors: role of magnetic resonance imaging. Top Magn Reson Imaging. 2000. 11:98–107.

9.Nakamura M., Roser F., Dormiani M., Matthies C., Vorkapic P., Samii M. Facial and cochlear nerve function after surgery of cerebellopontine angle meningiomas. Neurosurgery. 2005. 57:77–90. discussion 77-90.

10.Voss NF., Vrionis FD., Heilman CB., Robertson JH. Meningiomas of the cerebellopontine angle. Surg Neurol. 2000. 53:439–446. discussion 446-437.

11.Tong KA., Harnsberger HR., Swartz JD. The vestibulocochlear nerve, emphasizing the normal and diseased internal auditory canal and cerebellopontine angle. In. Swartz JD, Harnsberger HR, editors. Imaging of the temporal bone. 3rd ed.New York: Thieme;1998. p. 394–472.
12.Lalwani AK., Jackler RK. Preoperative differentiation between meningioma of the cerebellopontine angle and acoustic neuroma using MRI. Otolaryngol Head Neck Surg. 1993. 109:88–95.

13.Ryoo JW., Na DG., Woo JY, et al. Investigation of juxtasellar and cerebellopontine angle meningiomas and neurogenic tumours: two-phase helical CT. Neuroradiology. 2001. 43:637–643.

14.Mikhael MA., Ciric IS., Wolff AP. Differentiation of cerebellopontine angle neuromas and meningiomas with MR imaging. J Comput Assist Tomogr. 1985. 9:852–856.

15.Piccirillo E., Wiet MR., Flanagan S, et al. Cystic vestibular schwannoma: classification, management, and facial nerve outcomes. Otol Neurotol. 2009. 30:826–834.
16.Schober R., Vogeley KT., Urich H., Holzle E., Wechsler W. Vascular permeability changes in tumours of the peripheral nervous system. Virchows Arch A Pathol Anat Histopathol. 1992. 420:59–64.

17.Jeng CM., Huang JS., Lee WY., Wang YC., Kung CH., Lau MK. Magnetic resonance imaging of acoustic schwannomas. J Formos Med Assoc. 1995. 94:487–493.
18.Werring DJ. Cerebral microbleeds: clinical and pathophysiological significance. J Neuroimaging. 2007. 17:193–203.
19.Akter M., Hirai T., Hiai Y, et al. Detection of hemorrhagic hypointense foci in the brain on susceptibility-weighted imaging clinical and phantom studies. Acad Radiol. 2007. 14:1011–1019.
20.Nandigam RN., Viswanathan A., Delgado P, et al. MR imaging detection of cerebral microbleeds: effect of susceptibility-weighted imaging, section thickness, and field strength. AJNR Am J Neuroradiol. 2009. 30:338–343.

21.Russell DS., Rubinstein LJ. Tumors of meninges and related tissues, tumors of cranial, spinal and peripheral nerve sheaths. In. Bigner DD, McLendon RE, Bruner JM, editors. Russell and Rubinstein's pathology of tumors of the nervous system. 6th ed.London: Arnold;1998. p. 67–194.
22.Ishii K., Takahashi S., Matsumoto K, et al. Hemorrhage and abnormal veins in acoustic neurinoma: MR findings. Radiat Med. 1996. 14:65–69.
23.Park CK., Kim DC., Park SH, et al. Microhemorrhage, a possible mechanism for cyst formation in vestibular schwannomas. J Neurosurg. 2006. 105:576–580.

24.Mishra A., Thomas B., Kapilamoorthy TR. Susceptibility weighted imaging - a problem-solving tool in differentiation of cerebellopontine angle schwannomas and meningiomas. Neuroradiol J. 2017. 30:253–258.

25.Liu G., Sobering G., Duyn J., Moonen CT. A functional MRI technique combining principles of echo-shifting with a train of observations (PRESTO). Magn Reson Med. 1993. 30:764–768.

26.Chavhan GB., Babyn PS., Thomas B., Shroff MM., Haacke EM. Principles, techniques, and applications of T2∗-based MR imaging and its special applications. Radiographics. 2009. 29:1433–1449.

27.Eriksson S. A study of susceptibility-weighted MRI including a comparison of two different implementations. Sweden: Lund University. 2011.
Go to : 
 | Fig. 1.Representative images of meningioma (upper row) in a 35-year-old woman and schwannoma (bottom row) in a 66-year-old male. From left to right, each column represents T2-weighted (a, d), contrast-enhanced T1-weighted (b, e) and SWI (c, f) of tumor located in left cerebellopontine angle. Schwannoma shows punctate dark signal intensities on SWI (f) while meningioma shows none (c) (arrows). SWI = susceptibility-weighted image. |
 | Fig. 2.A receiver operator characteristic curve based on two significant imaging features from multivariate logistic regression-dark spots on SWI and dural tail sign. At the optimal threshold point (open circle), the AUC was 0.9 with a sensitivity and a specificity of 80% and 100%, respectively. AUC = area under the receiver operator characteristic curve. |
Table 1.
Baseline Cha racteristics of Patients and Tumors (n = 31)
Table 2.
Comparison of Imaging Features of Tumors
| MRI features, n (%) | Meningioma (n = 11) | Schwannoma (n = 20) | P-value |
|---|---|---|---|
| Maximal tumor diameter (cm), mean ± SD | 4.2 ± 1.4 | 3.8 ± 1.3 | 0.373 |
| Dark spot on SWIb | 0.025 | ||
| none | 6 (54.5%) | 2 (10.0%) | |
| < 50% | 4 (36.4%) | 14 (70.0%) | |
| ≥ 50% | 1 (9.1%) | 4 (20.0%) | |
| Tumor consistency | 0.034 | ||
| Solid | 9 (81.8%) | 7 (35.0%) | |
| Solid and cystic | 2 (18.2%) | 13 (65.0%) | |
| Blood-fluid level | 0.474a | ||
| Absent | 11 (100.0%) | 17 (85.0%) | |
| Present | 0 (0.0%) | 3 (15.0%) | |
| IAC component | 0.056 | ||
| Absent | 8 (72.7%) | 6 (30.0%) | |
| Present | 3 (27.3%) | 14 (70.0%) | |
| Dural tail sign | 0.007 | ||
| Absent | 5 (45.5%) | 19 (95.0%) | |
| Present | 6 (54.5%) | 1 (5.0%) | |
| Anglec | 0.008 | ||
| Broad | 9 (81.8%) | 5 (25.0%) | |
| Globular | 2 (18.2%) | 15 (75.0%) | |
| CT imaging features, n (%) | |||
| Meatus dilatation | 0.008a | ||
| Absent | 11 (100.0%) | 9 (45.0%) | |
| Present | 0 (0.0%) | 11 (55.0%) | |
| Calcification | 0.02a | ||
| Absent | 7 (63.6%) | 20 (100.0%) | |
| Present | 4 (36.4%) | 0 (0.0%) | |
| Hyperostosis | 0.749a | ||
| Absent | 11 (100.0%) | 18 (90.0%) | |
| Present | 0 (0.0%) | 2 (10.0%) |
Table 3.
Univariate and Multivariate Logistic Regression Analysis Using Clinical and Imaging Characteristics
| Variables | Univariate analysis | Multivariate analysisa | ||
|---|---|---|---|---|
| OR (95% CI) | P-value | OR (95% CI) | P-value | |
| Age | 0.96 [0.91, 1.0] | 0.13 | ||
| Sex, male | 1.75 [0.4, 8.52] | 0.467 | ||
| Maximal tumor diameter | 0.76 [0.42, 1.36] | 0.362 | ||
| Dark spot on SWI (none vs. present) | 2.73 [1.27, 6.98] | 0.017 | 3.25 [1.19, 12] | 0.037 |
| Tumor consistency | 8.36 [1.61, 65.9] | 0.02 | ||
| Blood-fluid level | 0.994 | |||
| IAC component | 6.22 [1.31, 37.0] | 0.029 | 2.94 [0.32, 30.5] | 0.331 |
| Dural tail sign | 0.04 [0, 0.33] | 0.009 | 0.03 [0, 0.33] | 0.012 |
| Angleb | 13.5 [2.5, 111.6] | 0.005 | ||
| Meatus dilatation | 0.995 | |||
| Calcification | 0.995 | |||
| Hyperostosis | 0.995 | |||


 PDF
PDF ePub
ePub Citation
 Print
Print


 XML Download