Journal List > Investig Magn Reson Imaging > v.24(1) > 1144485

Hong, Kim, and Park: MRI Findings to Predict Neurodevelopmental Outcomes in Preterm Infants Near Term-Equivalent Age

Abstract

Purpose:

Preterm infants are at high risk for adverse neurodevelopmental outcomes. Magnetic resonance imaging (MRI) has been proposed as a means of predicting neurodevelopmental outcomes in this population. It is controversial whether diffuse excessive high signal intensity (DEHSI) represents damage to the white matter or delayed myelination in preterm infants. This study investigated MRI findings for predicting the severity of neurodevelopmental outcomes and assessing whether preterm infants with DEHSI near term-equivalent age have abnormal neurodevelopmental outcomes.

Materials and Methods:

Preterm infants (n = 64, gestational age at birth < 35 weeks) undergoing brain MRI near term-equivalent age and subsequent neurodevelopmental outcomes were evaluated between 18 and 24 months of age. The associations of MRI findings and the risk of severe cognitive delay, severe psychomotor delay, cerebral palsy (CP), and neurosensory impairment were analyzed. The associations of DEHSI with risks of severe cognitive delay, severe psychomotor delay, CP, and neurosensory impairment (hearing or visual impairment) were analyzed. Outcome data were evaluated by logistic regression and the Fisher's exact test.

Results:

There were significant associations between abnormal white matter findings and delayed mental development, delayed psychomotor development, neurosensory impairment, and presence of CP. The presence of DEHSI was not correlated with delayed neurodevelopmental outcomes or presence of CP. In multivariate logistic regression analyses, cystic encephalomalacia, punctate lesion, loss of white matter volume and ventricular dilation were significantly associated with CP.

Conclusion:

Abnormal MRI findings near term-equivalent age in preterm infants predict adverse neurodevelopmental outcomes. No significant association between DEHSI and adverse neurodevelopmental outcomes was demonstrated.

REFERENCES

1.Inder TE., Warfield SK., Wang H., Huppi PS., Volpe JJ. Abnormal cerebral structure is present at term in premature infants. Pediatrics. 2005. 115:286–294.
crossref
2.Hoekstra RE., Ferrara TB., Couser RJ., Payne NR., Connett JE. Survival and long-term neurodevelopmental outcome of extremely premature infants born at 23-26 weeks’ gestational age at a tertiary center. Pediatrics. 2004. 113:e1–6.
crossref
3.Wilson-Costello D., Friedman H., Minich N., Fanaroff AA., Hack M. Improved survival rates with increased neurodevelopmental disability for extremely low birth weight infants in the 1990s. Pediatrics. 2005. 115:997–1003.
crossref
4.Stewart AL., Rifkin L., Amess PN, et al. Brain structure and neurocognitive and behavioural function in adolescents who were born very preterm. Lancet. 1999. 353:1653–1657.
crossref
5.Saigal S., Doyle LW. An overview of mortality and sequelae of preterm birth from infancy to adulthood. Lancet. 2008. 371:261–269.
crossref
6.Wood NS., Marlow N., Costeloe K., Gibson AT., Wilkinson AR. Neurologic and developmental disability after extremely preterm birth. EPICure Study Group. N Engl J Med. 2000. 343:378–384.
7.Horsch S., Hallberg B., Leifsdottir K, et al. Brain abnormalities in extremely low gestational age infants: a Swedish population based MRI study. Acta Paediatr. 2007. 96:979–984.
crossref
8.Horbar JD., Badger GJ., Carpenter JH, et al. Trends in mortality and morbidity for very low birth weight infants, 1991-1999. Pediatrics. 2002. 110:143–151.
crossref
9.Dyet LE., Kennea N., Counsell SJ, et al. Natural history of brain lesions in extremely preterm infants studied with serial magnetic resonance imaging from birth and neurodevelopmental assessment. Pediatrics. 2006. 118:536.
crossref
10.Inder TE., Wells SJ., Mogridge NB., Spencer C., Volpe JJ. Defining the nature of the cerebral abnormalities in the premature infant: a qualitative magnetic resonance imaging study. J Pediatr. 2003. 143:171–179.
crossref
11.Woodward LJ., Anderson PJ., Austin NC., Howard K., Inder TE. Neonatal MRI to predict neurodevelopmental outcomes in preterm infants. N Engl J Med. 2006. 355:685–694.
crossref
12.Hart AR., Whitby EW., Griffiths PD., Smith MF. Magnetic resonance imaging and developmental outcome following preterm birth: review of current evidence. Dev Med Child Neurol. 2008. 50:655–663.
crossref
13.Marlow N., Wolke D., Bracewell MA., Samara M. EPICure Study Group. Neurologic and developmental disability at six years of age after extremely preterm birth. N Engl J Med. 2005. 352:9–19.
crossref
14.Taylor HG., Klein N., Minich NM., Hack M. Middle-school-age outcomes in children with very low birthweight. Child Dev. 2000. 71:1495–1511.
crossref
15.Maalouf EF., Duggan PJ., Rutherford MA, et al. Magnetic resonance imaging of the brain in a cohort of extremely preterm infants. J Pediatr. 1999. 135:351–357.
crossref
16.Skiold B., Horsch S., Hallberg B, et al. White matter changes in extremely preterm infants, a population-based diffusion tensor imaging study. Acta Paediatr. 2010. 99:842–849.
17.Inder TE., Anderson NJ., Spencer C., Wells S., Volpe JJ. White matter injury in the premature infant: a comparison between serial cranial sonographic and MR findings at term. AJNR Am J Neuroradiol. 2003. 24:805–809.
18.Volpe JJ. Cerebral white matter injury of the premature infant-more common than you think. Pediatrics. 2003. 112:176–180.
crossref
19.Back SA., Riddle A., McClure MM. Maturation-dependent vulnerability of perinatal white matter in premature birth. Stroke. 2007. 38:724–730.
crossref
20.Gilles FH., Gomez IG. Developmental neuropathology of the second half of gestation. Early Hum Dev. 2005. 81:245–253.
crossref
21.Hart A., Whitby E., Wilkinson S., Alladi S., Paley M., Smith M. Neuro-developmental outcome at 18 months in premature infants with diffuse excessive high signal intensity on MR imaging of the brain. Pediatr Radiol. 2011. 41:1284–1292.
22.Jeon TY., Kim JH., Yoo SY, et al. Neurodevelopmental outcomes in preterm infants: comparison of infants with and without diffuse excessive high signal intensity on MR images at near-term-equivalent age. Radiology. 2012. 263:518–526.
crossref
23.Park HW., Cho BH. Korean Bayley scales of infant development: interpretation manual. 2nd ed.Seoul: Kidspop Publishing Co.;2006.
24.Stephens BE., Vohr BR. Neurodevelopmental outcome of the premature infant. Pediatr Clin North Am. 2009. 56:631–646.
crossref
25.Evensen KA., Skranes J., Brubakk AM., Vik T. Predictive value of early motor evaluation in preterm very low birth weight and term small for gestational age children. Early Hum Dev. 2009. 85:511–518.
crossref
26.Aylward GP. Cognitive and neuropsychological outcomes: more than IQ scores. Ment Retard Dev Disabil Res Rev. 2002. 8:234–240.
crossref
27.Mirmiran M., Barnes PD., Keller K, et al. Neonatal brain magnetic resonance imaging before discharge is better than serial cranial ultrasound in predicting cerebral palsy in very low birth weight preterm infants. Pediatrics. 2004. 114:992–998.
crossref
28.Roelants-van Rijn AM., Groenendaal F., Beek FJ., Eken P., van Haastert IC., de Vries LS. Parenchymal brain injury in the preterm infant: comparison of cranial ultrasound, MRI and neurodevelopmental outcome. Neuropediatrics. 2001. 32:80–89.
crossref
29.Valkama AM., Paakko EL., Vainionpaa LK., Lanning FP., Ilkko EA., Koivisto ME. Magnetic resonance imaging at term and neuromotor outcome in preterm infants. Acta Paediatr. 2000. 89:348–355.
crossref
30.Schouman-Claeys E., Henry-Feugeas MC., Roset F, et al. Periventricular leukomalacia: correlation between MR imaging and autopsy findings during the first 2 months of life. Radiology. 1993. 189:59–64.
crossref
31.Garel C., Delezoide AL., Elmaleh-Berges M, et al. Contribution of fetal MR imaging in the evaluation of cerebral ischemic lesions. AJNR Am J Neuroradiol. 2004. 25:1563–1568.
32.Roelants-van Rijn AM., Nikkels PG., Groenendaal F, et al. Neonatal diffusion-weighted MR imaging: relation with histopathology or follow-up MR examination. Neuropediatrics. 2001. 32:286–294.
crossref
33.Volpe JJ. Neurology of the newborn. 4th ed.Philadelphia, PA: WB Saunders;2001.
34.Counsell SJ., Shen Y., Boardman JP, et al. Axial and radial diffusivity in preterm infants who have diffuse white matter changes on magnetic resonance imaging at term-equivalent age. Pediatrics. 2006. 117:376–386.
crossref
35.Hagmann CF., De Vita E., Bainbridge A, et al. T2 at MR imaging is an objective quantitative measure of cerebral white matter signal intensity abnormality in preterm infants at term-equivalent age. Radiology. 2009. 252:209–217.
crossref
36.Hack M., Taylor HG., Drotar D, et al. Poor predictive validity of the Bayley Scales of Infant Development for cognitive function of extremely low birth weight children at school age. Pediatrics. 2005. 116:333–341.
crossref

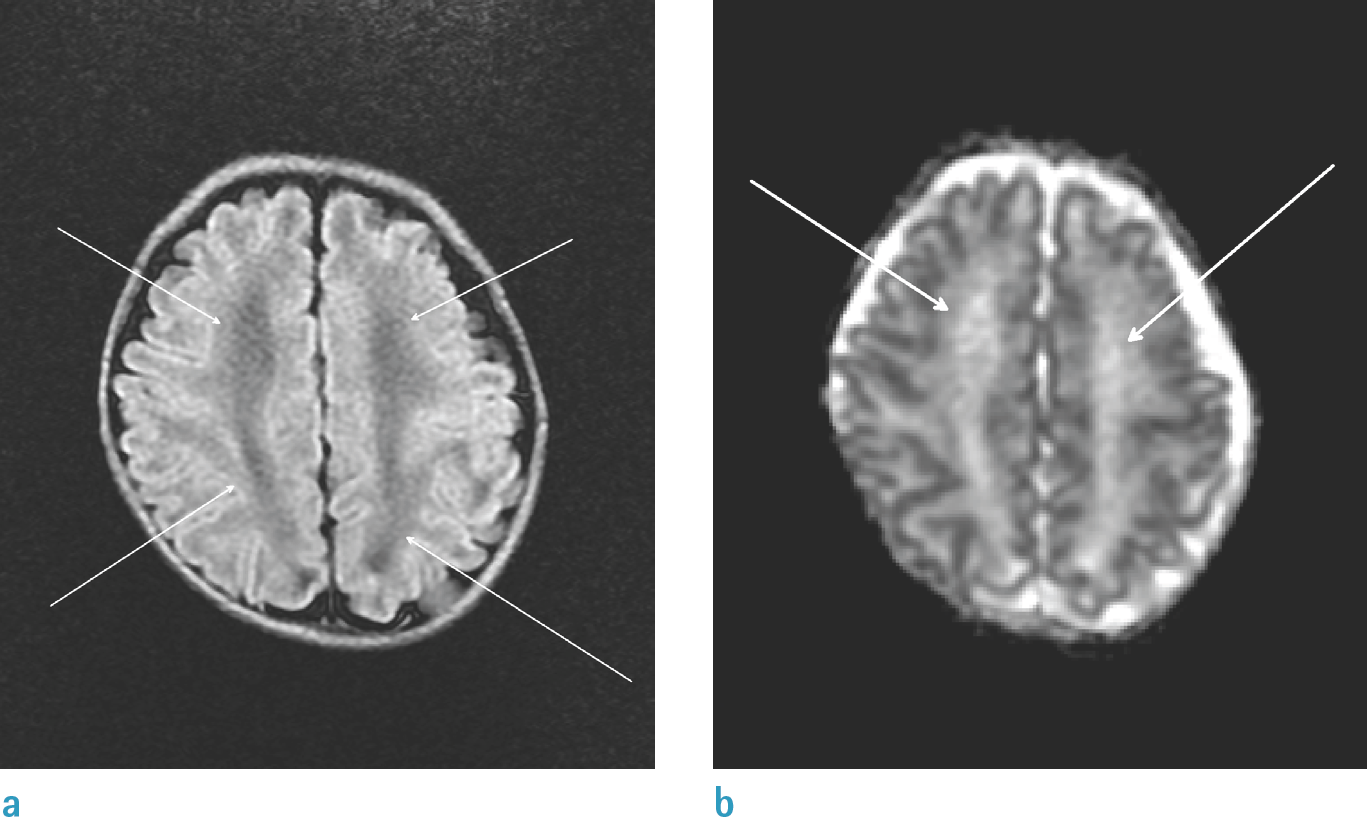
Fig. 1.
Axial FLAIR (a) and (b) ADC map showing DEHSI at the level of the centrum semiovale. This male infant was born at 30+5 weeks with a birth weight of 1250 g. MRI was performed at gestational age of 36+2 weeks. He showed accelerated mental development index and psychomotor motor index.
imri-24-30f1.tif
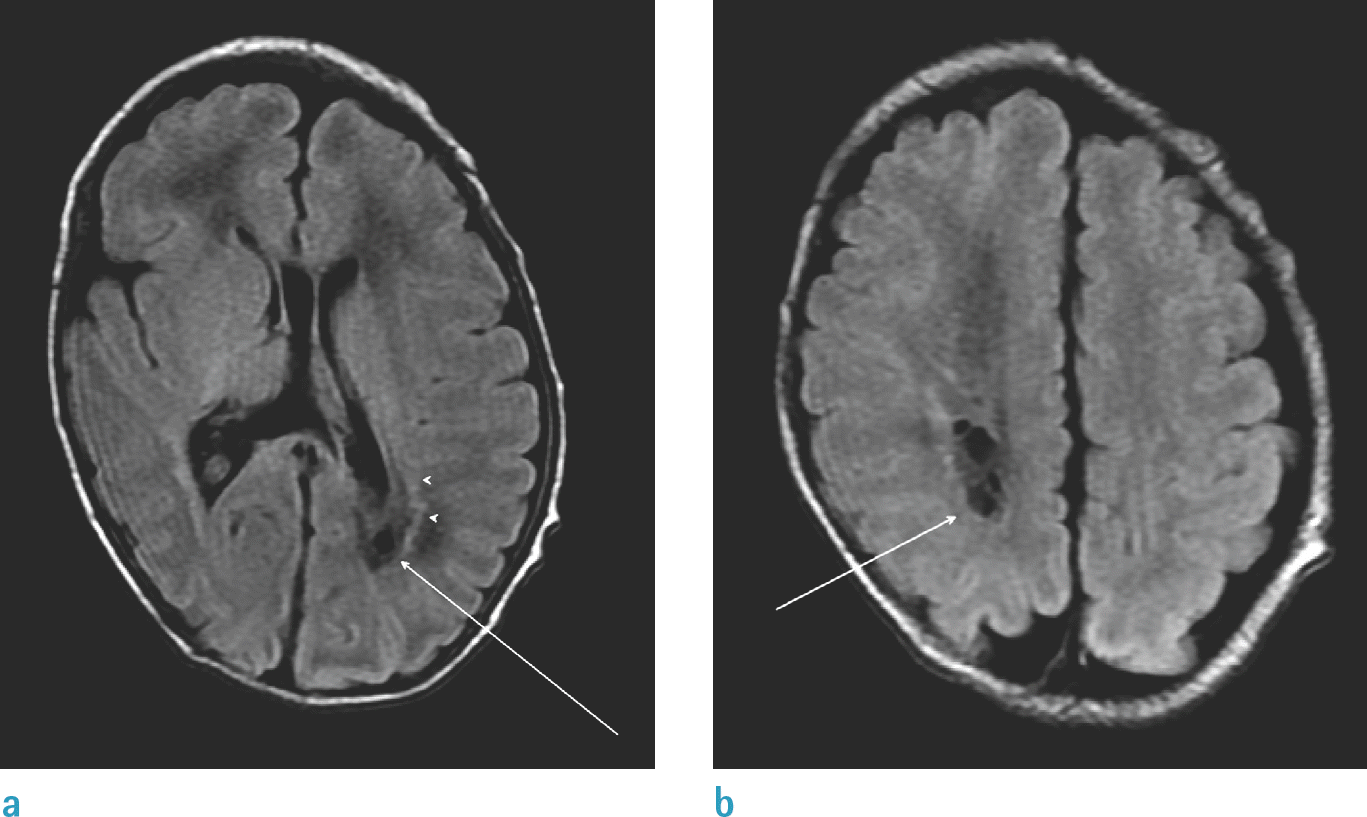
Fig. 2.
(a, b) Cystic encephalomalacia (arrows) and punctate lesions (arrowheads) were seen in the parietal white matter. This male infant was born at 30+6 weeks with birth weight of 1620 g. MRI was performed at 38+2 weeks. He had PDA clipping. He showed delayed mental and psychomotor index at 2 years.
imri-24-30f2.tif
Table 1.
Associations between White Matter Abnormalities and Mental Developmental Scores, Presence of Neurosensory Impairment and Cerebral Palsy
Variable White matter abnormality
None (n = 25) Mild (n = 21) Moderate (n = 6) Se Severe abnormality (n = 12) P-value
Mental development index 89.4 ± 13.63 78.7 ± 12.95 72.75 ± 24.6 56 ± 10.97 < 0.001
Psychomotor development index 91.88 ± 15.77 71.05 ± 18.41 72.5 ± 20.27 54 ± 8.30 < 0.001
Neurosensory impairment 2 (8) 7 (33.3) 3 (50) 10 (83.3) < 0.001
Cerebral palsy 9 (36) 16 (76.2) 6 (100) 12 (100) < 0.001

White-matter abnormality was graded according to the scoring system of Woodward et al. (11), which assessed the nature and extent of white-matter signal abnormalit the loss in the volume of periventricular white matter, and the extent of any cystic abnormalities, ventricular dilatation, or the thinning of the corpus callosum. Th categories of white-matter abnormality were none (a score of 5 to 6), mild (a score of 7 to 9), moderate (a score of 10 to 12), and severe (a score of 13 to 15). For MDI, the post hoc test showed significant differences between none vs severe (P < 0.001), and mild vs severe (P = 0.001). For PDI, the post hoc test showed significant differences between none vs mild (P < 0.001), and none vs severe (P < 0.001). MDI = Mental Development Index; PDI = Psychomotor Development Index Data are reported as the mean ± SD for continuous variables and frequency (percentage) for categorical variables. P-values were calculated by one-way ANOVA with Bonferroni's multiple comparison test for continuous variables and Fisher's exact test for categorical variables. P < 0.05 was taken to indicate significance.

Table 2.
Associations between DEHSI and Mental Development Score, Psychomotor Development Score, Presence of Neurosensory Impairment, and Cerebral Palsy
Variable DEHSI
with (n = 50) without (n = 14) P-value
Mental development index score 79.56 ± 18.21 80.67 ± 15.85 0.848
Psychomotor development index score 78.22 ± 21.57 77.18 ± 19.40 0.885
Neurosensory impairment 18 (36) 4 (28.6) 0.755
Cerebral palsy 35 (70) 8 (57.1) 0.520

DEHSI = diffuse excessive high signal intensity

Data are reported as the mean ± SD for continuous variables and frequency (percentage) for categorical variables.

P-values were calculated by independent two-samples t-test for continuous variables and Fisher's exact test for categorical variables.

P < 0.05 was taken to indicate significance.

Table 3.
Logistic Regression Analyses of Risk of Developing CP According to MR Features
Variable CP
Univariate   Multivariate  
OR (95% CI) P-value OR (95% CI) P-value
Cystic encephalomalacia 25.797 (1.343-495.548) 0.031 0.102 (0.004-2.482) 0.041
Punctate lesion 10.93 (2.72-74.05) 0.003 0.19 (0.034-0.833) 0.029
Loss of WM volume 19.68 (4.83-134.95) < 0.001 0.171 (0.036-0.824) 0.028
Ventricular dilation 19.68 (4.83-134.95) < 0.001 0.171 (0.036-0.824)  0.028 
DEHSI 1.75 (0.50-5.94) 0.368    
IVH 1.62 (0.95-2.83) 0.989    
Cerebellar hemorrhage 1.17 (0.29-5.91) 0.837    

CI = confidence interval; DEHSI = diffuse excessive high signal intensity; IVH = intraventricular hemorrhage; IVH = germinal matrix hemorrhage 3/4; OR = odds ratio; WM = white matter

P < 0.05 was taken to indicate significance.

Table 4.
Logistic Regression Analyses for Delayed Development on Bayley Scale According to MR Features
Variable Bayley scale
Univariate   Multivariate  
OR (95% CI) P-value OR (95% CI) P-value
Cystic encephalomalacia 11.90 (2.03-227.67) 0.023 0.256 (0.0.4-1.918) 0.085
Punctate lesion 1.42 (0.47-4.40) 0.532 1.432 (0.377-5.434) 0.198
Loss of WM volume 6.65 (2.09-24.44) 0.002 0.236 (0.060-0.933) 0.039
Ventricular dilation 6.65 (2.09-24.44) 0.002 0.236 (0.060-0.933) 0.039 
DEHSI 1.25 (0.34-4.58) 0.732    
IVH 6 (0.93-117.71) 0.109    
Cerebellar hemorrhage 1.47 (0.33-7.83) 0.621    

CI = confidence interval; DEHSI = diffuse excessive high signal intensity; IVH = intraventricular hemorrhage; IVH = germinal matrix hemorrhage 3/4; OR = odds ratio; WM = white matter

P < 0.05 was taken to indicate significance.

TOOLS
Similar articles