

 PDF
PDF ePub
ePub Citation
 Print
Print


INTRODUCTION
The leading cause of death worldwide is cardiovascular disease (CVD), and its primary cause is atherosclerosis.1) Complex inflammatory and immune responses contribute to the progression of atherosclerosis,2) with macrophages playing a pivotal role.3)4) Recently, sodium-glucose cotransporter-2 (SGLT-2) inhibitors have been developed as novel therapeutic agents for the treatment of patients with diabetes mellitus (DM). SGLT-2 is expressed primarily in the S1 and S2 segments of the kidney proximal tubule, where 90% of primary urinary glucose is resorbed.5)6) Several clinical trials have shown that dapagliflozin, one of the best-known SGLT-2 inhibitor drugs, can be used alone to treat DM patients, effectively lowering both fasting blood glucose and glycosylated hemoglobin. In addition to blood sugar normalization, dapagliflozin is known to improve CVD outcomes by reducing blood pressure, body weight, fat mass, triglyceride and uric acid levels, and improving insulin resistance.7)8)9)10) Other studies have reported that SGLT-2 inhibitors can reduce inflammatory responses and oxidative stress, thereby decreasing the progression of atherosclerosis in diabetic animal models.11)12)13) Together, these findings imply that SGLT-2 inhibitors have pleiotropic beneficial effects to ameliorate the progression of atherosclerosis and other CVD. However, detailed mechanisms of these effects have not been elucidated. Recently, it was reported that SGLT-2 inhibitors reduce the proportion of macrophage infiltration in atherosclerotic plaques through an unknown mechanism. It is an intriguing possibility that SGLT-2 inhibitors may affect macrophage polarization and expression of inflammatory cytokines. To address these questions, the present study aimed to evaluate the preventive effect of dapagliflozin on the development of atherosclerotic lesions in a normoglycemic rabbit model. Furthermore, we have investigated changes in polarization of M1 and M2 macrophages, as well as the expression of interleukin (IL)-1β, IL-6, tumor necrosis factor (TNF)-α, and other inflammatory mediators as potential components in the mechanism by which SGLT-2 inhibitors protect against atherosclerotic progression in non-diabetic conditions.
METHODS
Rabbit model of atherosclerosis
The local Institutional Animal Care and Use Committee (IACUC) of Yonsei University Health System approved the study protocol (IACUC: 2016-0157). A total of 26 male New Zealand white rabbits (3.0–3.5 kg) were acclimatized for one week, housed at room temperature with a 12-hour light cycle and free access to standard diet and water. At the start of the experiment (Figure 1), all rabbits were provided with a high-cholesterol diet (1% cholesterol; Dooyeol Biotech, Seoul, Korea), which was maintained for 8 weeks, followed by 2 weeks of normal diet. Surgery to induce the development of atherosclerotic lesions took place 1 week after initiating the cholesterol diet. After surgery, rabbits were randomly assigned to experimental and control groups (n=13 each). The experimental group was treated with SGLT-2 inhibitor (dapagliflozin, 1 mg/kg/day) for 8 weeks after surgery.
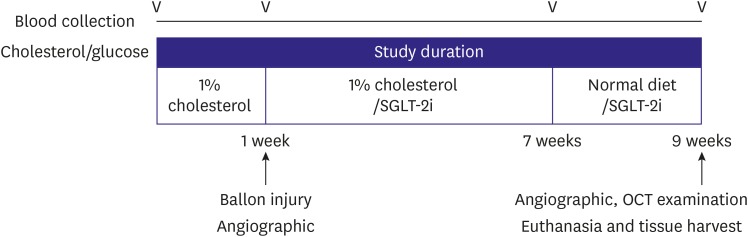
Figure 1
Schematic design of the study protocol. After 1 week of a high-cholesterol diet, balloon injury was induced in the abdominal aorta. Rabbits then received a SGLT-2i, depending on their group assignment, for 8 weeks. Blood was collected baseline and before sacrifice at the end. OCT was assessed at the end of the study, and then the aorta was harvested.
OCT = optical coherence tomography; SGLT-2i = sodium-glucose cotransporter-2 inhibitor.
![]()
The surgery to initiate atherosclerosis comprised endothelial denudation of the abdominal aorta using a balloon catheter. Animals were pretreated with antibiotics and analgesics. Anesthesia was induced by intramuscular injection of an appropriate mixture of Zoletil (0.2 mL/kg; Virbac New Zealand, Hamilton, New Zealand) and Rompun (0.1 mL/kg; Bayer, Leverkusen, Germany), then maintained with 1.5% isoflurane (Forane; JW Pharmaceutical, Seoul, Korea) and oxygen. Heparin (200 U/kg) was injected to maintain an activated clotting time >250 seconds before catheterization. Access to the aorta with a 30-mm-length balloon catheter was obtained through the carotid artery. Based on quantitative angiography, balloon over-inflation was applied 2 times, for 30 seconds each, with a balloon:vessel ratio of 1.2:1.0. Angiography and optical coherence tomography (OCT) were performed immediately post-procedure and again at the follow-up, 8 weeks post-procedure (Figure 1). At that time, animals were euthanized. After autopsy, affected arteries and other organs were collected for histology. A 30-mm section of aorta was dissected into 4 parts and stored for analyses.
Angiography analysis
Quantitative aorta angiography analysis was performed before modeling, and at the terminal procedure using the QAngio XA 7.1 Medis System (Medis Medical Imaging Systems, Leiden, The Netherlands). All angiograms were analyzed in an independent core laboratory (Cardiovascular Research Center, Seoul, Korea) using the same analysis method as in our previous study.14)
Optical coherence tomography analysis
OCT images were obtained using the LightLab Imaging C7-XR imaging system (St. Jude Medical, St. Paul, MN, USA), with contrast agent at a 1:1 ratio with saline. Data were acquired continuously and stored digitally for later analysis, as described previously.14)
Blood analysis
Blood samples were obtained from the ear vein of rabbits fasted overnight. Samples were collected prior to the start of the study and at the follow-up. Plasma levels of total cholesterol (TC), triglyceride, and low- and high-density lipoprotein cholesterol (LDL-C, HDL-C) were measured by DRI-CHEM 4000i (Fujifilm, Tokyo, Japan).
Morphological analysis
At the time of sacrifice, 5 mm of aorta tissue was fixed overnight in 10% normal buffered formalin before histological processing. Paraffin sections (4 μm) were cut on a microtome (Leica RM2235; Leica, Wetzlar, Germany), mounted on microscope slides (Fisherbrand Superfrost Plus; Fisher Scientific, Waltham, MA, USA), and stained with hematoxylin and eosin (H&E), Masson's trichrome, and Movat's pentachrome. For Oil Red O (ORO) lipid staining, frozen 5-mm specimens of vessel were sectioned (10 μm) on a microtome (Leica CM1860; Leica) and then mounted.
Immunohistochemical analysis
Macrophage and inflammation expression were evaluated by Immunohistochemical (IHC) analysis following a general IHC protocol. Tissue sections were immunostained at 4°C overnight with antibody against the macrophage marker RAM11 (DAKO, Santa Clara, CA, USA), or with antibodies against the inflammatory markers: TNF-α (ABCAM, Cambridge, United Kingdom), IL-1β (NOVUS, Littleton, CO, USA), or IL-6 (Santa Cruz Biotechnologies, CA, USA). The primary antibody was detected using a peroxidase-based kit (DAKO, Glostrup, Denmark), and visualized using 3,3′-diaminobenzidine substrate with enhancer (DAKO). The sections were subsequently counterstained with hematoxylin (DAKO). Digital images of the vessels were scanned using a SCN400 scanner (Leica), and histomorphometry was performed using LAS 4.2 software (Leica).
Immunofluorescence analysis using the confocal microscopy
Vessel tissue sections were micro-cut at room temperature, then deparaffinized through the dewatering process. Subsequently, the sections were triply immunostained at 4°C overnight with antibodies against CD68 (Thermo Scientific, Long Beach, NY, USA), inducible nitric oxide synthase (iNOS; Santa Cruz Biotechnologies) for M1 macrophages, and arginase-1 (Arg-1; Santa Cruz Biotechnologies) for M2 macrophages. The sections were washed for 10 minutes in 1% phosphate-buffered saline (PBS), and then incubated with fluorescein isothiocyanate, phycoerythrin, and Texas Red-conjugated secondary antibodies (Santa Cruz Biotechnologies), respectively, for 1 hour in the dark at room temperature. The sections were washed in PBS for 10 minutes, mounted with Fluoroshield containing 4′,6-diamidino-2-phenylindole (ImmunoBioscience, Mukilteo, WA, USA), and stored in the dark at 4°C. Phosphorylated NF-κB (pNF-κB, p65, sc-8008; Santa Cruz Biotechnologies) staining was performed in the same method. Confocal microscopy was performed with an LSM 700 system (Carl Zeiss, Oberkochen, Germany).
Real-time reverse transcription-polymerase chain reaction
Total RNA was isolated from a 10-mm length of aorta tissue using QIAzol reagent (QIAGEN, Hilden, Germany). Complementary DNA was synthesized using Quantitect Reverse Transcription Kit (QIAGEN), then real-time polymerase chain reaction (PCR) involving the use of the SYBR Green kit of 2X Fast Q-PCR Master Mix (SMOBIO, Hsinchu City, Taiwan). The following rabbit primer sequences were used: IL-1β, forward 5′-TTG AAG AAG AAC CCG TCC TCT G-3′ and reverse 5′-CTC ATA CGT GCC AGA CAA CAC C-3′; IL-6, forward 5′-CTA CCG CTT TCC CCA CTT CAG-3′ and reverse 5′-TCC TCA GCT CCT TGA TGG TCT C-3′; TNF-α, forward 5′-CTG CAC TTC AGG GTG ATC G-3′ and reverse 5′-CTA CGT GGG CTA GAG GCT TG-3′; iNOS, forward 5′- GAC GTC CAG CGC TAC AAT ATC C-3′ and reverse 5′-GAT CTC TGT GAC GGC CTG ATC T-3′; Arg-1, forward 5′-AAC CCA TCT CTG GGG AAA AC-3′ and reverse 5′-GTC AAT TGG CTT GTG ATT GC-3′; and glyceraldehyde 3-phosphate dehydrogenase (GAPDH), forward 5′-TGA CGA CAT CAA GAA GGT GGT G-3′ and reverse 5′-GAA GGT GGA GGA GTG GGT GTC-3′. The following mice primer sequences were used: IL-6, forward 5′-ACT TCC ATC CAG TTG CCT TCT TGG-3′ and reverse 5′-TTA AGC CTC CGA CTT GTG AAG TGG-3′; nuclear factor-kappa B (NF-κB), forward 5′-ACC ACT GCT CAG GTC CAC TGT C-3′ and reverse 5′-GCT GTC ACT ATC CCG GAG TTC A-3′; Toll-like receptor 4 (TLR4), forward 5′-GCT CCT GGC TAG GAC TCT GA-3′ and reverse 5′-TGT CAT CAG GGA CTT TGC TG-3′; TNF-α, forward 5′-GCG ACG TGG AAC TGG CAG AAG-3′ and reverse 5′-GCC ACA AGC AGG AAT GAG AAG AGG-3′; and β-actin, forward 5′-CGT TGA CAT CCG TAA AGA CC-3′ and reverse 5′-AAC AGT CCG CCT AGA AGC AC-3′. The conditions for real-time PCR were as follows: denaturation at 65°C for 2 minutes, 95°C for 10 minutes, then the 40 cycles at 95°C for 15 seconds and 60°C for 60 seconds, dissociation curve 95°C for 15 seconds, 60°C for 15 seconds and 95°C for 15 seconds. Relative mRNA levels were determined by comparison to GAPDH or β-actin mRNA: relative mRNA expression = 2[∆Ct(control)−∆Ct(target)].
Western blot analysis
Rabbit aorta (10 mm length) was lysed with radioimmunoprecipitation assay buffer (Biosesang, Seongnam, Korea) containing cOmplete Mini, ethylenediaminetetraacetic acid-free protease inhibitor cocktail (Roche, Basel, Switzerland). The protein samples were resolved by sodium dodecyl sulfate polyacrylamide gel electrophoresis and then electrotransferred to Immuno-Blot PVDF membrane (Bio-Rad, Hercules, CA, USA). Membranes were blocked with 5% skim milk (Noble Bio, Hwaseong, Korea) in 10% Tris-buffered saline containing Tween 20 (TBS-T) for 1 hour at room temperature. Membranes were incubated with primary antibodies against Arg-1 (BD Bioscience, San Jose, CA, USA), IL-6 (Santa Cruz Biotechnologies), iNOS (Santa Cruz Biotechnologies), TLR4 (Santa Cruz Biotechnologies), TNF-α (ABCAM), NF-κB (p65; Enzo Life Sciences, Farmingdale, NY, USA), and pNF-κB (p65; Santa Cruz Biotechnologies) 4°C overnight, washed with TBS-T. The incubated with horseradish peroxidase-conjugated secondary antibody for 1 hour room temperature, and then subjected to enhanced chemiluminescence (GE Healthcare, Chicago, IL, USA) detection. GAPDH was detected on the same membrane to serve as a loading control. Densitometry analysis was performed using Image J software (National Institutes of Health, Bethesda, MD, USA).
Cell culture
Cells of the mouse macrophage cell line Raw 264.7 were cultured in RPMI 1640 containing 10% fetal bovine serum (both from Biowest, Riverside, MO, USA), supplemented with 10% non-essential amino acids, 1% 2-mercaptoethanol, and 10% penicillin (all from Gibco, Carlsbad, CA, USA). Cells were maintained at 37°C in humidified air with 5% carbon dioxide. Inflammation analysis methods were the same as in our previous study.15) Before treatment, cells were washed twice with pH 7.4 PBS (Gibco). Cells were then incubated with 0.1 µg/mL lipopolysaccharide (LPS) for 1 hour, then with 2 mM ATP for 0.5 hour, followed by treatment with 30 µM dapagliflozin (Sigma-Aldrich, St. Louis, MO, USA). For NF-κB inhibition, QNZ (EVP4593; Selleckchem, Houston, TX, USA) was used as 0.1 µM for 1 hour pretreatment.
Cell transfection
The siRNA targeting mouse SGLT-2 (5′-UGUUCAGAACCAAUAGAGGCACAgt-3′) were synthesized by Bioneer (Daejeon, Korea) and the control siRNA was purchased from Santa Cruz Biotechnologies (Control siRNA-A). Then, the siRNAs were transfected to RAW264.7 cells using LipofectamineTM RNAiMAX (Invitrogen, Carlsbad, CA, USA) according to the manufacturer's recommendations and were incubated in cell culture medium for 4 hours. After transfection, medium was replaced with fresh medium for 1 day, and then the expression level of SGLT-2 was analyzed. Compared with control siRNA which showed a negligible effect on the SGLT-2 expression, SLGT-2 siRNA (30 nM) effectively suppressed the transcriptional and translational level of SGLT-2 (Supplementary Figure 1A and B).
Statistical analysis
Data are expressed as mean±standard error of the mean. Statistical analyses were performed using SPSS v23.0 (SPSS Inc., Chicago, IL, USA). Continuous variables were compared using one-way analysis of variance. The p values less than 0.05 were considered statistically significant.
RESULTS
Anti-atherosclerotic effects confirmed by angiographic and optical coherence tomography imaging analysis
Angiographic analysis at 8 weeks after balloon injury demonstrated significantly lower stenosis diameter in the SGLT-2 inhibitor-treated group than the control group (9.65±0.38% vs. 20.59±1.94%, p<0.001, Figure 2A). Figure 2B displays representative OCT images of lipid and macrophage accumulation in the plaques. This, too, showed significantly lower stenosis (as area percent) in the inhibitor-treated group (22.56±0.80% vs. 32.13±1.20%, p<0.001, Figure 2B).
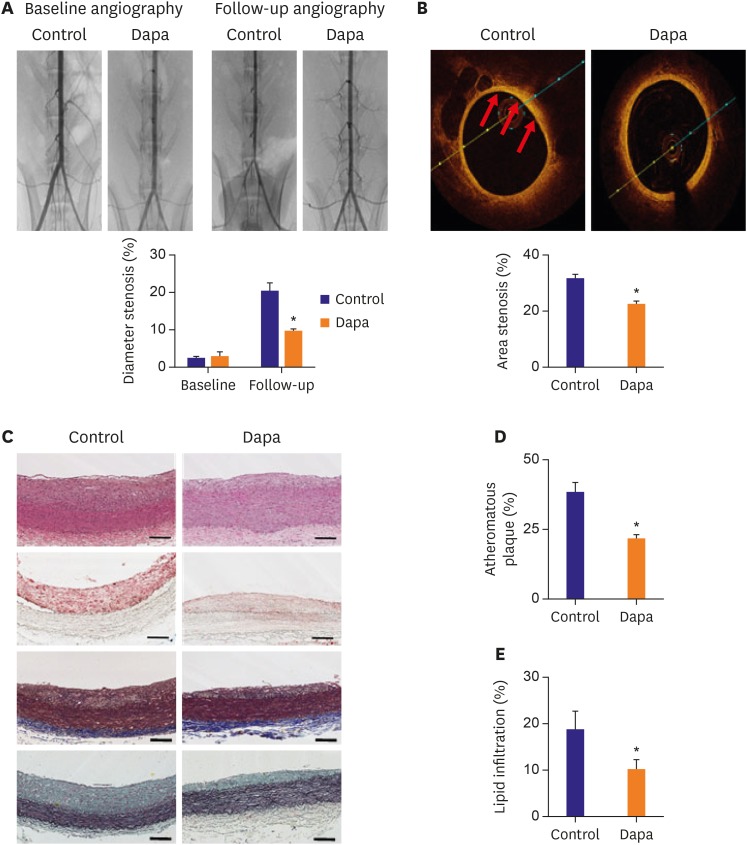
Figure 2
Imaging analyses for the progression of atherosclerosis. (A) Angiography compared diameter stenosis of each group at baseline and follow up. (B) OCT images showing area stenosis for each group. The red arrows point to the lipid. (C) Tissues were stained with H&E, ORO, trichrome and pentachrome. (D) Atheromatous plaque for vessels in each group. (E) Lipid accumulation of plaques analyzed by ORO staining. Scale bars represent 100 µm. Data are mean±standard error of the mean.
Dapa = dapagliflozin; H&E = hematoxylin and eosin; OCT = optical coherence tomography; ORO = Oil Red O.
*p<0.05 vs. Control group.
![]()
Blood lipids and histological analysis
There were no significant differences between the groups in body weight, blood glucose or plasma cholesterol levels at baseline, or at follow-up (Table 1). The lipid profile at follow-up, including TC and LDL-C were unaffected by SGLT-2 inhibitor treatment compared with the control group (TC, 381.43±106.89 mg/dL vs. 463.71±116.93 mg/dL, p=0.61; LDL-C, 336.76±102.75 mg/dL vs. 417.37±111.36 mg/dL, p=0.60). However, the atheromatous plaque ratio revealed by H&E and trichrome staining was substantially decreased in the SGLT-2 inhibitor-treated group compared to the control group (21.91±1.22% vs. 38.51±3.16%, p<0.001, Figure 2C and D). Lipid accumulation in aorta, by ORO staining, was also attenuated in the inhibitor-treated group (10.20±2.03% vs. 18.90±3.63%, p=0.047, Figure 2E).
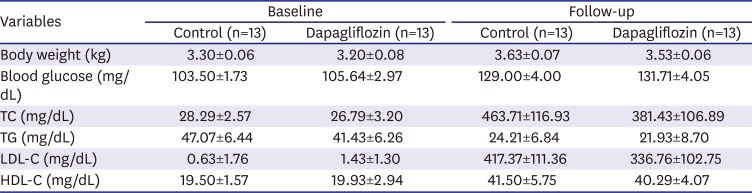
Table 1
Plasma lipid concentrations
Values are mean±standard error of the mean.
TC = total cholesterol; TG = triglyceride; LDL-C = low-density lipoprotein cholesterol; HDL-C = high-density lipoprotein cholesterol.
![]()
Immunohistochemical analysis to assess macrophage infiltration and expression of inflammatory markers
Macrophage infiltration plays a central role in the initiation and progression of atherosclerosis. Using IHC staining of RAM11 within plaques, we demonstrated that macrophage infiltration was significantly lower in the SGLT-2 inhibitor-treated group compared with the control group (13.69±2.17% vs. 17.00±2.50%, p=0.011, Figure 3A). The inflammatory content of plaques was assessed by immunostaining for TNF-α, IL-1β and IL-6, and we observed all 3 to be significantly decreased in the SGLT-2 inhibitor-treated group (TNF-α, 19.47±2.10% vs. 31.17±4.40%, p=0.025; IL-1β, 9.08±1.76% vs. 28.57±3.69%, p<0.001; IL-6, 10.17±1.02% vs. 19.88±3.11%, p=0.007, Figure 3B-D). These results together indicated that SGLT-2 inhibitor can reduce inflammatory processes in the milieu of atherosclerotic plaques.
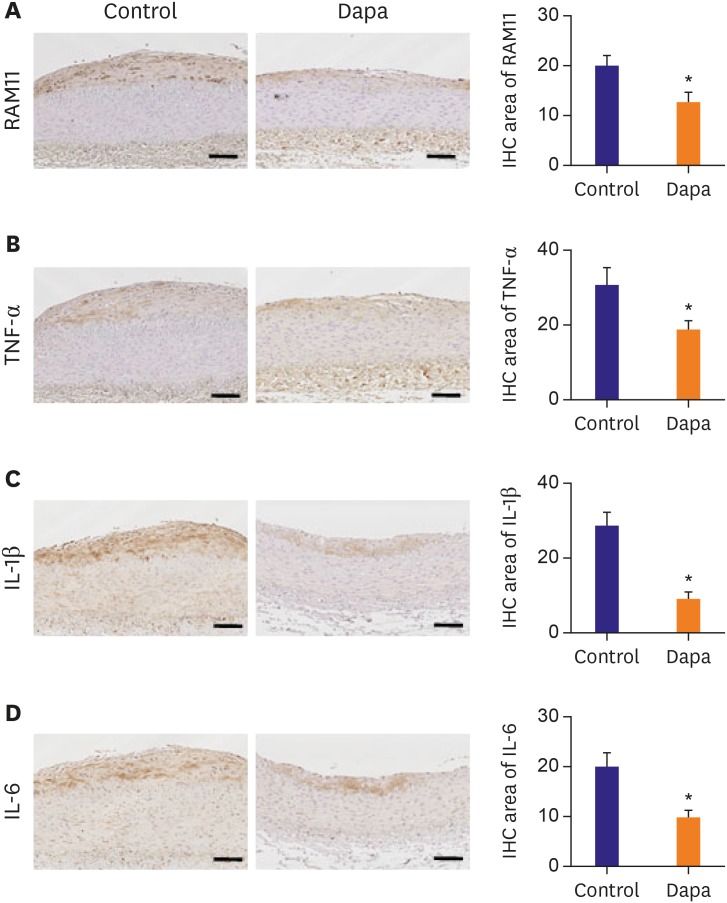
Figure 3
IHC staining of macrophage and inflammation markers. (A) Tissues immunologically stained of RAM11 positive area. (B) Tissues immunologically stained of TNF-α positive area. (C) Tissues immunologically stained of IL-1β positive area. (D) Tissues immunologically stained of IL-6 positive area. Scale bars represent 100 µm. Data are mean±standard error of the mean.
Dapa = dapagliflozin; IHC = immunohistochemical; IL = interleukin; TNF = tumor necrosis factor.
*p<0.05 vs. Control group.
![]()
Macrophage polarization in atherosclerotic plaques assessed by immunofluorescence stain
We used immunofluorescence co-stain to assess macrophage polarization within plaques (Figure 4A). The relative area containing M1-subtype macrophages, represented by iNOS+ staining, was somewhat lower in the SGLT-2 inhibitor-treated group compared with the control group (0.71±0.10% vs. 1.00±0.16%, p=0.130, Figure 4B). Conversely, the presence of M2 macrophages, revealed by Arg-1 staining, was significantly increased in the SGLT-2 inhibitor-treated group (2.43±0.64% vs. 1.00±0.27%, p=0.044, Figure 4C). Consequently, the Arg1/iNOS ratio was significantly greater in the SGLT-2 inhibitor-treated group compared with the control group (2.46±0.36% vs. 1.00±0.18%, p=0.001, Figure 4D), demonstrating a strong effect of SGLT-2 inhibitor on macrophage polarization. We further investigated whether SGLT-2 inhibitor treatment affects the activation of NF-κB, which is a well-recognized major regulator of inflammatory response in the vascular endothelial cells and macrophages by immunofluorescence staining for the pNF-κB. Nuclear localization of pNF-κB was shown to be mitigated in the aorta wall vascular cells of the rabbit administered with SGLT-2 inhibitor (Supplementary Figure 2A). Furthermore, in vitro experiment also demonstrated that SGLT-2 inhibitor treatment mitigated the nuclear localization of pNF-κB similar to that of NF-κB inhibitor (QNZ) treatment (Supplementary Figure 2B).
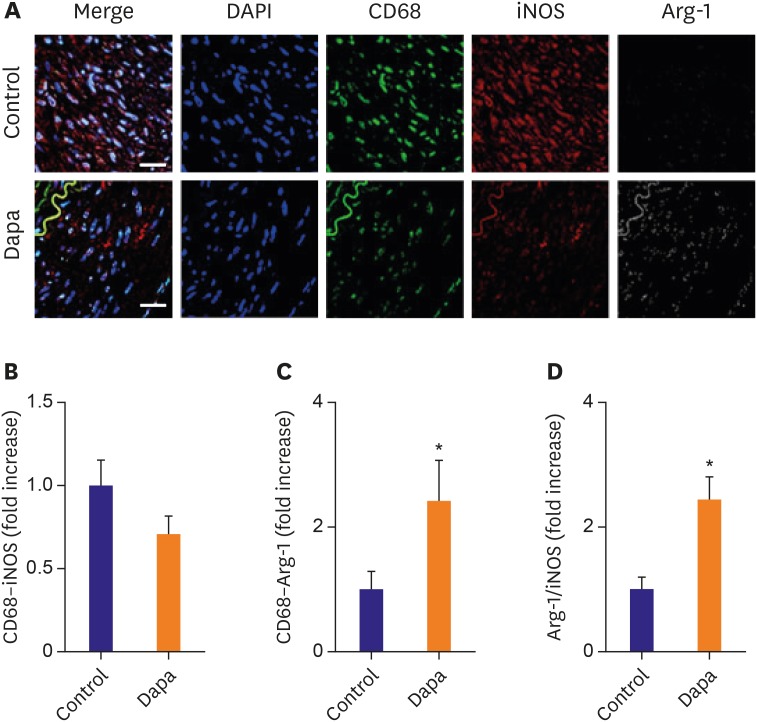
Figure 4
Macrophage polarization assessed by confocal immunofluorescence microscopy. (A) Confocal immunofluorescence microscopy showing CD68 (green), iNOS (red), and Arg-1 (white) localization in the same vessel. Blue represents 4′,6-diamidino-2-phenylindole staining of nuclei. (B) Relative area of CD68–iNOS staining in each group. (C) Relative area of CD68–Arg-1 staining in each group. (D) Arg-1/iNOS ratio in each group. n=10 (each slide of 3 sections). Relative area measurements were determined using a Zeiss LSM 700. Scale bars represent 100 μm. Data are mean±standard error of the mean.
Arg-1 = arginase-1; Dapa = dapagliflozin; DAPI = 4′,6-diamidino-2-phenylindole; iNOS = inducible nitric oxide synthase.
*p<0.05 vs. Control group.
![]()
Expression of inflammatory marker mRNA and protein in atherosclerotic plaques
IHC evidence for the effects of SGLT-2 inhibitor on inflammatory markers in atherosclerotic plaques was confirmed using molecular and immunobiochemical analyses. Relative mRNA expression levels of TNF-α, IL-1β, IL-6, iNOS, and Arg-1 in each group are presented in Figure 5. The expression of IL-1β mRNA were significantly decreased in the SGLT-2 inhibitor-treated group compared with the control group (IL-1β, 2.77±0.42 vs. 3.83±0.94, p=0.05, Figure 5A). IL-6, TNF-α and iNOS mRNA were somewhat lower in the SGLT-2 inhibitor-treated group compared with the control group (IL-6, 0.64±0.17 vs. 2.26±1.10, p=0.09; TNF-α, 0.61±0.12 vs. 0.95±0.19, p=0.59; iNOS, 0.35±0.12 vs. 1.02±0.63, p=0.1, Figure 5B-D). Conversely, mRNA expression of Arg-1, as well as the ratio of Arg-1/iNOS, were somewhat higher in the SGLT-2 inhibitor-treated group compared with the control group (Arg-1, 0.31±0.03 vs. 0.25±0.07, p=0.16; Arg-1/iNOS ratio, 3.43±0.93 vs. 1.75±0.44, p=0.02, Figure 5E and F). The results for protein expression of TNF-α, NF-κB, iNOS, and Arg-1 were similar to the results for relative mRNA expression (TNF-α, 0.65±0.12 fold vs. 1.00±0.14, p=0.068; NF-κB, 0.56±0.14 vs. 1.00±0.16, p=0.016; iNOS, 0.68±0.14 vs. 1.00±0.17, p=0.148; Arg-1, 1.47±0.28 vs. 1.00±0.16, p=0.156, Figure 5G-J). As a result, the ratio of Arg-1/iNOS protein was significantly greater in the SGLT-2 inhibitor-treated group compared with the control group (2.22±0.20 vs. 1.00±0.09, p<0.001, Figure 5K).
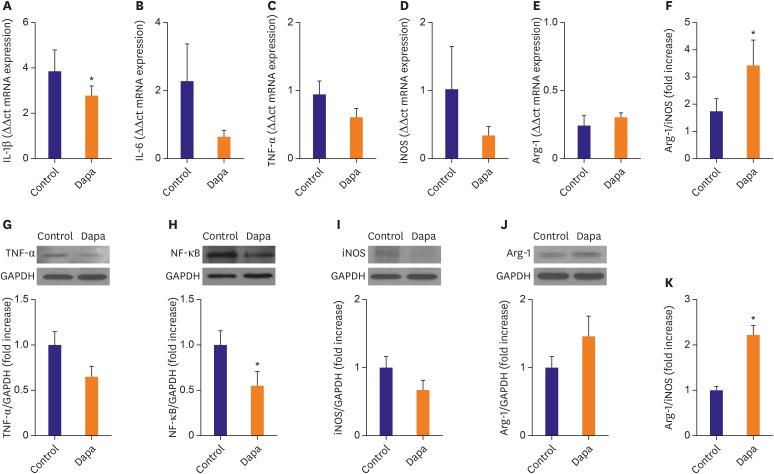
Figure 5
Real-time RT-PCR and Western blot analysis of aorta artery. (A-E) RT-PCR expression of IL-1β, IL-6, TNF-α, iNOS and Arg-1. Comparisons of relative mRNA expression, normalized to expression of GAPDH as the housekeeping gene. (F) mRNA expression of Arg-1/iNOS ratio. (G-J) Western blot expression of TNF-α, NF-κB, iNOS, and Arg-1. (K) Protein expression of Arg-1/iNOS ratio. Representative data showing mRNA and protein expression, normalized to expression of GAPDH as the housekeeping gene. Data in the bar graphs are quantified ratios of each signal relative to the signal for GAPDH, presented as fold increases. Data are mean±standard error of the mean.
Arg-1 = arginase-1; Dapa = dapagliflozin; GAPDH = glyceraldehyde 3-phosphate dehydrogenase; IL = interleukin; iNOS = inducible nitric oxide synthase; NF-κB = nuclear factor-kappa B; RT-PCR = reverse transcription-polymerase chain reaction; TNF = tumor necrosis factor.
*p<0.05 vs. Control group.
![]()
Treatment of RAW 264.7 macrophages with dapagliflozin reduces in vitro inflammatory marker expression
To confirm apparent anti-inflammatory effects of SGLT-2 inhibitor, we evaluated the expression profile of inflammatory markers in RAW264.7 macrophage cells after pretreatment with the inhibitor. Relative mRNA and protein levels in response to LPS are presented in Figure 6. LPS-induced expression of inflammatory mediators including TLR4, NF-κB, IL-6 and TNF-α were significantly attenuated by pre-treatment of SGLT-2 inhibitor (Figure 6A-D). Combinational treatment of cells with the NF-κB inhibitor QNZ plus SGLT-2 inhibitor resulted in significantly decreased expression of TLR4 and IL-6 protein compared with the LPS group (Figure 6F and H). The ratio of pNF-κB relative to total NF-κB (Figure 6G) and TNF-α protein expression (Figure 6I) were tended to be lower in SGLT-2 inhibitor-treated cells compared to LPS alone. To further investigate whether SGLT-2 inhibition directly affects the expression of major regulators of inflammatory responses, we conducted a knockdown experiment using siRNA for SGLT-2 transcripts (Supplementary Figure 1A and B). Compared with control siRNA which showed a negligible effect, SGLT-2 siRNA significantly decreased the transcriptional level of TLR (control siRNA versus SGLT-2 siRNA; 1.39±0.14 vs. 0.97±0.13, Supplementary Figure 1C and D) and NF-κB control siRNA versus SGLT-2 siRNA; 2.32±0.66 vs. 1.73±0.54, Supplementary Figure 1E).
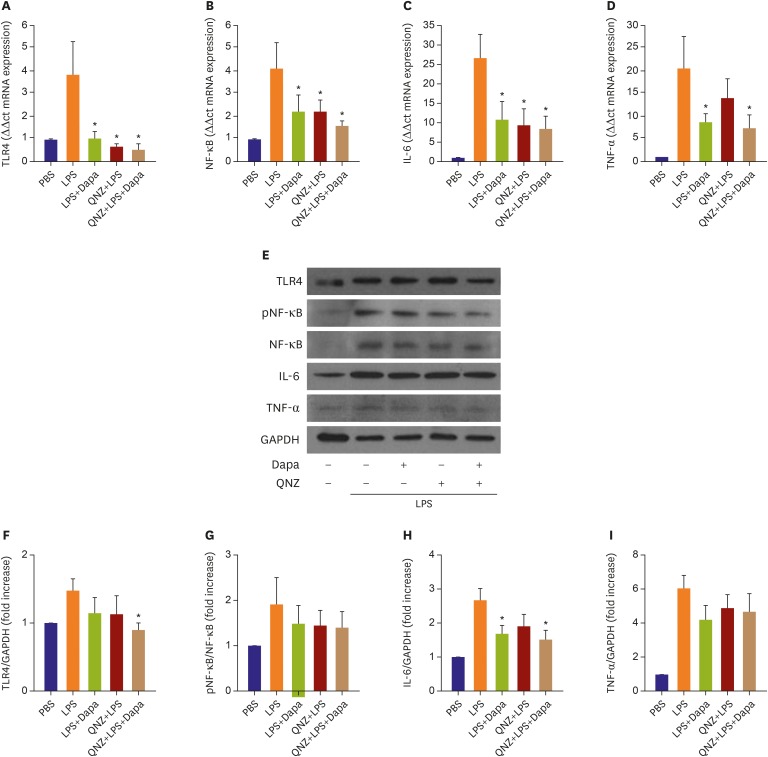
Figure 6
RT-PCR and Western blot analysis of RAW264.7. (A-D) RT-PCR expression of TLR4, NF-κB, IL-6 and TNF-α. Comparisons of relative mRNA expression, normalized to expression of β-actin as the housekeeping gene. (E) Western blot expression of TLR4, NF-κB, IL-6 and TNF-α. (F-I) Comparisons of relative protein expression, normalized to expression of GAPDH as the housekeeping gene. Data in the bar graphs are quantified ratios of the each signal relative to the signal for housekeeping gene, presented as fold increases. Data are mean±standard error of the mean (n=6 per group).
Dapa = dapagliflozin; GAPDH = glyceraldehyde 3-phosphate dehydrogenase; IL = interleukin; LPS = lipopolysaccharide; NF-κB = nuclear factor-kappa B; RT-PCR = reverse transcription-polymerase chain reaction; TLR4 = Toll-like receptor 4;TNF = tumor necrosis factor.
*p<0.05 vs. LPS group.
![]()
DISCUSSION
To our knowledge, this study is the first to demonstrate that treatment with SGLT-2 inhibitor reduces development of atherosclerotic lesions in the normoglycemic rabbit model. Lipid accumulation, intimal proliferation, and pro-inflammatory marker levels were all suppressed by SGLT-2 inhibitor treatment, suggesting the drug exerts multiple beneficial anti-atherosclerotic effects.
Previous clinical studies have indicated that some anti-diabetic and lipid-lowering drugs, such as statins and fibrates, reduce the risk of cardiovascular events in diabetic patients.16) Recently, dapagliflozin has been recognized as a potent anti-diabetic drug, which inhibits renal glucose reabsorption by blocking SGLT-2 in the renal proximal tubule.17) Clinical and preclinical studies have reported beneficial effects of SGLT-2 inhibitors in preventing cardiovascular and atherosclerosis disease.12)18) The detailed mechanism by which SGLT-2 exerts anti-atherosclerotic effects, and whether this is a consequence of normalizing the blood sugar level, had not been elucidated. By conducting both angiography and OCT examinations in the present study, we found that SGLT-2 inhibitor treatment markedly mitigated the progression of atherosclerotic plaque in the normoglycemic rabbit model in vivo. We confirmed that lipid accumulation and foam cell formation in the aorta were significantly reduced by the treatment of SGLT-inhibitor in this animal model. However, interestingly, SGLT-2 inhibitor treatment did not affect blood lipid profiles, implying that SGLT-2 inhibitors might have a direct therapeutic effect to prevent atherosclerosis.
Atherosclerosis is recognized as a chronic inflammatory disease, at all stages of which macrophages play a central role.3)14) M1 macrophages promote atherosclerotic plaque development, by promoting monocyte recruitment into plaques, and by foam cell formation.19) In contrast, M2 macrophages reduce atherosclerotic plaque size, cholesterol content, and macrophage infiltration, as well as decreasing inflammatory marker expression.20)21)22) To gain further insight into anti-atherosclerotic effects of SLGT-2 inhibitor in the normoglycemic rabbit model, we conducted comprehensive immunohistological analyses. These analyses revealed that SGLT-2 inhibitor treatment markedly reduced macrophage infiltration, as well as the expression of inflammatory M1 markers, including TNF-α, IL-1β and IL-6, which have pivotal roles in the progression of atherosclerosis.23)24) Our analysis also showed that SGLT-2 inhibitor treatment markedly augmented the expression of Arg-1, an important M2 macrophage marker. Our results are consistent with SGLT-2 inhibitor treatment promoting a more favorable inflammatory milieu, which suggests a potential mechanism for the known anti-atherosclerotic effects of SGLT-2 inhibitors.
In support of such a mechanism, we showed that dapagliflozin reduced Raw264.7 macrophage cell expression of TLR4 and NF-κB, both well-established upstream regulators of inflammatory responses, resulting in reduced expression of IL-6 and TNF-α. To clarify whether immunomodulatory effect of dapagliflozin mainly depends on the blocking activity against the SGLT-2 rather than non-canonical receptor, we conducted a knockdown experiment targeting SGLT-2 of murine macrophage cell lines (RAW264.7) which modestly expresses SGLT-2. Intriguingly, SGLT-2 siRNA treatment markedly suppressed the transcriptional activity of TLR4, implying the direct association between SGLT-2 and inflammatory response. In accordance with our findings, previous in vitro studies have demonstrated that SGLT-2 is expressed in macrophages,25) and that treatment of macrophages with SGLT-2 inhibitor markedly suppresses expression of inflammatory cytokines.26)27) Furthermore, Mancini and colleagues have reported that canagliflozin, a potent SGLT-2 inhibitor similar to dapagliflozin, has been reported to suppress the expression of inflammatory cytokines in the vascular endothelial cells by regulating IκB kinase (IKK)/IκB/NF-κB signaling pathway through adenosine monophosphate-activated protein kinase-dependent protein kinase.26) Given that NF-κB is known to up-regulate the expression of inflammatory mediators including TLR4 in the nucleus upon activation by the inflammatory stimuli,27) it is presumable that SGLT-2 inhibitor possesses an indirect immunomodulatory effect via IKK/IκB/NF-κB signaling pathway, as well as direct association with TLR4 signaling pathway, which should be further clarified by following studies. Those findings, taken together with ours, support our hypothesis that SGLT-2 inhibitors exert a second protective effect against atherosclerosis, which is distinct from their blood sugar lowering effect, and which involves direct regulation of monocyte/macrophages. To extend this concept of SGLT-2 inhibitor action to human atherosclerosis, further in vivo studies of patient samples will be required.
There were several limitations to our study. First, further studies are needed to confirm the proposed mechanism by which the drug suppresses atherosclerosis. Second, additional mechanistic studies are required to determine whether SGLT-2 is directly or indirectly involved. Despite these limitations, our study has been valuable in demonstrating that SGLT-2 inhibitor treatment suppressed atherosclerosis in the normoglycemic rabbit model, and in its implication that SGLT-2 inhibitors convey important therapeutic benefits beyond the normalization of blood sugar. We suggest that SGLT-2 inhibitors may potentially be useful in improving CVD outcomes even for patients without diabetes.
 XML Download