

 PDF
PDF ePub
ePub Citation
 Print
Print


INTRODUCTION
Staphylococcus aureus is the leading cause of various community- and hospital-acquired infections, including those of the skin and soft tissue, respiratory system, blood, bone, and prosthetic joints.12 Vancomycin, the first glycopeptide antimicrobial agent, is an antibiotic commonly prescribed for treating life-threatening infections caused by Gram-positive bacteria, including S. aureus.3 However, in recent decades, vancomycin treatment failure has become a major clinical problem in patients with serious methicillin-resistant S. aureus (MRSA) infections.45 Several studies have suggested that both MRSA strains exhibiting increased vancomycin minimum inhibitory concentrations (MICs) and hetero-resistant vancomycin-intermediate S. aureus (h-VISA) are associated with treatment failure and mortality.678
Since the 1980s, the clinical use of generic medicines has increased; however, systematic evaluation of their therapeutic efficacies in comparison to those of their respective innovators is lacking.910 To date, no country has required a demonstration of the therapeutic equivalence of generic formulations of parenteral antibiotics. Recent studies have investigated the efficacies of generic vancomycin products in vivo11 and indicated that some generics are less efficacious than the innovators,121314 while others are of similar efficacy.151617
Although concerns for the in vivo therapeutic equivalence of generic vancomycin products have emerged, few studies have compared the pharmacokinetics (PK) or pharmacodynamics (PD) of vancomycin and generics thereof available outside of the US. In this study, we compared the in vivo PK and PD of generic vancomycin products available in Korea with those of the innovator.
MATERIALS AND METHODS
Ethics
All animal experiments were approved by the Chonnam National University Institutional Review Board (CNU IACUCH-2015-13). All procedures were performed in accordance with the guidelines of the Animal Care and Use Committee of Chonnam National University.
Bacteria, reagents, and in vitro susceptibility tests
The antibacterial efficacies of generic vancomycin products were investigated using S. aureus ATCC 29213 (vancomycin MIC=1 mg/L) and Mu3 (h-VISA; vancomycin MIC=2 mg/L). Bacteria were cultured overnight on Mueller-Hinton agar plates. A few colonies were suspended in cation-adjusted MuellerHinton II broth and grown to mid-log phase. The bacterial suspensions were diluted to the desired concentrations and used immediately. The in vitro MIC and minimum bactericidal concentration (MBC) of each product were determined via broth microdilution following the guidelines of the Clinical and Laboratory Standards Institute.18 The MICs of the innovator and five generics were evaluated simultaneously, as were the MBCs of all products. All tests were performed in duplicate.
Vancomycin products
Vancocin CP (Eurofarma Laboratorios Ltda, Sao Paulo, Brazil), produced using the original methods of Eli Lilly and Company, was used throughout the study. Eli Lilly earlier terminated vancomycin production and sold the brand name to several manufacturers worldwide, a deal which generated changes in the Korean market. Innovex Pharma Korea (Seoul, Republic of Korea), currently Menarini Pharma Korea, then commercialized the Vancocin CP produced by Eurofarma Laboratorios Ltda.
Five generic vancomycin products commercially available in the Republic of Korea were evaluated: CJ-vancomycin hydrochloric acid (HCl) (CheilJedang Pharmaceuticals, Incheon, Republic of Korea); Hanomycin (Samjin Pharmaceuticals, Hwaseong, Republic of Korea); Pfizer-vancomycin (Xellia Pharmaceuticals, Copenhagen, Denmark); Dong-A vancomycin HCl (Dong-A Pharmaceuticals, Cheonan, Republic of Korea); and Huons-vancomycin HCl (BCWorld Pharmaceuticals, Yeoju, Republic of Korea). Vancomycin products were obtained from the pharmacy departments of university hospitals, not from the drug makers or sellers.
Vancomycin factor B concentrations and product purity
We measured vancomycin factor B concentrations and the purities of all products via high-pressure liquid chromatography (HPLC) (Shimadzu, Kyoto, Japan) at the Chonnam National Hospital Clinical Trial Center. In brief, the HPLC platform consisted of a dual solvent pump (model LC-20AD), autosampler (model SIL-20AC), column oven (model CTO-20AC), UV/VIS detector (model SPD-20A), and communication bus module (model CBM-20A). We used a LUNA C18(2) column (particle size 5 µm, 250×4.6 mm; Phenomenex, Torrance, CA, USA) fitted with a Security Guard C18 Cartridge (4×3.0 mm) operating at 40℃ to separate vancomycin factor B from any impurities via gradient elution. The flow rate of the mobile phase containing a mixture (50:50 v/v) of solvents A (acetonitrile) and B (acetonitrile with 5 mM KH2PO4, pH 3.0) was 1 mL/min. The initial 10% (v/v) of solvent B was increased to 22% (v/v) B over 15 min and then decreased back to 10% (v/v) over 6 s. The injection volume was 20 µL, and the eluted products were detected at 280 nm. Shimadzu LC solution software was used for data analysis. In preliminary work, we evaluated a vancomycin reference standard, purchased from the U.S. Pharmacopeia (USP; Rockville, MD, USA), and the impurity CDP-1, purchased from Carbosynth Ltd (Compton, Berkshire, UK).
Animal experiments
We used 6-week-old, pathogen-free, ICR female mice (weight 24–28 g) from the Institute for Cancer Research (Samtako, Osan, Republic of Korea). The animals were anesthetized by intraperitoneal injection of 100 µL of phosphate-buffered saline containing 2 mg of ketamine and 0.2 mg of xylazine. Mice were rendered neutropenic by two intraperitoneal injections of cyclophosphamide (Sigma-Aldrich, St. Louis, MO, USA) administered 4 days (150 mg/kg) and 1 day (100 mg/kg) prior to PK/PD evaluation, as described previously.19
Single-dose serum PK in neutropenic mice
Six groups of 24 neutropenic mice not infected by S. aureus were administered a single dose (100 mg/kg in 200 µL saline) of each vancomycin product subcutaneously. Blood samples for PK analyses were obtained from subgroups of four animals at 0.25, 1, 2, and 4 hr. At each time point, animals were anesthetized and then euthanized by cervical dislocation. Blood was collected from individual mice by cardiac puncture.172021222324 Each animal constituted a single data point. All experiments were repeated 10 times for subgroups of each product. Serum was obtained by centrifugation of the blood sample at 10000×g for 5 min; all samples were stored at −70℃ prior to analysis. Vancomycin concentrations were determined via liquid chromatography (API 4000Q TRAP; AB SCIEX, Foster City, CA, USA) performed at the Chonnam National University Hospital Clinical Trial Center. PK parameters were calculated by a one-compartment analysis after determination of the antibiotic concentration at the different time points. The innovator and the five generics were evaluated simultaneously.
Thigh-infection model with neutropenic mouse and in vivo PD
Both thighs of neutropenic mice were inoculated with 100 µL of log-phase cultures containing 108 (high-level) or 104 (low-level) S. aureus ATCC 29213 or Mu3. Two hours later, vancomycin was injected subcutaneously at 25, 50, 100, 200, or 400 mg/kg of body weight; this was repeated three times at 6 h intervals. Three mice per experiment served as controls (no vancomycin). After 24 hr, animals were anesthetized and then euthanized by cervical dislocation. Then, the thighs were aseptically dissected and homogenized, and the suspensions were serially diluted and plated for bacterial counts. The innovator and the five generics were evaluated simultaneously. All experiments were repeated three times, and the data were subjected to statistical analysis.
Statistical analysis
Phoenix NLME 1.3 (Certara, St. Louis, MO, USA), a population PK modeling software, was used to fit the data to a one-compartment model exhibiting first-order absorption and elimination. The population PK parameter estimates were used to obtain the area under the curve (AUC), maximum concentration (Cmax), and half-life. Bioequivalence was considered present when the 90% confidence interval (CI) of the geometric mean ratio (Test/Reference) was 80–125%. We did not round off the CI values; therefore, to pass this test, the CI had to be at least 80% and no more than 125%, as required by drug regulatory agencies.2526 A p value ≤0.1 was considered to indicate statistical significance in the AUC and Cmax comparisons, in line with the recommendations of drug regulatory agencies.
In terms of PD, we calculated the net antibacterial effect (E, the dependent variable) of each drug dose (D, the independent variable) by subtracting the colony-forming units (CFU)/g of the untreated control mice (at 24 h) from that of mice treated for 24 h. Since E is a measure of bacterial killing, E is negative, except when bacterial growth actually exceeds that in the untreated mice. Least-squares nonlinear regression produced three PD parameters describing the dose effects. These parameters were subjected to further nonlinear regression using the Hill sigmoid model to estimate the maximal effect (Emax), the effective dose needed to attain 50% of the Emax (ED50), and the slope (N) for each product (SigmaPlot 10.0; Systat Software Inc., San Jose, CA, USA) according to the following equation:

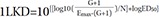
The secondary PD profiles reflect the exact potency of a product. We computed the in vivo doses (mg/kg/day) required to attain a net bacteriostatic effect (BD) and to kill the first log of bacteria (1LKD). The net bacterial growth (G) of the untreated controls (CFU/g at 24 h–CFU/g at 0 h) was used to replace E when the antibiotic prevented BD or allowed attainment of the 1LKD. The secondary PD parameters were derived using the following equations:

Primary and secondary PD parameters were compared by curve-fitting analysis (GraphPad Prism 5.0; GraphPad Software Inc., San Diego, CA, USA).12 A p value ≤0.05 was considered to reflect statistical significance.
RESULTS
In vitro susceptibility tests
The MICs of the six vancomycin products acting against the S. aureus strains ATCC 29213 and Mu3 were 1 and 2 mg/L, respectively. The MBCs of the six vancomycin products acting against the S. aureus strains ATCC 29213 and Mu3 were 2 and 4 mg/L, respectively. No differences were observed among the products.
Levels of vancomycin factor B and impurities
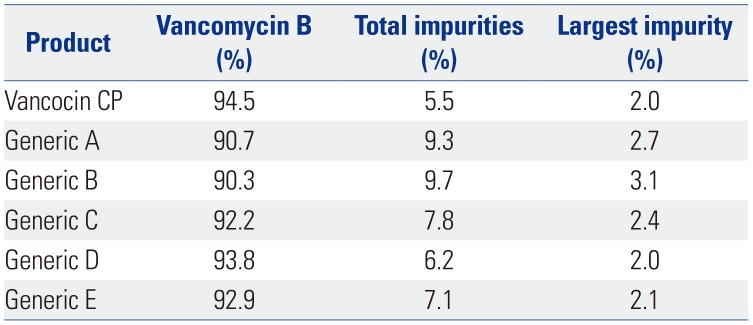
All vancomycin products were subjected to purity testing. We measured the baseline resolutions between crystalline degradation product atropisomers (CDP-1 m and CDP-1 M) and vancomycin factor B (Fig. 1). A vancomycin factor B calibration curve (1–20 mg/L) was used to evaluate the linearity of the assay. In a preliminary experiment, the mean linear regression equation was Y=0.184079 X+0.0107533 (coefficient of determination [R2]=0.9995).
The levels of vancomycin B, all impurities, and any principal impurities were calculated as area percentages (Table 1). The generics had low proportions of vancomycin B (range: 90.3–93.8%) and high proportions of impurities (range: 6.2–9.7%), compared with the innovator (94.5% and 5.5%, respectively). However, all products met the USP standard of containing at least 80% (w/w) vancomycin factor B and no more than 9% (w/w) of any impurity.
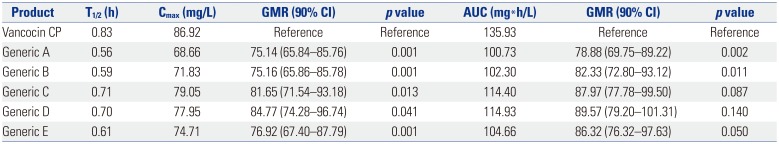
In vivo single-dose serum PK
The PK values in the sera of neutropenic mice after subcutaneous administration of single doses of each of the six tested products (100 mg/kg) are shown in Table 2. The Cmax values of each generic were lower than that of the innovator (all p<0.1), and the 90% CIs of all generic products failed to fall within the 80–125% range. The geographic mean AUC ratios of generics A, B, C, and E were significantly lower than that of the innovator (all p<0.1), and the 90% CIs of these four products did not fall within the 80–125% range.
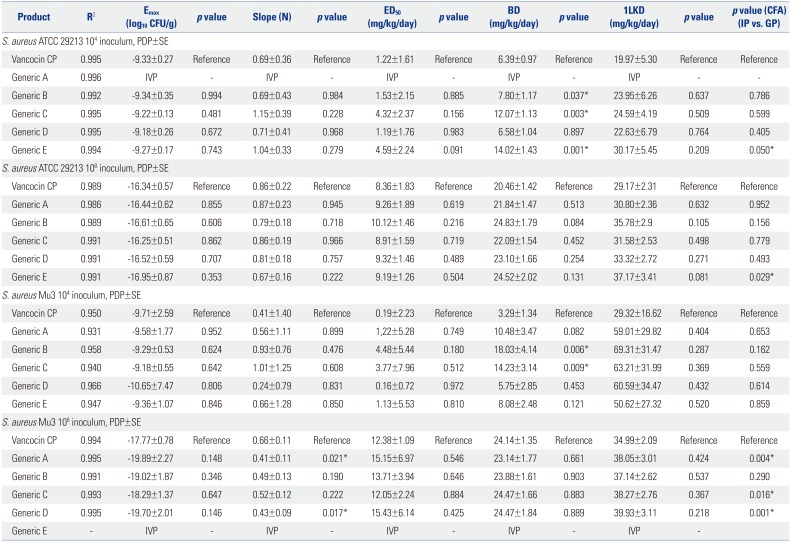
In vivo PD data derived using the neutropenic mouse thigh-infection model
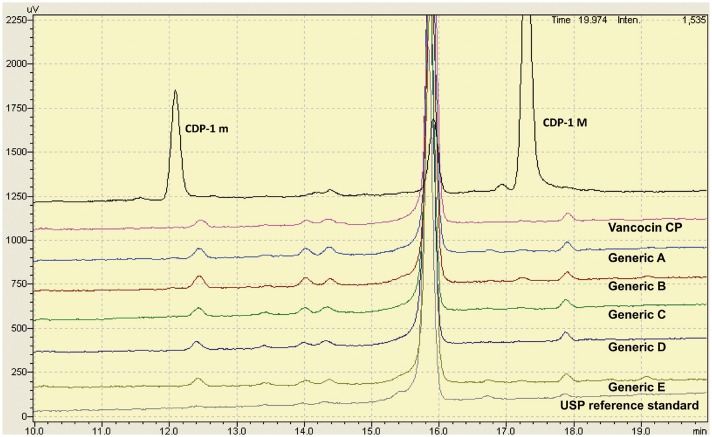
The dose effects of the generics were compared with that of the innovator (25–400 mg/kg per day) using a neutropenic mouse thigh-infection model injected with low and high levels of S. aureus strains ATCC29213 and Mu3. All PD parameters are shown in Table 3 and Fig. 2. The Emax values of all six products did not differ significantly (Table 3). The PD profile curves of generics A, C, and D did not differ from that of innovator in mice injected with low and high levels of ATCC 29213 and low level of Mu3; however, they did differ from that of the innovator in mice injected with a high level of Mu3 (all p≤0.05) (Fig. 2, Table 3). The PD profile curves of generic E differed significantly from that of the innovator in mice injected with low and high levels of ATCC 29213 (p≤0.05) (Table 3).
We also compared the secondary PD parameters (ED50, BD, and 1LKD) of the generics with those of the innovator. The ED50 and 1LKD were similar between the products. However, the BDs of generics B, C, and E differed significantly from that of the innovator in mice injected with low levels of ATCC 29213 (all p<0.05) (Table 3). The BDs of generics B and C also differed significantly from that of the innovator in mice injected with low levels of Mu3 (both p<0.05) (Table 3).
DISCUSSION
We found that the vancomycin generics available in Korea exhibit PK profiles inferior to that of the innovator. The Emax values did not differ significantly; however, the PD profile curves of some generic products in high inoculum h-VISA infection differed significantly from that of the innovator. About 30 vancomycin products are available in Korea, of which six were used in this study. Vancomycin accounts for 11% of the innovator (vancocin CP), 16% of generic A, 6% of generic B, and about 1% of generics C, D, and E (from the year of the study, 2013–2016).
Antibiotics are produced via chemical synthesis or fermentation, with those produced by the former method generally being purer. When antibiotics are produced by fermentation, the desired component, structurally similar components, and degradation products often coexist, despite the use of several purification steps. Thus, the quality of generics (including vancomycin) has been a concern, and the contents of the preparations vary depending on the refining processes used.272829 Impurities that are structurally similar to vancomycin, but exhibit reduced activities, include monodechloro-vancomycin, dimethyl-vancomycin, agluco-vancomycin, desvancosaminyl-vancomycin, desamino-vancomycin B, CDP-1M, and CDP-1m. All competitively inhibit vancomycin B activity.
We found that the generics had 0.7–4.2% less vancomycin B and more impurities, compared with the innovator, although all products surpassed the criteria of the USP. We explored whether these differences affected in vivo PK and PD parameters. The single-dose PK parameters of the generics were inferior to those of the innovator, and generics exhibiting reduced Cmax values and AUCs in vivo tended to have a lower vancomycin factor B content. Our results are in contrast to those of previous studies1217 that found no significant differences in PK parameters, possibly explained by the vancomycin doses used (10–50 mg/kg). We injected vancomycin at 100 mg/kg, as suggested by a previous study.19 A mouse vancomycin dose of 100 mg/kg is equivalent to a human dose of 8.1 mg/kg.30 The usual therapeutic dose of vancomycin used in patients is 7.5 to 15 mg/kg/dose (500–1000 mg/dose). It is known that a serum trough concentration of 10–15 µg/mL of vancomycin is recommended for the treatment of serious S. aureus infections, and some experts recommend 15–20 µg/mL. There are several reports that show a correlation between the AUC and the outcome of MRSA infections. For this reason, a physician must test the serum trough concentration of vancomycin and adjust doses appropriately.31 We found that the in vivo Cmax values and the AUCs of the generics were inferior to those of the innovator, suggesting that Cmax and AUC may be reduced in some patients treated with generics, despite the purity profiles meeting the USP criterion. Clinically speaking, PK parameters, including AUC/MIC ratio, can affect the treatment outcomes of MRSA infections; thus, further human studies are needed to evaluate the associations between the levels of vancomycin factor B in generics and serum concentrations in patients.
In our experiments, vancomycin treatment was given subcutaneously every 6 h, in accordance with previous PD models with mice;1719 however, some experts recommend a q3h dosing schedule of vancomycin for animal experiments28 to reach the required T>MIC of vancomycin for maximum efficacy and not to undermine the power to detect significant differences in in vivo efficacy between the products. We found that the in vivo half-lives of all products tested were 0.56–0.83 h; no significant differences were observed, consistent with a previous study using injection of 100 mg/kg vancomycin.1924 Some previous studies using lower drug dose injections reported shorter half-lives: the half-life of vancomycin is dependent on the dose injected, increasing with an increase in dose.19
The in vivo efficacies of vancomycin generics have been evaluated in previous studies. Vesga, et al.12 showed that one generic had a low in vivo Emax and anti-h-VISA action in mice compared with the innovator.13 However, other investigators found no in vivo differences between generics and the innovator.151617 Tattevin, et al.32 and Louie, et al.17 compared the activities of six injected vancomycin generics in a rabbit model and a neutropenic mouse thigh-infection model, and no differences in efficacy were noted. We found that the Emax of six vancomycin products did not differ when high and low levels of ATCC 29213 and Mu3 were injected into mice. However, the levels of generics, compared with the innovator, required to achieve bacteriostasis in mice administered low levels of ATCC 29213 and Mu3 were higher than that of the innovator, and the generics exhibited inferior dose-effect relationships in the high-level h-VISA model of infection. Meanwhile, we did note that Emax, slope (N), and ED50 did not differ significantly between the innovator and the generic drugs, although the PD profile curves of some generic products in high inoculum h-VISA infection differed significantly from that of the innovator. The results seem to suggest that the differences in efficacy are primarily due to PK differences and possibly due to the low proportion of vancomycin B in generic products, compared to the innovator. While our data do suggest that the maximum drug effects do not differ among vancomycin generics and the innovator, when using some generic products, higher doses may be required, especially in patients with h-VISA infections. Further human PD studies are required to determine whether our mouse data can be replicated in humans with MRSA or h-VISA infections.
 XML Download