

 PDF
PDF ePub
ePub Citation
 Print
Print


Chan Mi Heo1, ∗, Tae Jun Kim1, ∗, Hyuk Lee1 , Jeung Hui Pyo2, Yang Won Min1, Byung-Hoon Min1, Jun Haeng Lee1, Hee Jung Son1, 2, Sun-Young Baek3, Kyunga Kim3, Seungho Ryu4, Poong-Lyul Rhee1, Jae J. Kim1
, Jeung Hui Pyo2, Yang Won Min1, Byung-Hoon Min1, Jun Haeng Lee1, Hee Jung Son1, 2, Sun-Young Baek3, Kyunga Kim3, Seungho Ryu4, Poong-Lyul Rhee1, Jae J. Kim1
Abstract
Background/Aims
An association between obesity and erosive esophagitis has been reported, but the effects of sarcopenia and obesity on erosive esophagitis are unknown. This study examined the relationship between obesity, sarcopenia, sarcopenic obesity, and erosive esophagitis in a large population of asymptomatic men and women.
Methods
This study analyzed 32,762 subjects who underwent a comprehensive health checkup, which included upper gastrointestinal endoscopy, from August 2006 to December 2011 by a cross-sectional study. Sarcopenia was defined as a decrease in the appendicular skeletal muscle mass (ASM)/body weight value of two SD or more below the normal means for a younger reference group.
Results
The study was carried out on four groups according to obesity and sarcopenic status: normal, obesity, sarcopenic, and sarcopenic obese group. In a multivariable model, the risk of erosive esophagitis was higher in the obese (adjusted OR [aOR] 1.35, 95% CI 1.22-1.49), sarcopenic (aOR 2.12, 95% CI 1.40-3.19), and sarcopenic obese groups (aOR 1.54, 95% CI 1.27-1.87) than in the normal group. The risk of erosive esophagitis was higher in the sarcopenic and sarcopenic obese groups than the obese group; the ORs were 1.63 (95% CI 1.08-2.47) and 1.22 (95% CI 1.01-1.46), respectively. In dose-response analysis, in-creasing sarcopenia severity showed a positive and graded relationship with the overall, Los Angeles (LA)-B or higher grade, and LA-C erosive esophagitis.
Go to : 
References
1. Peery AF, Dellon ES, Lund J, et al. Burden of gastrointestinal disease in the United States: 2012 update. Gastroenterology. 2012; 143:1179–1187.e3.

2. El-Serag HB, Sweet S, Winchester CC, Dent J. Update on the epidemiology of gastro-oesophageal reflux disease: a systematic review. Gut. 2014; 63:871–880.
3. Lagergren J. Influence of obesity on the risk of esophageal disorders. Nat Rev Gastroenterol Hepatol. 2011; 8:340–347.
4. Turati F, Tramacere I, La Vecchia C, Negri E. A meta-analysis of body mass index and esophageal and gastric cardia adenocarcinoma. Ann Oncol. 2013; 24:609–617.
5. Edelstein ZR, Farrow DC, Bronner MP, Rosen SN, Vaughan TL. Central adiposity and risk of Barrett's esophagus. Gastroenterology. 2007; 133:403–411.
6. Rubenstein JH, Kao JY, Madanick RD, et al. Association of adiponectin multimers with Barrett's oesophagus. Gut. 2009; 58:1583–1589.
7. Anggiansah R, Sweis R, Anggiansah A, Wong T, Cooper D, Fox M. The effects of obesity on oesophageal function, acid exposure and the symptoms of gastro-oesophageal reflux disease. Aliment Pharmacol Ther. 2013; 37:555–563.
8. Robertson EV, Derakhshan MH, Wirz AA, et al. Central obesity in asymptomatic volunteers is associated with increased intra-sphincteric acid reflux and lengthening of the cardiac mucosa. Gastroenterology. 2013; 145:730–739.
9. Souza RF, Huo X, Mittal V, et al. Gastroesophageal reflux might cause esophagitis through a cytokine-mediated mechanism rather than caustic acid injury. Gastroenterology. 2009; 137:1776–1784.
10. Gomes MJ, Martinez PF, Pagan LU, et al. Skeletal muscle aging: influence of oxidative stress and physical exercise. Oncotarget. 2017; 8:20428–20440.
11. Beaudart C, Zaaria M, Pasleau F, Reginster JY, Bruyère O. Health outcomes of sarcopenia: a systematic review and meta-analysis. PLoS One. 2017; 12:e0169548.
12. Chin SO, Rhee SY, Chon S, et al. Sarcopenia is independently associated with cardiovascular disease in older Korean adults: the Korea National Health and Nutrition Examination Survey (KNHANES) from 2009. PLoS One. 2013; 8:e60119.
13. Hu YB, Chen Z, Fu RQ. The association between sarcopenia and nonalcoholic fatty liver disease. J Hepatol. 2017; 66:243–244.
14. Kim TN, Choi KM. The implications of sarcopenia and sarcopenic obesity on cardiometabolic disease. J Cell Biochem. 2015; 116:1171–1178.
15. Nardelli S, Lattanzi B, Torrisi S, et al. Sarcopenia is risk factor for development of hepatic encephalopathy after transjugular intrahepatic portosystemic shunt placement. Clin Gastroenterol Hepatol. 2017; 15:934–936.
16. Petta S, Ciminnisi S, Di Marco V, et al. Sarcopenia is associated with severe liver fibrosis in patients with nonalcoholic fatty liver disease. Aliment Pharmacol Ther. 2017; 45:510–518.
17. Voron T, Tselikas L, Pietrasz D, et al. Sarcopenia impacts on short- and long-term results of hepatectomy for hepatocellular carcinoma. Ann Surg. 2015; 261:1173–1183.
18. Kim TJ, Sinn DH, Min YW, et al. A cohort study on Helicobacter pylori infection associated with nonalcoholic fatty liver disease. J Gastroenterol. 2017; 52:1201–1210.
19. Rangel Peniche DB, Raya Giorguli G, Alemán-Mateo H. Accuracy of a predictive bioelectrical impedance analysis equation for esti-mating appendicular skeletal muscle mass in a non-Caucasian sample of older people. Arch Gerontol Geriatr. 2015; 61:39–43.
20. Janssen I, Heymsfield SB, Ross R. Low relative skeletal muscle mass (sarcopenia) in older persons is associated with functional impairment and physical disability. J Am Geriatr Soc. 2002; 50:889–896.
21. Kim YS, Lee Y, Chung YS, et al. Prevalence of sarcopenia and sarcopenic obesity in the Korean population based on the Fourth Korean National Health and Nutritional Examination Surveys. J Gerontol A Biol Sci Med Sci. 2012; 67:1107–1113.
22. Lee SY, Park HS, Kim DJ, et al. Appropriate waist circumference cutoff points for central obesity in Korean adults. Diabetes Res Clin Pract. 2007; 75:72–80.
23. Lundell LR, Dent J, Bennett JR, et al. Endoscopic assessment of oesophagitis: clinical and functional correlates and further validation of the Los Angeles classification. Gut. 1999; 45:172–180.
24. Stenholm S, Harris TB, Rantanen T, Visser M, Kritchevsky SB, Ferrucci L. Sarcopenic obesity: definition, cause and consequences. Curr Opin Clin Nutr Metab Care. 2008; 11:693–700.
25. Walston JD. Sarcopenia in older adults. Curr Opin Rheumatol. 2012; 24:623–627.
26. Corley DA, Kubo A. Body mass index and gastroesophageal reflux disease: a systematic review and meta-analysis. Am J Gastroenterol. 2006; 101:2619–2628.
27. El-Serag H. The association between obesity and GERD: a review of the epidemiological evidence. Dig Dis Sci. 2008; 53:2307–2312.
28. Murray L, Johnston B, Lane A, et al. Relationship between body mass and gastro-oesophageal reflux symptoms: the Bristol Helicobacter Project. Int J Epidemiol. 2003; 32:645–650.
29. Lee H, Lim Y, Chi S, et al. Relationship between obesity and development of erosive reflux disease: a mediation analysis of the role of cardiometabolic risk factors. Sci Rep. 2017; 7:6375.
30. Singh S, Sharma AN, Murad MH, et al. Central adiposity is associated with increased risk of esophageal inflammation, metaplasia, and adenocarcinoma: a systematic review and meta-analysis. Clin Gastroenterol Hepatol. 2013; 11:1399–1412.e7.
31. Lee YY, McColl KE. Disruption of the gastroesophageal junction by central obesity and waist belt: role of raised intra-abdominal pressure. Dis Esophagus. 2015; 28:318–325.
32. Baumgartner RN. Body composition in healthy aging. Ann N Y Acad Sci. 2000; 904:437–448.
33. Myint PK, Welch AA. Healthier ageing. BMJ. 2012; 344:e1214.
34. Zamboni M, Mazzali G, Fantin F, Rossi A, Di Francesco V. Sarcopenic obesity: a new category of obesity in the elderly. Nutr Metab Cardiovasc Dis. 2008; 18:388–395.
35. Lee SW, Youm Y, Lee WJ, et al. Appendicular skeletal muscle mass and insulin resistance in an elderly Korean population: the Korean social life, health and aging project-health examination cohort. Diabetes Metab J. 2015; 39:37–45.
36. Lim S, Kim JH, Yoon JW, et al. Sarcopenic obesity: prevalence and association with metabolic syndrome in the Korean Longitudinal Study on Health and Aging (KLoSHA). Diabetes Care. 2010; 33:1652–1654.
37. Srikanthan P, Hevener AL, Karlamangla AS. Sarcopenia ex-acerbates obesity-associated insulin resistance and dysglyce-mia: findings from the National Health and Nutrition Examination Survey III. PLoS One. 2010; 5:e10805.
38. Chung SJ, Kim D, Park MJ, et al. Metabolic syndrome and visceral obesity as risk factors for reflux oesophagitis: a cross-sectional case-control study of 7078 Koreans undergoing health checkups. Gut. 2008; 57:1360–1365.
39. Wu P, Ma L, Dai GX, et al. The association of metabolic syndrome with reflux esophagitis: a case-control study. Neurogastroenterol Motil. 2011; 23:989–994.
40. Dunbar KB, Agoston AT, Odze RD, et al. Association of acute gastroesophageal reflux disease with esophageal histologic changes. JAMA. 2016; 315:2104–2112.
41. Beyer I, Mets T, Bautmans I. Chronic low-grade inflammation and age-related sarcopenia. Curr Opin Clin Nutr Metab Care. 2012; 15:12–22.
42. Bosaeus I, Wilcox G, Rothenberg E, Strauss BJ. Skeletal muscle mass in hospitalized elderly patients: comparison of measure-ments by single-frequency BIA and DXA. Clin Nutr. 2014; 33:426–431.
43. Marini E, Buffa R, Saragat B, et al. The potential of classic and specific bioelectrical impedance vector analysis for the assessment of sarcopenia and sarcopenic obesity. Clin Interv Aging. 2012; 7:585–591.
Go to :
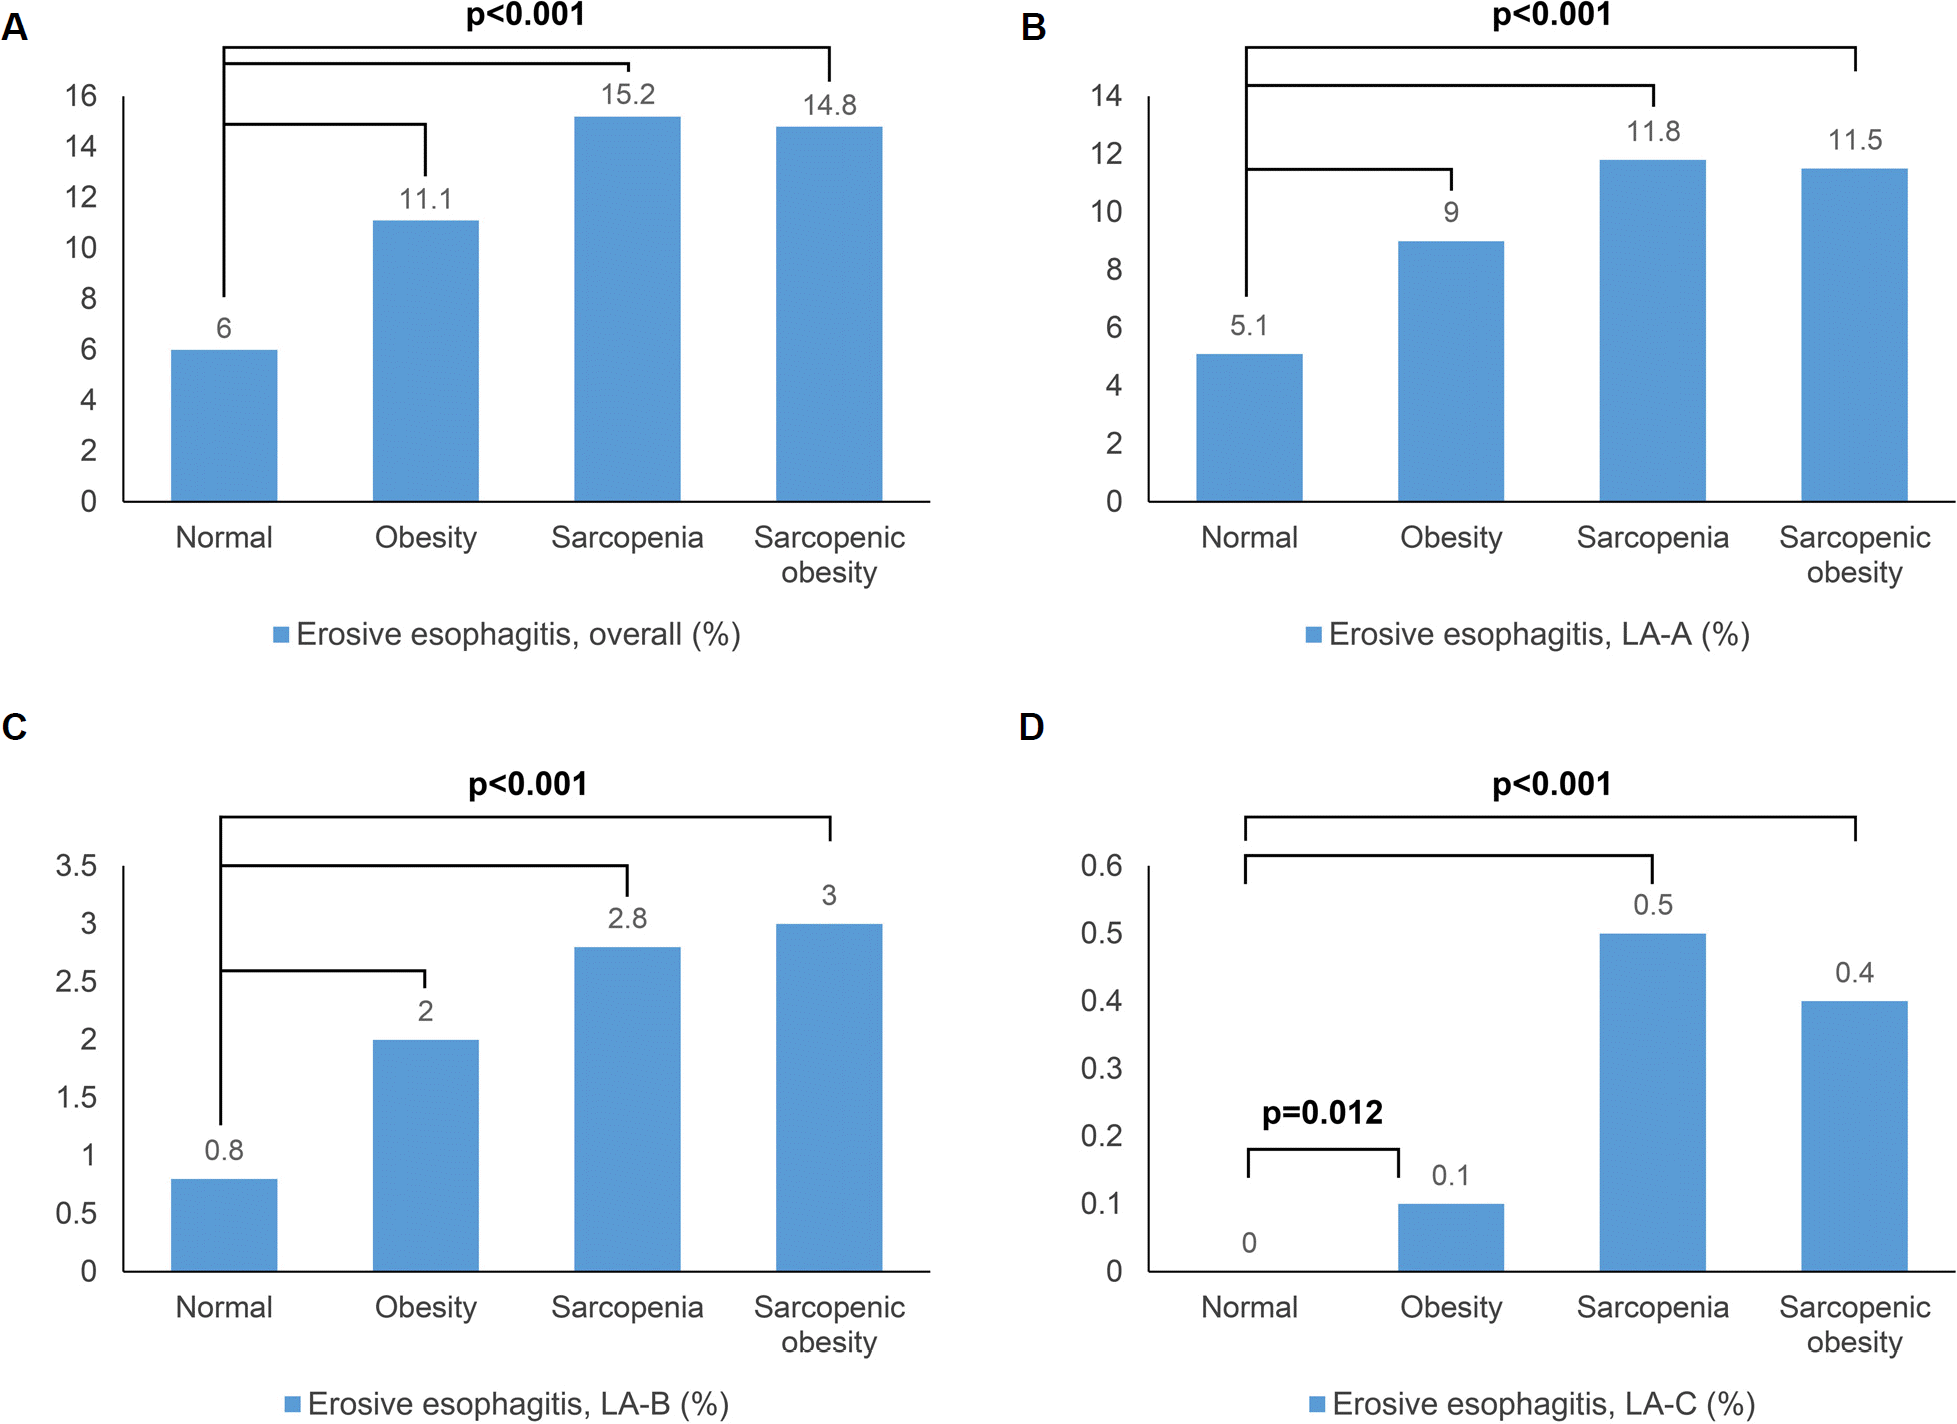 | Fig. 1.(A-D) Prevalence of erosive esophagitis by the Los Angeles (LA) classification according to the sarcopenia and obesity status. |
Table 1.
Baseline Characteristics of the Study Participants according to the Obesity and Sarcopenia Status
Table 2.
Risk of Erosive Esophagitis according to Sarcopenia and Obesity Status
| Subgroup | Normal OR | Obese OR (95% CI) | Sarcopenic OR (95% CI) | Sarcopenic obese OR (95% CI) | p-value |
|---|---|---|---|---|---|
| Crude model | 1.00 (reference) | 1.95 (1.79-2.12) | 2.80 (1.92-4.09) | 2.72 (2.29-3.24) | <0.001 |
| Model 1 a | 1.00 (reference) | 1.53 (1.40-1.67) | 2.23 (1.51-3.29) | 1.93 (1.61-2.30) | <0.001 |
| Model 2 b | 1.00 (reference) | 1.46 (1.33-1.59) | 2.33 (1.57-3.46) | 1.82 (1.51-2.18) | <0.001 |
| Model 3 c | 1.00 (reference) | 1.44 (1.31-1.57) | 2.28 (1.54-3.39) | 1.75 (1.45-2.11) | <0.001 |
| Model 4 d | 1.00 (reference) | 1.36 (1.23-1.49) | 2.17 (1.45-3.24) | 1.63 (1.35-1.97) | <0.001 |
| Model 5 e | 1.00 (reference) | 1.35 (1.22-1.49) | 2.12 (1.40-3.19) | 1.54 (1.27-1.87) | <0.001 |
Table 3.
The Risk of Erosive Esophagitis for Sarcopenic and Sarcopenic Obese Group Compared to the Obese Group
|
Model 1 a |
Model 2 b |
Model 3 c |
||||
|---|---|---|---|---|---|---|
| OR (95% CI) | p-value | OR (95% CI) | p-value | OR (95% CI) | p-value | |
| Obese | 1.00 (reference) | 1.00 (reference) | 1.00 (reference) | |||
| Sarcopenic | 1.46 (0.99-2.15) | 0.05 | 1.63 (1.09-2.45) | 0.02 | 1.63 (1.08-2.47) | 0.02 |
| Sarcopenic obese | 1.26 (1.05-1.51) | 0.01 | 1.25 (1.04-1.52) | 0.02 | 1.22 (1.01-1.46) | 0.04 |
Table 4.
Risk of Erosive Esophagitis by LA Classification according to the Sarcopenia Status
|
Multivariable-adjusted OR (95% CI) |
|||
|---|---|---|---|
| ≥ LA-A | ≥ LA-B | ≥ LA-C | |
| Cutoff values for sarcopenia | |||
| Normal | 1.00 (reference) | 1.00 (reference) | 1.00 (reference) |
| Class I sarcopenia a | 1.12 (1.01-1.24) | 1.28 (1.02-1.61) | 2.41 (0.91-6.43) |
| Class II sarcopenia b | 1.35 (1.12-1.63) | 1.54 (1.05-2.28) | 4.21 (1.06-16.76) |
| p for trend | 0.004 | 0.034 | 0.048 |
| Per 1% decrease in ASM/weight | 1.03 (1.01-1.05) | 1.06 (1.00-1.11) | 1.32 (1.07-1.52) |
| Central obesity | |||
| No | 1.00 (reference) | 1.00 (reference) | 1.00 (reference) |
| Yes | 1.35 (1.23-1.48) | 1.57 (1.28-1.93) | 2.37 (0.94-5.96) |
| p-value | <0.001 | <0.001 | 0.068 |
Values are presented as median (range). A multivariable model was adjusted for age, sex, waist circumference, smoking status, alcohol intake, regular exercise, co-morbidities and/or medication use, aspirin use, sedatives use, systolic blood pressure, triglycerides, HDL-cholesterol, fasting glucose, and the status of hiatal hernia.
LA, Los Angeles; OR, odds ratio; CI, confidence interval; ASM, appendicular skeletal muscle mass; HDL, high-density lipoprotein.
Table 5.
Risk of Erosive Esophagitis by Sarcopenia and Obesity Status in Clinically-relevant Subgroups
 XML Download