

 PDF
PDF ePub
ePub Citation
 Print
Print


INTRODUCTION
Gastric cancer is characterized by tumor tissue heterogeneity and aggressive biological behavior [1]. The development and establishment of new drugs including targeted drugs on selected patients and tumors with certain molecular profiles is of major importance for successful gastric cancer treatment. Thus, diagnostic accuracy and therapy response assessment is essential for tailored clinical approaches aiming to improve the poor outcome in advanced gastric cancer. The clinical utility of 18-fluordesoxyglucose positron emission tomography ([18F]-FDG-PET) in gastric cancer, however, remains controversial, especially due to the aforementioned tumor heterogeneity. Contrarily, it remains a commonly used diagnostic tool especially in doubtful clinical findings and several studies have showed that glucose transporter overexpression in gastric cancer is a rationale for glucose metabolism imaging [2345]. While earlier attempts to predict therapeutic responses in gastric cancer using [18F]-FDG-PET (computer tomography [CT]) had failed, recent results have suggested that [18F]-FDG-PET/magnetic resonance imaging (MRI) may improve diagnostic accuracy [678]. [18F]-FDG-PET is further under investigation for detecting peritoneal metastasis in advanced gastric cancer in a prospective observational trial [9]. In order to improve the clinical use of [18F]-FDG-PET/MRI and gain more knowledge about the molecular features of glucose metabolism, a preclinical [18F]-FDG-PET model is highly desired. Such a model may help to better investigate the prediction of therapy response, diagnostic accuracy, and establish profiles for reasonable patient selection based on biological characteristics.
This study aimed to establish a preclinical [18F]-FDG-PET/MRI gastric cancer patient-derived xenograft (PDX) model using subcutaneous and orthotopically implanted gastric cancer tissue.
Go to : 
MATERIALS AND METHODS
Orthotopic and heterotopic PDX model
All procedures involving in vivo mouse studies were approved by the Institutional Animal Care and Use Committee (IACUC) at Seoul National University and complied with the Guide for the Care and Use of Laboratory Animals (SNU-170704-3). Female BALB/c nu/nu mice aged 6–8 weeks (Orient Bio., Sungnam, Korea) were used to establish the mouse tumor models. To minimize the murine stromal contamination in PDX models and patient characteristic loss [101112], we used PDX tissues with early passage numbers (P2 or P3).
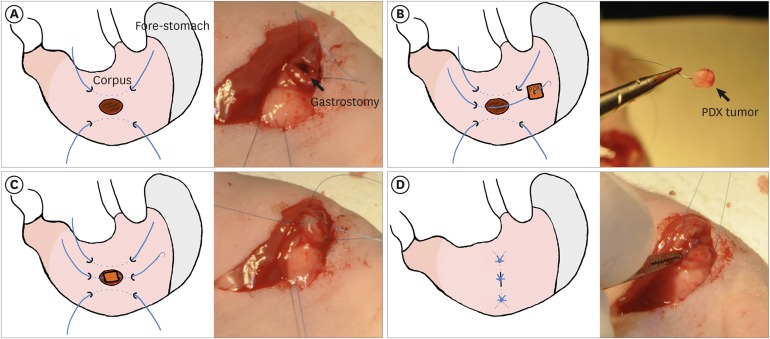
The orthotopic tumor was implanted under general gas anesthesia. The mice were placed in the right supine position and the whole abdominothoracic area was disinfected. The stomach was exposed by a transverse subcostal incision. A 7-0 nonabsorbable monofilament suture was applied seromuscular in a longitudinal direction of the corpus of the stomach. This suture was first used as the stay suture to expose the stomach during implantation and afterwards to cover the implantation site. The implantation site was chosen in the corpus part of the stomach in the middle of the stay suture, therefore the border to squamous cell epithelium had to be identified safely before. Then a small gastrotomy was performed by micro-scissor, ensuring that the mucosa is exposed. After one edge of the gastrotomy was caught by another 7-0 suture, the PDX tissue (size approximately 27 mm3) was beaded on the thread and positioned on the gastrotomy. The corresponding edge was sutured and then gently tied over the PDX tissue. It had to be ensured that the PDX tissue connected to the mucosa but did not completely subside in the lumen. Next, the longitudinal stay suture was tied over the implantation site in order to completely cover it. Two other 7-0 sutures were applied cranial and caudal to the first one. If the implantation site was completely covered, the abdominal cavity was closed by 4-0 an absorbable polyfilament suture in 2 layers: abdominal muscle layer and skin (Fig. 1). A sham model was performed with similar technique without tumor implantation.
The heterotopic PDX model was prepared in a standardized manner by implanting the tumor tissue via subcutaneous trocar into the right or left flank. For PET imaging, the optimal location of the tumor tissue should not overlap with the kidney or heart location in order to receive a clear signal discrimination. In this case, the tumor is located caudal to the heart and cranial to the ipsilateral kidney.
The clinicopathological features of the donor patients for the PDX tissues used in the orthotopic and heterotopic mouse models are summarized in Table 1.
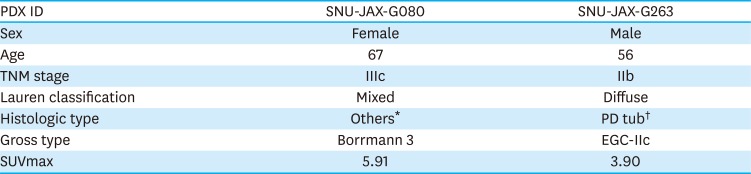
Table 1
Clinicopathological characteristics of the donor patients
| PDX ID | SNU-JAX-G080 | SNU-JAX-G263 |
|---|---|---|
| Sex | Female | Male |
| Age | 67 | 56 |
| TNM stage | IIIc | IIb |
| Lauren classification | Mixed | Diffuse |
| Histologic type | Others* | PD tub† |
| Gross type | Borrmann 3 | EGC-IIc |
| SUVmax | 5.91 | 3.90 |
EGC = early gastric cancer; TNM = tumour, node and metastasis; SUVmax = maximal standardized uptake value.
*Mixed carcinoma (mixed tubular adenocarcinoma, moderately differentiated [60%] and poorly cohesive carcinoma [40%]); †Tubular adenocarcinoma, poorly differentiated.
![]()
Sham-orthotopic model
A sham orthotopic tumor model was prepared as the control using the identical procedure as that for orthotopic tumor implantation, eventually not implanting the tumor. The models were scanned in intervals and the images were evaluated for signal/uptake changes due to inflammation. A longitudinal scanning was also performed for the orthotopic tumor model for the same reason.
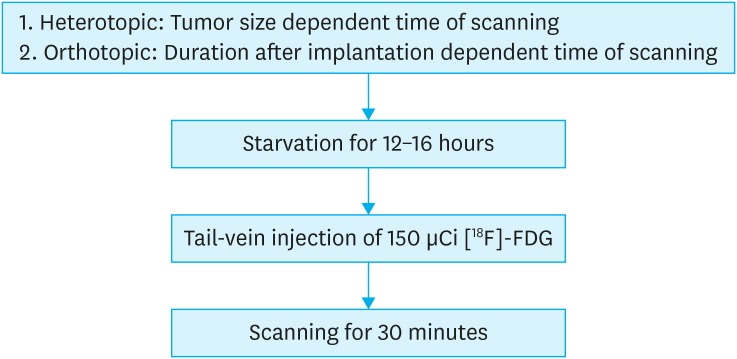
[18F]-FDG-PET/MRI imaging
The mice were starved for 12–16 h and subsequently anesthetized with 2% isoflurane (Hana Pharm, Kyonggi-Do, Korea) before injecting 150 μCi/0.1 mL [18F]FDG, produced using Seoul National University Hospital Cyclotron facilities. The body temperature was kept at 20-30°C throughout the whole procedure [13].
Animals were scanned for simultaneous PET/MRI imaging using the SimPET simultaneous PET/MRI scanner (Aspect Imaging, Shoham, Israel) [14]. [18F]-FDG was intravenously injected into the tail vein with an uptake time of 1 hour. The urinary bladder was emptied before imaging in order to reduce artefacts.
The final imaging protocol used was as follows:
• Simultaneous PET/MRI scans were acquired for 30 minutes. MRI imaging protocol consisted of T2-weighted fast spin echo sequences with 3,070 ms repetition time and 63.8 ms echo time. The acquired PET images were reconstructed with the 3 dimensional ordered subset expectation maximization algorithm.
• Acquired PET and MRI images were spatially registered for the FDG standard uptake value (SUV) evaluation in the tumor sites.
To determine the adequate [18F]-FDG dose, longitudinal PET/MRI imaging at different intervals after [18F]-FDG injection was carried out. Four mice baring heterotopic tumors were injected with higher [18F]-FDG dose (545±5.6 μCi/0.1 mL). The images were captured 1, 3, and 5 hours after injection. The corresponding [18F]-FDG dose was calculated with respect to the half-life of F-18, 109.8 minutes [15].
Image and statistical analyses
The PET/MRI images were converted into digital imaging and communications in medicine files and analyzed with OsiriX MD (Food and Drug Administration certified; Pixmeo, Bernex, Switzerland). The maximal standardized uptake value (SUVmax) was measured by volume of interests (VOIs). The VOIs were drawn based on the MRI images and tumor glucose metabolism was measured from the PET images. The FDG retention was also quantified in hind leg muscles and liver tissues in order to illustrate changes over time and correlate with tumor signal.
The statistical analysis and figure calculation were performed using GraphPad Prism (GraphPad Software 8.1.2; GraphPad Software Inc., San Diego, CA, USA) and P<0.05 was considered statistically significant. Results for SUVmax are presented as the mean values with standard deviation. The Mann-Whitney U test was conducted for the consecutive imaging and the PET images in the comparison between orthotopic and heterotopic models to measure the P-value.
Histology and immunohistochemistry (IHC)
After imaging, mice were euthanized by CO2 and macroscopically investigated for cancer metastases. The primary tumor was excised, fixed in 10% formalin, and paraffin embedded. Histological confirmation of tumor was performed by an expert pathologist (WHK) on 4 μm hematoxylin & eosin stained slides. For immunohistochemical staining, 4 μm slides were stained with glucose transporter 1 antibody (GLUT1; ab115730; Abcam, Cambridge, UK), which corresponds to the human glucose transporter GLUT1 aa 450 to the C-terminus, and hexokinase 2 antibody (HK2; MA5-14849; Thermo Fisher Scientific, Waltham, MA, USA), which corresponds to the sequence of human hexokinase (isoform II). The staining was performed with Bond-Max Immunostainner and a BondPolymer Refine Detection Kit (Leica Microsystems, Wetzlar, Germany) according to the manufacturer's instructions.
Immunohistochemical assessment was performed by applying the H-score that combines the intensity and degree of staining in tumor tissue [16].
Go to :
RESULTS
Selection of optimal tumor size and dose for [18F]-FDG-PET imaging protocol
Serial imaging of [18F]-FDG-PET/MRI with 449±33.3 μCi injection dose using a heterotopic model showed comparable FDG uptake in tumors and revealed a tumor size of more than 400 mm3. It comes along with central necrosis of the tumor that affects the global uptake of the tumor tissue (Fig. 2A and B). Consecutive imaging of heterotopic model with primary injection of 545±5.6 μCi after 1, 3, and 5 hours resulted in distinctive signal of tumor, liver, and muscle in SNU-JAX-G080 tissue-bearing mice (Fig. 2C and D). The difference of tumor, muscle, and liver signals was shown to be stable over time, resulting in satisfactory results after 5 hours with an approximate of 100 μCi [18F]-FDG dose. No benefits were seen for a higher dose. With respect to the standard uptake time of 1 hour after injection, a primary injection dose of 150 μCi was expected to show stable results and was, therefore, chosen for the protocol (Fig. 2E).
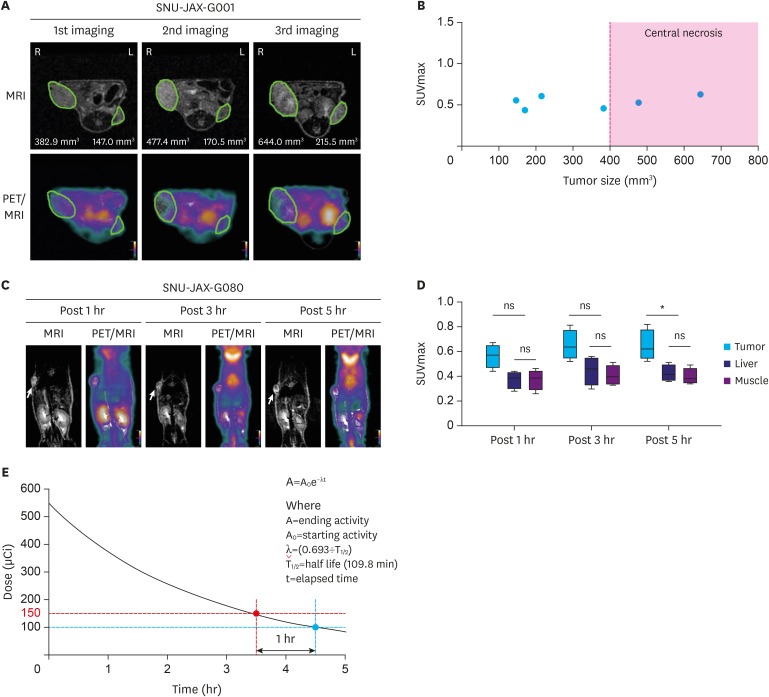 | Fig. 2Selection of optimal tumor size and dose for [18F]-FDG-PET imaging protocol. (A) Serial PET/MRI images in a heterotopic model at 54 (1st imaging), 61 (2nd imaging), and 72 (3rd imaging) days after modeling. The green ellipsoid indicates a tumor. (B) Evaluation of [18F]-FDG uptake in different sized tumors. (C) Consecutive PET/MRI images of mice bearing heterotopic PDX tumor 1, 3, and 5 hours following [18F]-FDG injection (n=4). The yellow arrow indicates a tumor. (D) [18F]-FDG uptake in tumors and normal background tissues. Box plots with error bars indicate the mean uptake and standard deviation across the mice. (E) Injection dose selection for PET imaging protocol from the theoretical decay curve of F-18.[18F]-FDG-PET = 18-fluordesoxyglucose positron emission tomography; PET = positron emission tomography; MRI = magnetic resonance imaging; PDX = patient-derived xenograft; SUVmax = maximal standardized uptake value; ns = not significant.
*P-value ≤0.05.
|
Inflammatory signal aspect for orthotopic model
The sham model underwent FDG-PET/MRI scanning 18, 33, 57, and 95 days after sham implantation (Fig. 3A). FDG uptake analysis revealed that the SUVmax value decreased from 1.62 at day 18 to 0.71 at day 95 in the same intervals (Fig. 3B). Two mice without any manipulation at any site (“healthy control”) showed a stomach site with SUVmax of 0.77 and 0.54. The day 95 sham model showed SUVmax (0.71) comparable with that of the control mice (SUVmax=0.66±0.16).
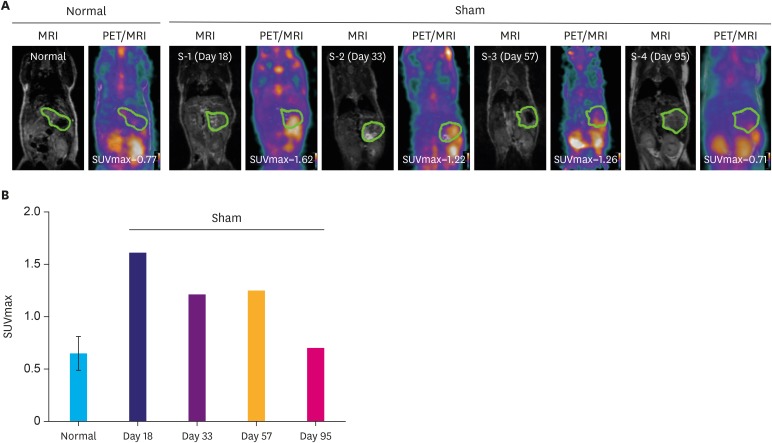 | Fig. 3Inflammatory PET signal aspect for orthotopic model. (A) [18F]-FDG-PET/MRI images of normal (n=2) and sham mouse models. The green ellipsoid indicates the stomach. (B) Quantitative analysis of FDG uptake using SUVmax in stomach.[18F]-FDG-PET = 18-fluordesoxyglucose positron emission tomography; PET = positron emission tomography; MRI = magnetic resonance imaging; FDG = fluordesoxyglucose; SUVmax = maximal standardized uptake value.
|
Comparison of corresponding PDX tissue in heterotopic and orthotopic models
The histomorphology of heterotopic and orthotopic PDX models are demonstrated in Fig. 4A. Six mice were used for heterotopic models with 2 different subcutaneously implanted PDX tissues (Table 1). Eight mice were orthotopically implanted with the same PDX tissues. Two mice deceased before scanning. All (100%) heterotopic and 7 (87.5%) orthotopic model mice presented histologically proven cancer growth upon microscopic investigation (Table 2).
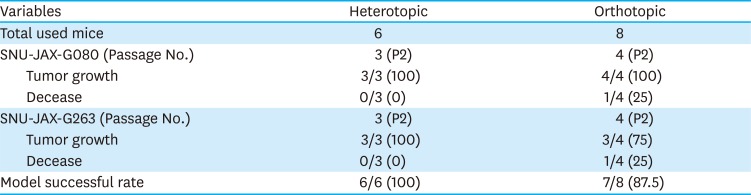
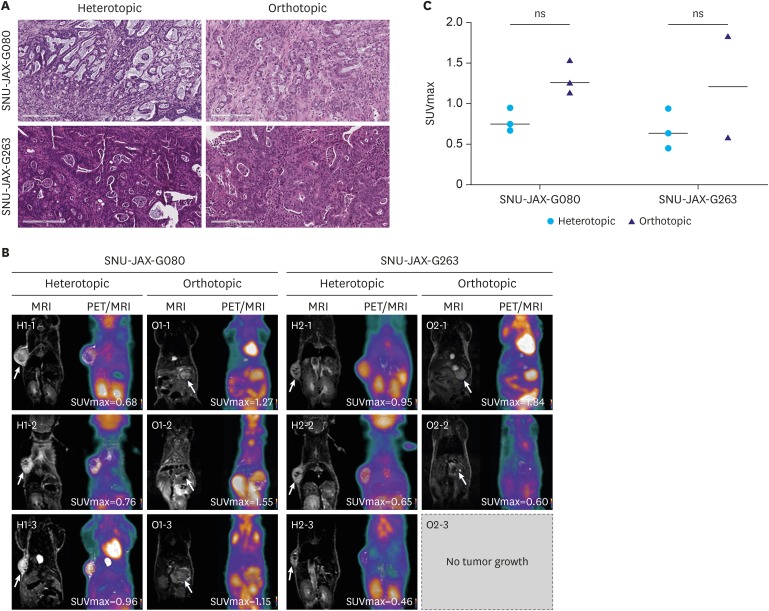 | Fig. 4Comparison of corresponding PDX tissue in heterotopic and orthotopic models. (A) Representative H&E staining images of tumor growth in established models (H&E stain, ×200). (B) [18F]-FDG-PET/MRI images of heterotopic and orthotopic mouse models. (C) Quantitative analysis of [18F]-FDG uptake using SUVmax in heterotopic and orthotopic models bearing PDX tumor.PDX = patient-derived xenograft; H&E = hematoxylin and eosin; [18F]-FDG-PET = 18-fluordesoxyglucose positron emission tomography; PET = positron emission tomography; MRI = magnetic resonance imaging; FDG = fluordesoxyglucose; SUVmax = maximal standardized uptake value; ns = not significant.
|
Table 2
Summary of successful rate between heterotopic and orthotopic models
![]()
The remaining orthotopic mice were scanned 95 days after implantation (Fig. 4B). All heterotopically implanted mice underwent FDG-PET/MRI with a mean tumor size of 134.9 mm2 after a mean time of 39 days.
The [18F]-FDG avidity of orthotopic and heterotopic PDX models with identical tissues is demonstrated in Fig. 4B and C. Results suggest a higher avidity of tumor in orthotopic environment as the mean SUVmax in these cases was measured to be 0.8 and 0.7 in SNU-JAX-G080 and SNU-JAX-G263, respectively, in heterotopic and 1.3 and 1.2 in orthotopic models. The orthotopic tumor growth could be clearly distinguished in MRI.
Expression levels of GLUT1 and HK2 in PET-scanned tumors
Results of GLUT1 and HK2 IHC are shown in Fig. 5. Orthotopic cases showed a high expression of both GLUT1 and HK2 corresponding to a high SUVmax in orthotopic cases. Comparing all cases, the model with the highest SUVmax (1.3, SNU-JAX-G080, orthotopic) showed the highest scores for GLUT1 (177) and HK2 (170). The case with the lowest SUVmax (0.69, SNU-JAX-G263, heterotopic) showed the lowest scores for GLUT1 (57) and HK2 (73). Comparison between SUVmax and each marker showed significant positive correlation (GLUT1: Pearson r=0.7429, P-value=0.0088; HK2: Pearson r=0.6048, P-value=0.0487).
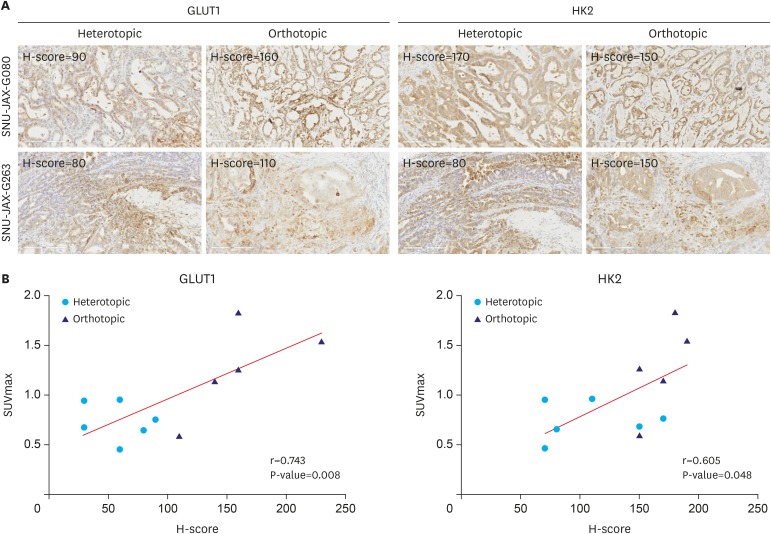 | Fig. 5Correlation between FDG uptake and glycolysis-related protein levels. (A) Representative immunohistochemical results of GLUT1 and HK2 in PET-scanned tumors (IHC stain, ×200). (B) Comparative analysis between [18F]-FDG uptake and immunohistochemical staining score.FDG = fluordesoxyglucose; GLUT1 = glucose transporter 1; HK2 = hexokinase 2; PET = positron emission tomography; IHC = immunohistochemistry; [18F]-FDG = 18-fluordesoxyglucose; MRI = magnetic resonance imaging; SUVmax = maximal standardized uptake value.
Pearson r=0.743, P-value <0.01 and Pearson r=0.605, P-value <0.05 for GLUT1 and HK2, respectively.
|
Go to :
DISCUSSION
This study aimed to establish an [18F]-FDG-PET/MRI preclinical protocol based on xenograft models bearing gastric cancer PDX tissues. To our knowledge, this is the first study evaluating such a model on an [18F]-FDG-PET/MRI with different imaging protocols and PDX implantation methods. Our results demonstrate stable data using a fixed scanning protocol using 150 µCi [18F]-FDG. In heterotopic implantation, we did not distinguish between the SUVmax in different sized tumors with the same PDX tissues (Fig. 2B). Although several studies have reported a positive correlation between SUVmax and tumor size [171819], the correlation in gastric cancer specifically is controversial [202122]. Moreover, the PET signals of large tumors can overlap with signals from other organs. Therefore, an appropriate tumor size is required to acquire the best image quality in vivo. In orthotopic implantation, even in immunocompromised mice, a confounding inflammation signal has to be considered for a period of 1–2 months, however, sufficient tumor growth in this setting usually exceeds this period. The PET/MRI imaging protocol is summarized in Fig. 6.
In other solid cancer types, the [18F]-FDG-PET, mostly in combination CT in a preclinical research setting is established as a tool to investigate drug response or biological behavior [2324]. Valtorta et al. [25] introduced a PDX model of non-small cell lung cancer for [18F]-FDG-PET/CT and demonstrated its utility in early therapy response evaluation in 9 subcutaneous PDX tissues. The authors concluded that the imaging reflects cancer glucose metabolism, which correlates with tumor aggressiveness and growth. Haldorsen et al. [26] introduced an orthotopic endometrial cancer cell line model and outlined the utility of both [18F]-FDG and [18F]-FDG-PET/MRI for tumor growth monitoring and metastasis detection. In preparation for this study, we found an orthotopically implanted mouse with peritoneal metastasis (data not shown). This result is more likely to happen, if the implanted tumor is not fully covered by the stomach and therefore has contact with the peritoneal cavity. If an orthotopic/peritoneal seeding model is desired, this modified implantation method might be considered for gastric cancer PDX. These abilities are important especially in orthotopic models, where an external control of tumor growth is often impossible. Our study demonstrates the [18F]-FDG-PET/MRI signals in both orthotopic and heterotopic PDX models. The images suggest that tumor monitoring in orthotopic gastric cancer models may benefit from MRI addition, thus, the several difficulties in orthotopic tumor modeling have to be discussed. MRI has been used in several studies for monitoring the tumor growth and metastasis in orthotopic models [2728]. However, long-term follow-up with MRI for monitoring tumor development, growth, and metastasis in preclinical studies, especially with a large number of mice, is expensive and time-consuming [29]. A larger drop-out of cases in orthotopic models has to be expected traditionally, therefore the benefits of a more natural tumor environment can be achieved. In terms of inflammatory signal overlapping, our results suggest that the SUVmax can be increased even after a longer period (day 57) without tumor implantation (Fig. 3), and was found comparable to the levels in “healthy controls.” It is strongly recommended to always correlate the FDG signal in orthotopic models with histological results in order to avoid problems of false positivity. The results of the GLUT1 and HK2 IHC staining, therefore, suggest that a high marker expression appears in orthotopic model tumor tissue, which goes along with a high glucose uptake detected by PET, possibly reflecting the altered tumor environment in orthotopic implantation. The IHC staining results give a rational explanation for a high FDG avidity in orthotopic tumor modeling beyond an inflammatory confounder, as the relevant protein levels in tumor tissue was measured. Thus, the technical difficulty of tumor implantation and a more resource consuming monitoring has to be considered when applying an orthotopic model in a high-throughput study.
Using a PET/MRI may consume more human and financial resources than a single PET scanner. However, anatomical conditions might aggravate signal detection in orthotopic models as the left kidney signal is found close and sometimes overlapping to the stomach site signal. Again, for this reason, MRI provides the best possible resolution to allocate uptake signal to an anatomical structure.
The major limitation of our study is the small sample size of the PDX case. Further studies utilizing larger sample sizes of different PDXs are necessary in order to understand and describe the relation between glucose uptake in patients with gastric cancer and corresponding PDXs.
In summary, we have introduced a specific protocol for orthotopic and heterotopic gastric cancer PDX [18F]-FDG-PET/MRI. The heterotopic model has a high success rate with less mortality. We confirmed the correlation between common [18F]-FDG-PET related tissue markers and distinct tumor signals. PDX transplanted murine model can be useful for accessing PET activity in gastric cancer.
Go to :
 XML Download