

 PDF
PDF ePub
ePub Citation
 Print
Print


INTRODUCTION
Gastric cancer is a highly malignant tumor, which is characterized by metastasis and drug resistance [1]. Importantly, tissue hypoxia (HYP) caused by uncontrolled cell proliferation is the basic microenvironment of tumor. HYP promotes the expression of genes related to angiogenesis, metastasis, glycolysis, and drug resistance through the effects of HYP-inducible factor-1α (HIF-1α), thus endowing gastric cancer cells with stronger malignant properties [2].
B-cell lymphoma 3 (Bcl-3) belongs to the nuclear factor (NF)-κB protein family, and regulates the subcellular translocation and DNA-binding activity of NF-κB [3]. Bcl-3 acts as a transcriptional activator or inhibitor by forming heterologous complexes with p50 and p52 in the nucleus, and activates or inhibits the transcription of target genes [4], and plays a carcinogenic role in several cancers [56]. Several studies have demonstrated that the expression of Bcl-3 is upregulated in gastric cancer [78]. However, the precise role of Bcl-3 in gastric cancer remains poorly understood, and especially the role and mechanism of Bcl-3 in the autophagy and drug sensitivity of gastric cancer cells are largely unclear. Therefore, we aimed to understand the role of Bcl-3 on the migration and chemosensitivity of gastric cancer cells.
Go to : 
MATERIALS AND METHODS
Cell culture
Gastric cancer cell lines AGS and NCI-N87 were purchased from American Type Culture Collection (ATCC, Manassas, VA, USA) and cultured in RPMI-1640 GlutaMAX (Gibco, Thermo-Fisher Scientific, Waltham, MA, USA) with 10% fetal bovine serum and penicillin-streptomycin (Sigma-Aldrich, St. Louis, MO, USA) at the concentration of 1% (v/v). All cells were kept in a hypoxic chamber (Invivo200, UK) in a humidified atmosphere with 5% CO2, 1% O2, and 94% N2 and a constant temperature of 37˚C.
Western blot analysis
For total protein extraction from the tumor samples, the tissues were crushed on dry ice to protect from denaturation. Lysis buffer (2.5 μL/mg) was added to the sample and then the tissues were homogenized on ice and sonicated, before incubation for 30 minutes on ice. Protein extraction from the cancer cell lines was accomplished by adding lysis buffer and incubating on ice for 30 minutes following washing of the cells with phosphate-buffered saline (PBS). Protein samples from both the tissues and cells were then centrifuged at 12,000 rpm for 10 minutes at 4°C. The supernatant was subsequently collected and stored at −80°C. Later, the protein concentrations were measured using a bicinchoninic acid kit (AR0146; Boster Biological Technology Co. Ltd., Wuhan, China). Equal amounts of each protein sample were electrophoresed on a sodium dodecyl sulfate polyacrylamide gel. Then the proteins were transferred onto a polyvinylidene fluoride membrane and the membranes were blocked with 5% skim non-fat milk solution in tris-buffered saline with Tween-20. The primary and secondary antibodies used were as follows: anti-HIF-1α antibody (1:1,000; ab51608, Abcam, Cambridge, MA, USA), anti-Bcl3 antibody (4 µg/mL; ab27780, Abcam), anti-Atg5 antibody (1:10,000; ab109490, Abcam), anti-LC3 A/B antibody (2 µg/mL; ab128025, Abcam), anti-vascular endothelial growth factor (VEGF) antibody, (1:5,000; ab32152, Abcam), anti-matrix metallopeptidase 9 (MMP-9) antibody, (1:1,000; ab38898, Abcam), anti-glyceraldehyde 3-phosphate dehydrogenase antibody (1:1,000; ab181602, Abcam), horseradish peroxidase-conjugated goad anti-rabbit (1:5,000; ab6721, Abcam), anti-mouse (1:5,000; ab6728, Abcam), and donkey anti-goat (1:5,000; ab6885, Abcam) antibodies. Protein bands were eventually visualized using an ECL kit (RPN2232, Amersham, Little Chalfont, UK). Quantification was conducted with the Image J software.
Wound healing assay
AGS and NCI-N87 was seeded in six-well plates. The confluent cell monolayer was scraped with a pipette tip in the middle of the well. After 24 hours incubation, the cell migration was captured with a DM2500 bright field microscope (LEICA, Wetzlar, Germany) and the migration distance was measured using the ImageJ software.
Detection of cell proliferation
Cells (2×10³/well) were seeded in six-well plates with 6 parallel wells set for each experimental group. Briefly, 6 hours post cell attachment was recorded as the 0 hour and the cells were cultured for 30 hours. Then 100 μL mixture of medium and Cell Counting Kit-8 reagent (9:1) was added, and the cells were incubated in the incubator with 5% CO2, 1% O2 and 94% N2 at 37°C. A microplate reader was used to read the absorbance value at 450 nm.
Immunofluorescence staining for LC3
Immunofluorescence staining was used to confirm the expression of LC3 in the cells. Cells were cultured in different conditions for 48 hours. Then, the cells were washed with PBS and fixed for 20 minutes at 25°C with 4% paraformaldehyde. The cells were permeabilized with 0.4% TritonX-100 for 10 minutes, washed with PBS for thrice and then blocked with 2% bovine serum albumin in PBS for 1 hour at 37°C. Antibodies against LC3 (in 1% blocking solution) was added to the cells and incubated overnight at 4°C. After 5-min washes with PBS, fluorescein-conjugated secondary antibody was added (in 1% blocking solution) and the cells were incubated for 1 hour. Finally, the stained cells were mounted with DAPI (1 μg/mL for 7–10 minutes) to stain the nuclei. Following 3 additional 10 minutes washes, the samples were examined and analyzed with a fluorescence microscope (Olympus, Tokyo, Japan)
Tumorigenicity experiments in nude mouse
BALB/c nude mice purchased from the Beijing Vital River Laboratory Animal Technology Co., Ltd. (Charles River Laboratories, Wilmington, MA, USA) were used for the tumorigenesis experiments. Female BALB/c (4 weeks old and weighing about 15 g) mice were used. Fifteen mice were separated into 5 groups. A total of 5×10⁶ AGS cells (transfected with si-RNA-Bcl-3 [si-Bcl-3] or not) resuspended in 200 μL PBS were injected subcutaneously into nude mice. Intraperitoneal injection of 5-fluorouracil (5-FU, 50mg/kg daily for 7 days)/rapamycin (Rapa) were given to mice. After a 30-day observation period, the experimental mice were euthanized and the tumors were dissected for further experiments. All the animal experiments procedures in this study were approved by the Animal Ethics Committee of Committee of the Beijing Friendship Hospital (BFH-20180306) . All the animal protocols were conducted strictly in accordance with the guidelines of International Guiding Principles for Animal Research.
Immunohistochemistry
The paraffin-embedded tumor sections were incubated with anti-Ki67 (Abcam, Cambridge, UK). Immunohistochemistry was performed as previously described [9].
Terminal deoxynucleotidyl transferase dUTP nick end labeling (TUNEL) assay
TUNEL staining was performed to detect apoptotic cell death in situ in the tumors according to the manufacturer's instructions (TUNEL apoptosis detection kit: Upstate, Lake Placid, NY, USA). Relative TUNEL-positive rate is displayed as the ratio of brown staining within the nucleus of the apoptotic cells.
Statistical analysis
In this study, data are expressed as mean±standard deviation, and paired t-test was performed for comparison with the control groups. All statistical calculations were performed using the SPSS10.0 (SPSS Inc., Chicago, IL, USA) software. A significant difference was determined by P-value <0.05 and P-value <0.01.
Go to :
RESULTS
HYP induces the upregulation of HIF-1α and Bcl-3 protein in gastric cancer cells
HYP is a key feature in the microenvironment of solid tumors. Elevated level of HIF-1α is often found in solid tumors, which correlates with cancer-related death [210]. Therefore, we subjected the gastric cancer cell lines AGS and NCI-N87 to hypoxic conditions, and an in vitro HYP cell model was established to mimic the microenvironment in solid tumors. Cells were grouped into control, HYP 6 hours, HYP 12 hours, HYP 24 hours according to the HYP treatment duration. The HIF-1α and Bcl-3 protein levels were determined at different time points by western blot analysis. The results showed that HIF-1α and Bcl-3 protein levels gradually increased with increasing exposure to HYP (Fig. 1A and B), and differences between the groups were significant (P<0.05). The results indicate that expression of Bcl-3 is induced by HYP. The increase of Bcl-3 may be positively correlated with gastric cancer development.
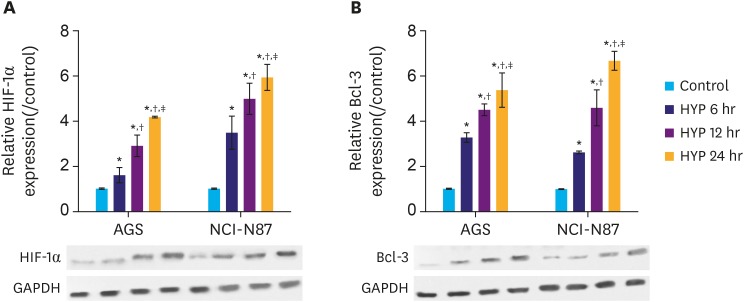 | Fig. 1HYP induces HIF-1α and Bcl-3 protein in gastric cancer cells. (A) Relative expression of HIF-1α in AGS and NCI-N87 cells was analyzed by western blotting. (B) Relative expression of Bcl-3 in AGS and NCI-N87 cells was analyzed by western blotting. GAPDH was used as a loading control.HIF-1α = hypoxia-inducible factor-1α; Bcl-3 = B-cell lymphoma 3; HYP = hypoxia; GAPDH = glyceraldehyde 3-phosphate dehydrogenase.
*P<0.05 (compared to control); †P<0.05 (compared to HYP 6 hours); ‡P<0.05 (compared to HYP 12 hours).
|
Bcl-3 knockdown reduces the migration and increases the chemosensitivity of gastric cancer cells
To understand the mechanism of Bcl-3 in gastric cancer cells, si-Bcl-3 vectors were constructed to knockdown the expression of Bcl-3. As shown in Fig. 2A, the protein level of Bcl-3 in the 3 si-Bcl-3 (si-Bcl-3-1, si-Bcl-3-2, and si-Bcl-3-3) groups were significantly decreased compared to the control group (P<0.05), while the si-negative control (si-NC) group showed no obvious change compared to control group. These results confirm the knockdown efficacy of three si-Bcl-3 small interfering RNAs.
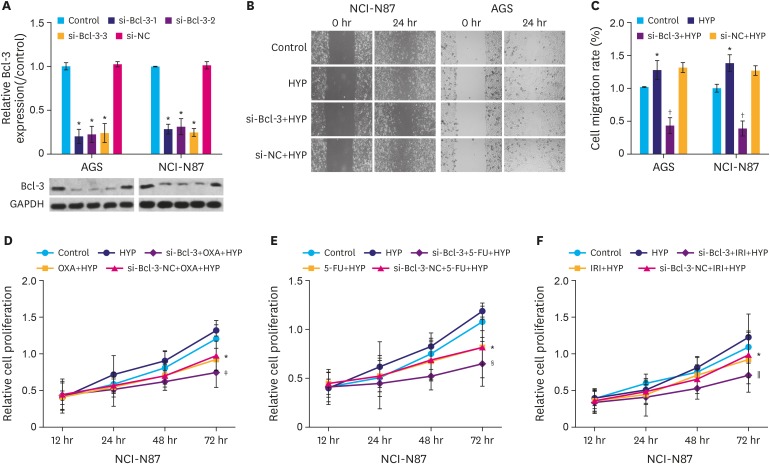 | Fig. 2Knockdown of Bcl-3 reduces the migration and increases the chemosensitivity of gastric cancer cells. (A) AGS and NCI-N87 cells were transfected with si-NC, or si-Bcl-3-1/2/3. Relative expression Bcl-3 in AGS and NCI-N87 cells was analyzed by western blotting. GAPDH was used as a loading control. (B) Cells were treated with HYP/si-Bcl-3 transfection. Wound healing assay was used to assess the migration of AGS and NCI-N87 cells. (C) Quantification of cell migration in AGS and NCI-N87 cells. (D) NCI-N87 cells were treated with or without OXA under HYP and MTT assay was used to detect cell proliferation. (E) NCI-N87 cells were treated with or without 5-FU under HYP and MTT assay was used to detect cell proliferation. (F) NCI-N87 cells were treated with or without IRI under HYP and MTT assay was used to detect cell proliferation.Bcl-3 = B-cell lymphoma 3; GAPDH = glyceraldehyde 3-phosphate dehydrogenase; si-NC = si-negative control; si-Bcl-3 = si-RNA-Bcl-3; HYP = hypoxia; OXA = oxaliplatin; 5-FU = 5-fluorouracil; IRI = irinotecan.
*P<0.05 (compared to control); †P<0.05 (compared to HYP); ‡P<0.05 (compared to OXA+HYP); §P<0.05 (compared to 5-FU+HYP); ∥P<0.05 (compared to IRI+HYP).
|
Cells were subsequently divided into 4 groups as follows: control, HYP, si-Bcl-3+HYP, and si-NC+HYP. Cell migration in the four groups was evaluated using wound healing assay. Cells in the HYP group showed increased migration rate compared to the control group (Fig. 2B, P<0.05), while cells in the si-Bcl-3+HYP group showed decreased migration rate compared to the HYP group (P<0.05). In addition, si-Bcl-3 significantly increased the chemosensitivity of gastric cancer cells to oxaliplatin (OXA), 5-FU, and irinotecan (IRI) compared to their treatment alone (Fig. 2C-E, P<0.05). These results suggest that Bcl-3 knockdown reduced the migration and increased the chemosensitivity of gastric cancer cells.
Bcl-3 knockdown decreases HYP-induced autophagy
To assess the effect of si-Bcl-3 on autophagy, autophagy-related proteins were analyzed following Bcl-3 knockdown. As shown in Fig. 3A and B, the protein level of HIF-1α was significantly increased following HYP, while the increase was inhibited by si-Bcl-3 in gastric cancer cells (P<0.05). As shown in Fig. 3A, C, and D, the protein level of Atg5 and LC3II were also induced by HYP and suppressed by si-Bcl-3. Interestingly, the protein expression level of Bcl-3 showed similar expression pattern as Atg5/LC3II (Fig. 3A and E). In addition, the LC3 immunofluorescence assay further confirmed that si-Bcl-3 inhibited LC3 protein level induced by HYP (Fig. 3F and G, P<0.05). These results indicate that Bcl-3 knockdown decreases HYP-induced protective autophagy in gastric cancer cells.
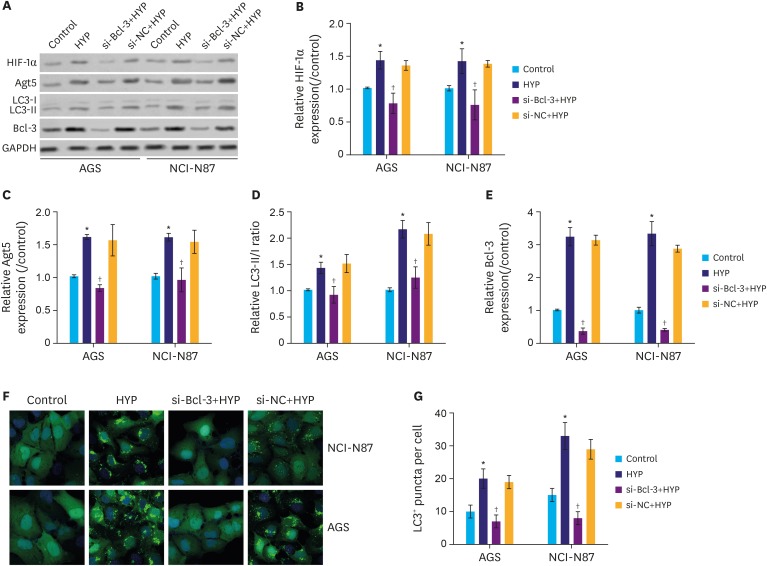 | Fig. 3Knockdown of Bcl-3 decreases HYP-induced autophagy. Relative expression of HIF-1α, Atg5, and LC3 were analyzed in AGS and NCI-N87 by western blotting. (B-E) Quantification of the relative protein levels of HIF-1α, Atg5, Bcl-3, and LC3 in AGS and NCI-N87 cells. (F,G) Immunofluorescence assay for LC3. LC3 positive puncta in individual cells are shown.Bcl-3 = B-cell lymphoma 3; HIF-1α = hypoxia-inducible factor-1α; HYP = hypoxia; si-Bcl-3 = si-RNA-Bcl-3; si-NC = si-negative control; GAPDH = glyceraldehyde 3-phosphate dehydrogenase.
*P<0.05 (compared to control); †P<0.05 (compared to HYP).
|
To further emphasize that Bcl-3 knockdown suppresses migration and 5-FU resistance were mediated by autophagy, autophagy inducer Rapa was introduced. As shown in Fig. 4A, under hypoxic conditions, si-Bcl-3 clearly inhibited cell migration, while treatment with Rapa significantly increased cell migration. As expected, si-Bcl-3 reduced Rapa-induced cell migration. Moreover, under the hypoxic conditions, si-Bcl-3 significantly decreased resistance to 5-FU (Fig. 4B, P<0.05). In addition, si-Bcl-3 reduced the expression of Atg5 and LC3II. Further, si-Bcl-3 inhibited Rapa-induced Atg5 and LC3II expression (Fig. 4C-E, P<0.05). Taken together, these results suggest that under hypoxic conditions Bcl-3 knockdown reduces migration and 5-FU resistance of gastric cancer cells by decreasing autophagy.
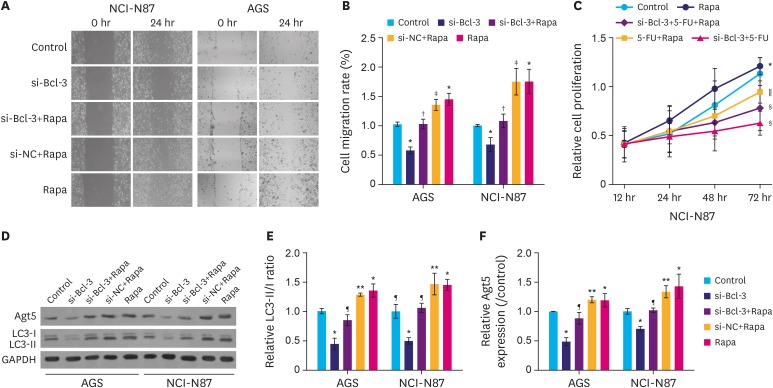 | Fig. 4Knockdown of Bcl-3 decreases hypoxia-induced autophagy. AGS and NCI-N87 cells were transfected with si-NC/si-Bcl-3 with or without Rapa. (A) Wound healing assay was used to analyze the migration of AGS and NCI-N87 cells. (B) Quantification of cell migration in AGS and NCI-N87 cells. (C) NCI-N87 cells were transfected with si-NC/si-Bcl-3 with or without 5-FU/Rapa, MTT was used to detect cell proliferation. (D) Relative expression of autophagy-related proteins in AGS and NCI-N87 were analyzed by western blotting. (E, F) Quantification of the relative protein levels of Atg5 and LC3 in AGS and NCI-N87 cells.Bcl-3 = B-cell lymphoma 3; si-Bcl-3 = si-RNA-Bcl-3; si-NC = si-negative control; 5-FU = 5-fluorouracil; Rapa = rapamycin; GAPDH = glyceraldehyde 3-phosphate dehydrogenase.
*P<0.05 (compared to control); †P<0.05 (compared to si-Bcl-3); ‡P<0.05 (compared to si-Bcl-3+Rapa); §P<0.05 (compared to 5-FU+Rapa); ∥P<0.05 (compared to si-Bcl-3+5-FU);); ¶P<0.05 (compared to si-Bcl-3); **P<0.05 (compared to si-Bcl-3+Rapa).
|
Bcl-3 knockdown regulates tumor growth through autophagy in vivo
To further clarify the role of Bcl-3 on migration and chemosensitivity of gastric cancer cells in vivo, a xenograft tumor model was constructed in nude mice. As depicted in Fig. 5A, compared to the control group, the tumor sizes in 5-FU+si-Bcl-3, 5-FU and 5-FU+si-Bcl-3-NC groups were significantly decreased (P<0.05), while those in 5-FU+si-Bcl-3+Rapa showed minimal difference compared to the control group. Interestingly, compared to the 5-FU group, 5-FU+si-Bcl-3 showed reduced tumor sizes (P<0.05). As shown in Fig. 5B-H, compared to the control group, the relative expression of Bcl-3, HIF-1α, VEGF, MMP-9, Atg5, and LC3II were clearly downregulated in the 5-FU+si-Bcl-3, 5-FU, and 5-FU+si-Bcl-3-NC group (P<0.05), while 5-FU+si-Bcl-3+Rapa group showed minimal difference compared to the control group. Moreover, compared with 5-FU group, the 5-FU+si-Bcl-3 group showed reduced expression of these proteins (P<0.05). In addition, compared to the control group, Ki67 expression was downregulated in 5-FU+si-Bcl-3, 5-FU, and 5-FU+si-Bcl-3-NC groups (Fig. 5I, P<0.05), but increased following Rapa treatment. Importantly, the apoptotic rates were increased in the 5-FU+si-Bcl-3, 5-FU, and 5-FU+si-Bcl-3-NC groups compared to the control group (Fig. 5J, P<0.05), but increased following Rapa treatment. These results indicate that knockdown of Bcl-3 suppresses the in vivo growth of gastric cancer through inhibiting autophagy.
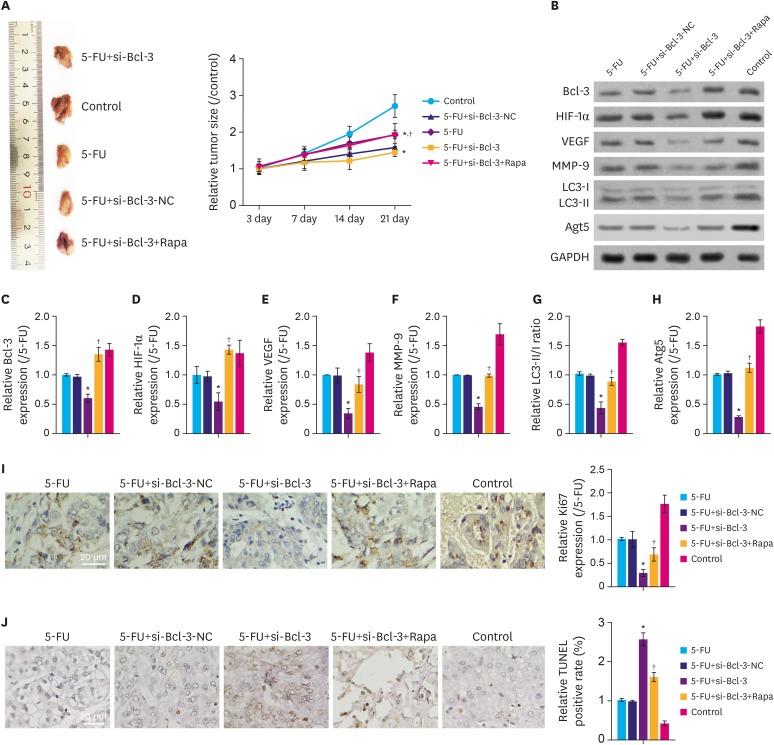 | Fig. 5Knockdown of Bcl-3 regulates in vivo tumor growth through autophagy. Tumorigenicity assay of AGS cells were performed using nude mouse. (A) Images of xenograft tumors derived from tumor-bearing nude mice injected with AGS cells with or without si-Bcl-3 transfection and 5-FU/Rapa. Tumor sizes of control and experimental mice are summarized in the line chart. (B-H) Relative expression of the associated proteins. (I) Immunohistochemistry for Ki67 and quantitation of the relative Ki67 expression. (J) TUNEL assay was used to detect apoptosis in the tumor tissue.Bcl-3 = B-cell lymphoma 3; HIF-1α = hypoxia-inducible factor-1α; VEGF = vascular endothelial growth factor; MMP-9 = matrix metallopeptidase 9; NC = negative control; si-Bcl-3 = si-RNA-Bcl-3; 5-FU = 5-fluorouracil; Rapa = rapamycin; TUNEL = terminal deoxynucleotidyl transferase dUTP nick end labeling; GAPDH = glyceraldehyde 3-phosphate dehydrogenase.
*P<0.05 (compared to control); †P<0.05 (compared to si-Bcl-3+5-FU).
|
Go to :
DISCUSSION
Gastric cancer is a leading cause of cancer-related deaths in China [11]. Despite the improvements in the treatment modalities in the recent years, gastric cancer-related relapse and death resulting from metastasis and chemoresistance greatly impede the effectiveness of chemotherapy. In this study, we demonstrated that Bcl-3 is an oncogene in gastric cancer. Bcl-3 knockdown markedly reduced the migration and chemoresistance of gastric cancer cells. In addition, similar results were observed in xenograft tumors in vivo. Most importantly, these activities may be regulated by inhibiting protective autophagy in gastric cancer.
HYP is a key feature of almost all solid tumors. HYP may drive the cells to acquire more aggressive properties, such as increased cell migration, invasion, growth, metastasis [12], protective autophagy [13], and chemoresistance [14]. HIF-1 is an important transcriptional regulator that is essential in the cellular response to HYP by modulating hypoxic gene expression [15]. HIF-1 consists a HYP-sensitive subunit, HIF-1α and a constitutively expressed subunit, HIF-1β. Under normoxic conditions, HIF-1α is degraded through the recruitment of a ubiquitin-protein ligase. Whereas in hypoxic conditions, HIF-1α is activated through decreased hydroxylation by PHD [16]. In this study, HIF-1α was activated under the hypoxic conditions, but it was inactivated by Bcl-3 knockdown in both AGS and NCI-N87 cells, which suggests that Bcl-3 knockdown may help suppress the aggressive properties of gastric cancer cells through downregulating HIF-1α.
Bcl-3, a key regulator of NF-κB signaling, is believed to be an important oncogenic mediator in solid tumors [17]. Bcl-3 promotes several kinds of cancers including chronic lymphocytic leukemia, and solid tumors such as colorectal [5], breast [18], prostate [19], and cervical [20]. Moreover, Bcl-3 exhibits tumor-promoting capabilities through increasing proliferation, metastasis, and chemoresistance in several cancers [2122]. A review of literature revealed four myocardial ischemia studies that focused on the relationship between Bcl-3 and HYP. As reported, upregulation of Bcl-3 could help H2C9 cells against myocardial ischemia [23]. However, whether Bcl-3 is induced by hypoxic environment in cancers remains unclear. It is reasonable to speculate that Bcl-3 is positively correlated with HYP in cells and that Bcl-3 may help the cells survive under hypoxic conditions. In the present study, under the hypoxic conditions, knockdown of Bcl-3 impeded cell migration and increased chemosensitivity of 5-FU. Consistent with the previous studies, our results confirmed the tumor-promoting role of Bcl-3. Chemoresistance is a major cause of poor prognosis of gastric cancer. In this study, we studied the role of Bcl-3 during the treatment with OXA, 5-FU, and IRI. As predicted, knockdown of Bcl-3 significantly enhanced the cancer cell killing effect of these chemotherapeutics drugs, which suggests that knockdown of Bcl-3 improved the chemosensitivity of gastric cancer cells.
Autophagy, a highly conserved lysosome-mediated protective cellular process reported to play a protective role in cancers [13]. Activation of autophagy is thought to facilitate the survival and development of tumors under stress like HYP, by providing nutrients, oxygen, and invasive channels to tumors under stress [24]. Mechanically, inhibition of autophagy reduced the survival and invasive ability of cancer cells under conditions of stress. The role of Bcl-3 on autophagy is quite unclear. A previous study reported that upregulation of Bcl-3 promoted the autophagy process in human T-cell leukemia virus, type 1-infected cells [25]. In the present study, autophagy was activated in gastric cancer cells under the hypoxic conditions and in tumors in vivo. Bcl-3 knockdown significantly reduced autophagy, which was inconsistent with the previous study [25]. Interestingly, Bcl-3 knockdown also significantly reduced Rapa-induced autophagy. Thus, our study revealed that Bcl-3 may have a positive correlation with autophagy, and inhibiting Bcl-3 can decrease migration and chemoresistance of gastric cancer through suppressing autophagy in vitro and in vivo.
Taken together, Bcl-3 was upregulated in gastric cancer. Bcl-3 knockdown significantly decreased migration and chemoresistance of gastric cancer cells. Moreover, the underlying mechanism may inhibit HYP-induced autophagy in gastric cancer cells and tumor.
Go to :
 XML Download