Journal List > Korean J Gastroenterol > v.75(3) > 1144391

Park, Kim, Choe, Kwon, Yoo, Hwang, Park, Kim, Park, Yu, and Jeon: Risk Factors for Liver Function Deterioration after Transarterial Chemoembolization Refractoriness in Child-Pugh Class A Hepatocellular Carcinoma Patients

Abstract

Background/Aims

A switch to systemic therapy, such as sorafenib, should be considered for hepatocellular carcinoma (HCC) patients refractory to transarterial chemoembolization (TACE). On the other hand, treatment changes are difficult if the liver function worsens to Child-Pugh B or C. Therefore, predicting the risk factors for non-responsiveness to TACE and deteriorating liver function may be helpful.

Methods

Newly diagnosed Child-Pugh A HCC patients who underwent TACE from January 2012 to June 2018 were included. After 1 year, this study evaluated whether there was a treatment response to TACE and whether the Child-Pugh class had worsened.

Results

Among 121 patients, 65 were refractory and 56 responded to TACE. In multivariable logistic regression analysis, the tumor size, tumor number, and albumin at the time of the diagnosis of HCC were significant prognostic factors for the treatment response to TACE. Among 65 patients who presented TACE-refractoriness, 27 showed liver function deterioration from Child-Pugh class A to class B or C after TACE. In multivariable logistic regression analysis, bilirubin at the diagnosis of HCC was a significant prognostic factor for liver function deterioration. A predictive algorithm based on the regression equations revealed a sensitivity, specificity, positive predictive value, and negative predictive value of 74.1%, 74.5%, 45.5%, and 90.9%, respectively, for TACE-re-fractoriness and liver function deterioration.

Conclusions

The prognostic model incorporating the tumor size, tumor number, albumin, and bilirubin at the diagnosis of HCC may help identify patients who show a poor response to TACE and aggravation of liver function after TACE, who may benefit from early switching into systemic therapy before liver function aggravation.

References

1. Sotiropoulos GC, Lang H, Frilling A, et al. Resectability of hepatocellular carcinoma: evaluation of 333 consecutive cases at a single hepatobiliary specialty center and systematic review of the literature. Hepatogastroenterology. 2006; 53:322–329.
2. Park JW, Chen M, Colombo M, et al. Global patterns of hepatocellular carcinoma management from diagnosis to death: the BRIDGE Study. Liver Int. 2015; 35:2155–2166.
3. Llovet JM, Bruix J. Systematic review of randomized trials for unresectable hepatocellular carcinoma: chemoembolization improves survival. Hepatology. 2003; 37:429–442.
crossref
4. Bruix J, Sala M, Llovet JM. Chemoembolization for hepatocellular carcinoma. Gastroenterology. 2004; 127(5 Suppl 1):S179–S188.
crossref
5. Ogasawara S, Chiba T, Ooka Y, et al. Efficacy of sorafenib in inter-mediate-stage hepatocellular carcinoma patients refractory to transarterial chemoembolization. Oncology. 2014; 87:330–341.
crossref
6. Korean Liver Cancer Association, National Cancer Center. 2018 Korean Liver Cancer Association-National Cancer Center Korea practice guidelines for the management of hepatocellular carcinoma. Gut Liver. 2019; 13:227–299.
7. Yamanaka K, Hatano E, Kitamura K, et al. Early evaluation of transcatheter arterial chemoembolization-refractory hepatocellular carcinoma. J Gastroenterol. 2012; 47:343–346.
crossref
8. Kim HY, Park JW, Joo J, et al. Severity and timing of progression predict refractoriness to transarterial chemoembolization in hepatocellular carcinoma. J Gastroenterol Hepatol. 2012; 27:1051–1056.
crossref
9. Kudo M, Izumi N, Kokudo N, et al. Management of hepatocellular carcinoma in Japan: consensus-based clinical practice guidelines proposed by the Japan Society of Hepatology (JSH) 2010 updated version. Dig Dis. 2011; 29:339–364.
crossref
10. European Association For The Study Of The Liver, European Organisation For Research And Treatment Of Cancer. EASL-EORTC clinical practice guidelines: management of hepatocellular carcinoma. J Hepatol. 2012; 56:908–943.
11. Sieghart W, Hucke F, Pinter M, et al. The ART of decision making: retreatment with transarterial chemoembolization in patients with hepatocellular carcinoma. Hepatology. 2013; 57:2261–2273.
crossref
12. Bruix J, Raoul JL, Sherman M, et al. Efficacy and safety of sorafenib in patients with advanced hepatocellular carcinoma: sub-analyses of a phase III trial. J Hepatol. 2012; 57:821–829.
crossref
13. Hollebecque A, Cattan S, Romano O, et al. Safety and efficacy of sorafenib in hepatocellular carcinoma: the impact of the Child-Pugh score. Aliment Pharmacol Ther. 2011; 34:1193–1201.
crossref
14. Kim JE, Ryoo BY, Ryu MH, et al. Sorafenib for hepatocellular carcinoma according to Child-Pugh class of liver function. Cancer Chemother Pharmacol. 2011; 68:1285–1290.
crossref
15. Marrero JA, Kudo M, Venook AP, et al. Observational registry of sorafenib use in clinical practice across Child-Pugh subgroups: the GIDEON study. J Hepatol. 2016; 65:1140–1147.
crossref
16. Lencioni R, Llovet JM. Modified RECIST (mRECIST) assessment for hepatocellular carcinoma. Semin Liver Dis. 2010; 30:52–60.
crossref
17. Kadalayil L, Benini R, Pallan L, et al. A simple prognostic scoring system for patients receiving transarterial embolisation for hepatocellular cancer. Ann Oncol. 2013; 24:2565–2570.
crossref
18. Pinato DJ, Arizumi T, Allara E, et al. Validation of the hepatoma arterial embolization prognostic score in European and Asian populations and proposed modification. Clin Gastroenterol Hepatol. 2015; 13:1204–1208.e2.
19. Chan AO, Yuen MF, Hui CK, Tso WK, Lai CL. A prospective study regarding the complications of transcatheter intraarterial lip-iodol chemoembolization in patients with hepatocellular carcinoma. Cancer. 2002; 94:1747–1752.
crossref
20. Hwang JI, Chow WK, Hung SW, et al. Development of a safety index of transarterial chemoembolization for hepatocellular carcinoma to prevent acute liver damage. Anticancer Res. 2005; 25(3c):2551–2554.
21. Kudo M. A new era of systemic therapy for hepatocellular carcinoma with regorafenib and lenvatinib. Liver Cancer. 2017; 6:177–184.
crossref
22. Forner A, Reig M, Bruix J. Hepatocellular carcinoma. Lancet. 2018; 391:1301–1314.
crossref
23. Kim DY. New systemic therapies for advanced hepatocellular carcinoma. Korean J Gastroenterol. 2019; 73:10–15.
crossref
24. Dika IE, Abou-Alfa GK. Treatment options after sorafenib failure in patients with hepatocellular carcinoma. Clin Mol Hepatol. 2017; 23:273–239.
crossref
25. Kudo M, Finn RS, Qin S, et al. Lenvatinib versus sorafenib in first-line treatment of patients with unresectable hepatocellular carcinoma: a randomised phase 3 non-inferiority trial. Lancet. 2018; 391:1163–1173.
crossref
26. Bruix J, Qin S, Merle P, et al. Regorafenib for patients with hepatocellular carcinoma who progressed on sorafenib treatment (RESORCE): a randomised, double-blind, placebo-controlled, phase 3 trial. Lancet. 2017; 389:56–66.
crossref
27. Villanueva A. Hepatocellular carcinoma. N Engl J Med. 2019; 380:1450–1462.
crossref
28. Chung JW. Recent advance in international management of hepatocellular carcinoma. J Korean Med Assoc. 2013; 56:972–982.
crossref
29. Miyayama S, Yamashiro M, Ikuno M, Okumura K, Yoshida M. Ultraselective transcatheter arterial chemoembolization for small hepatocellular carcinoma guided by automated tumor-feeders detection software: technical success and short-term tumor response. Abdom Imaging. 2014; 39:645–656.
crossref

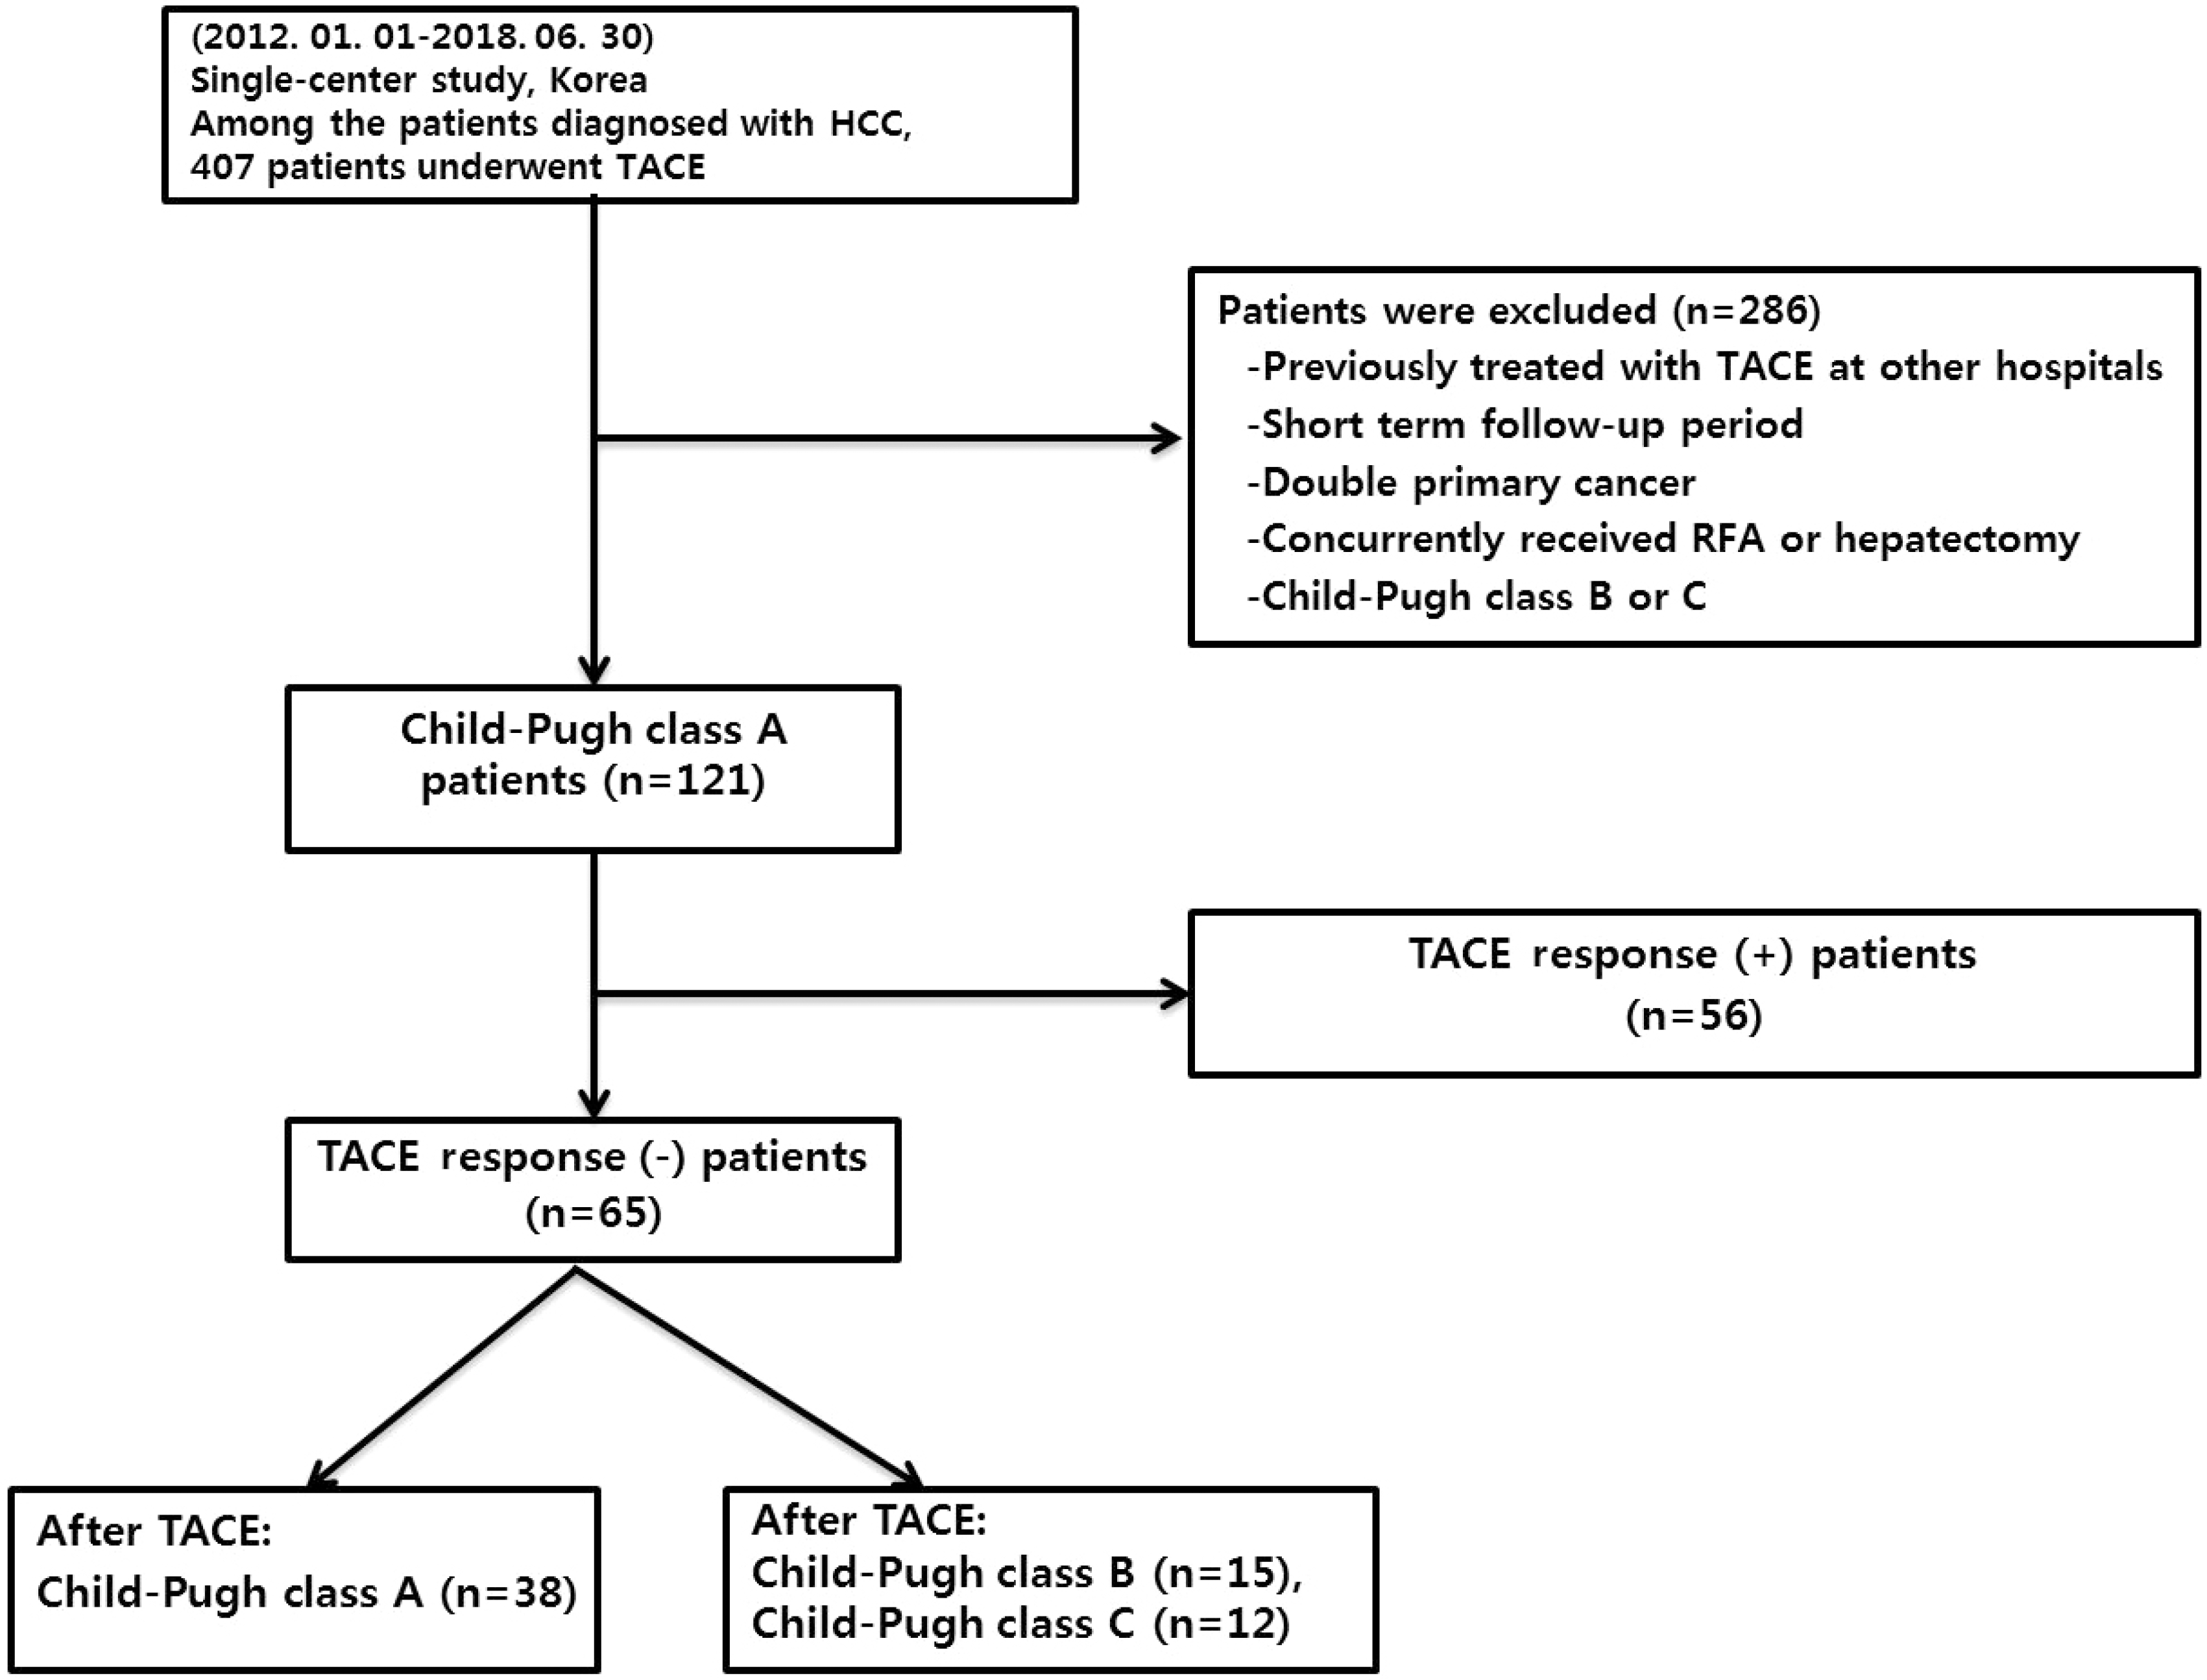
Fig. 1.
Patient flow diagram. HCC, hepatocellular carcinoma; TACE, transarterial chemoembolization; RFA, radiofrequency ablation.
kjg-75-147f1.tif
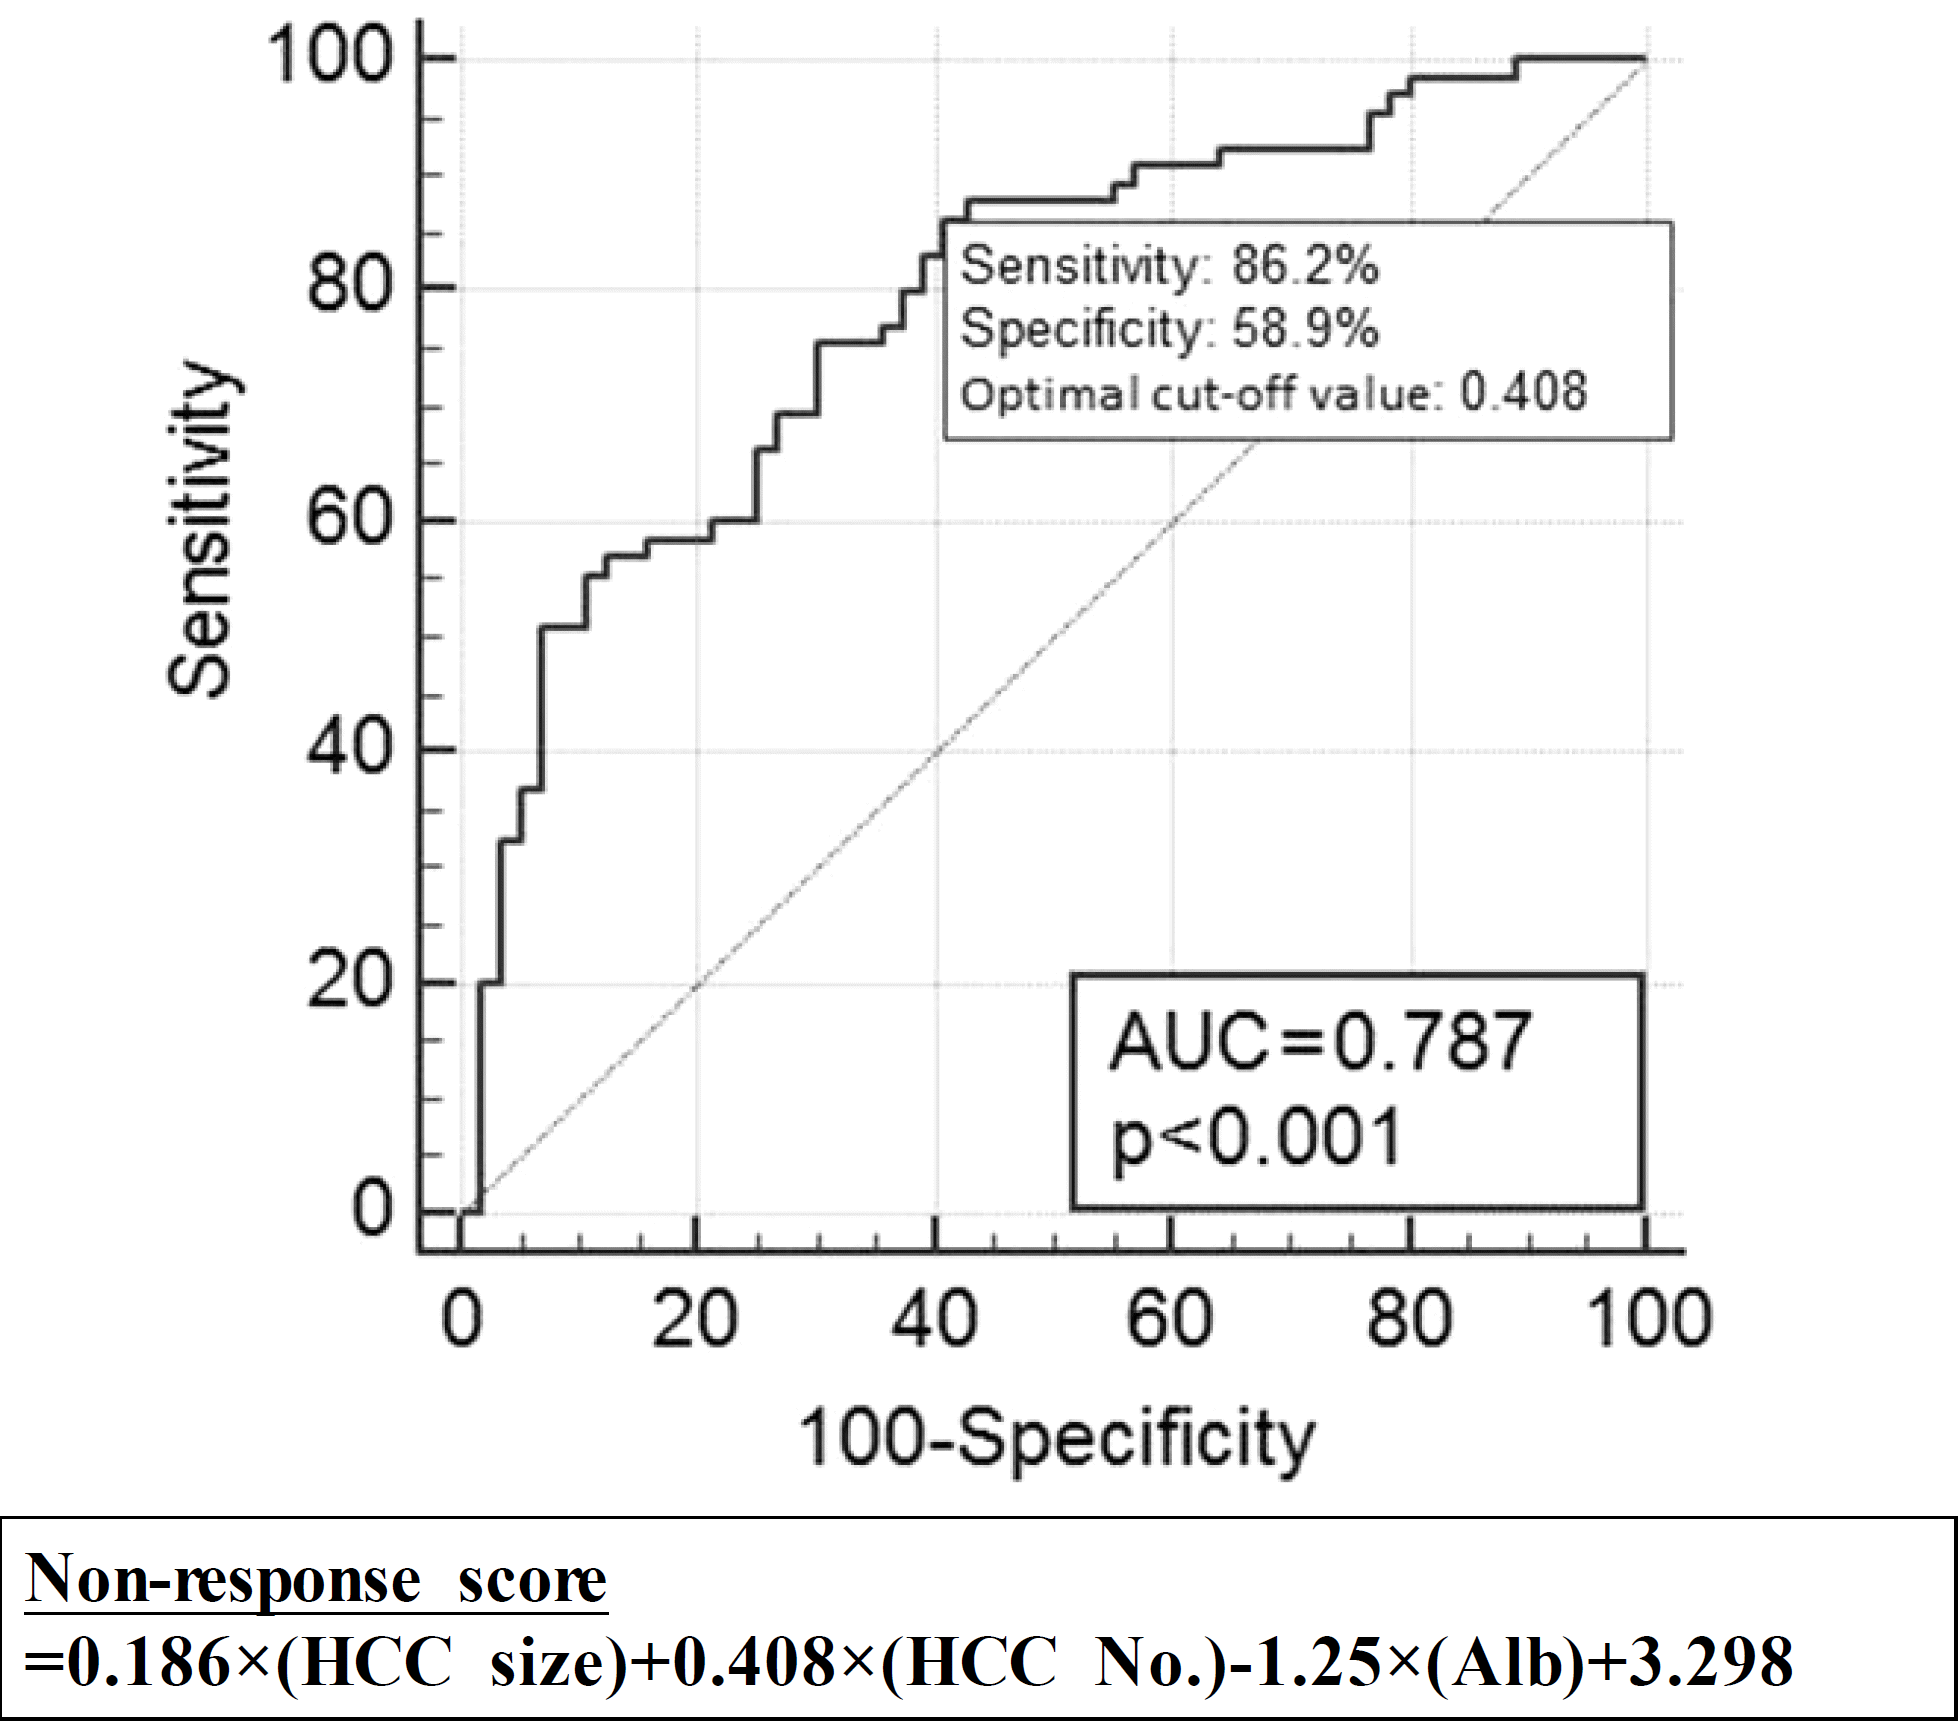
Fig. 2.
ROC curves and equations of the multivariable logistic regression of TACE refractoriness. AUC, area under the curve; HCC, hepatocellular carcinoma; Alb, albumin; ROC, receiver operating characteristic; TACE, transarterial chemoembolization.
kjg-75-147f2.tif
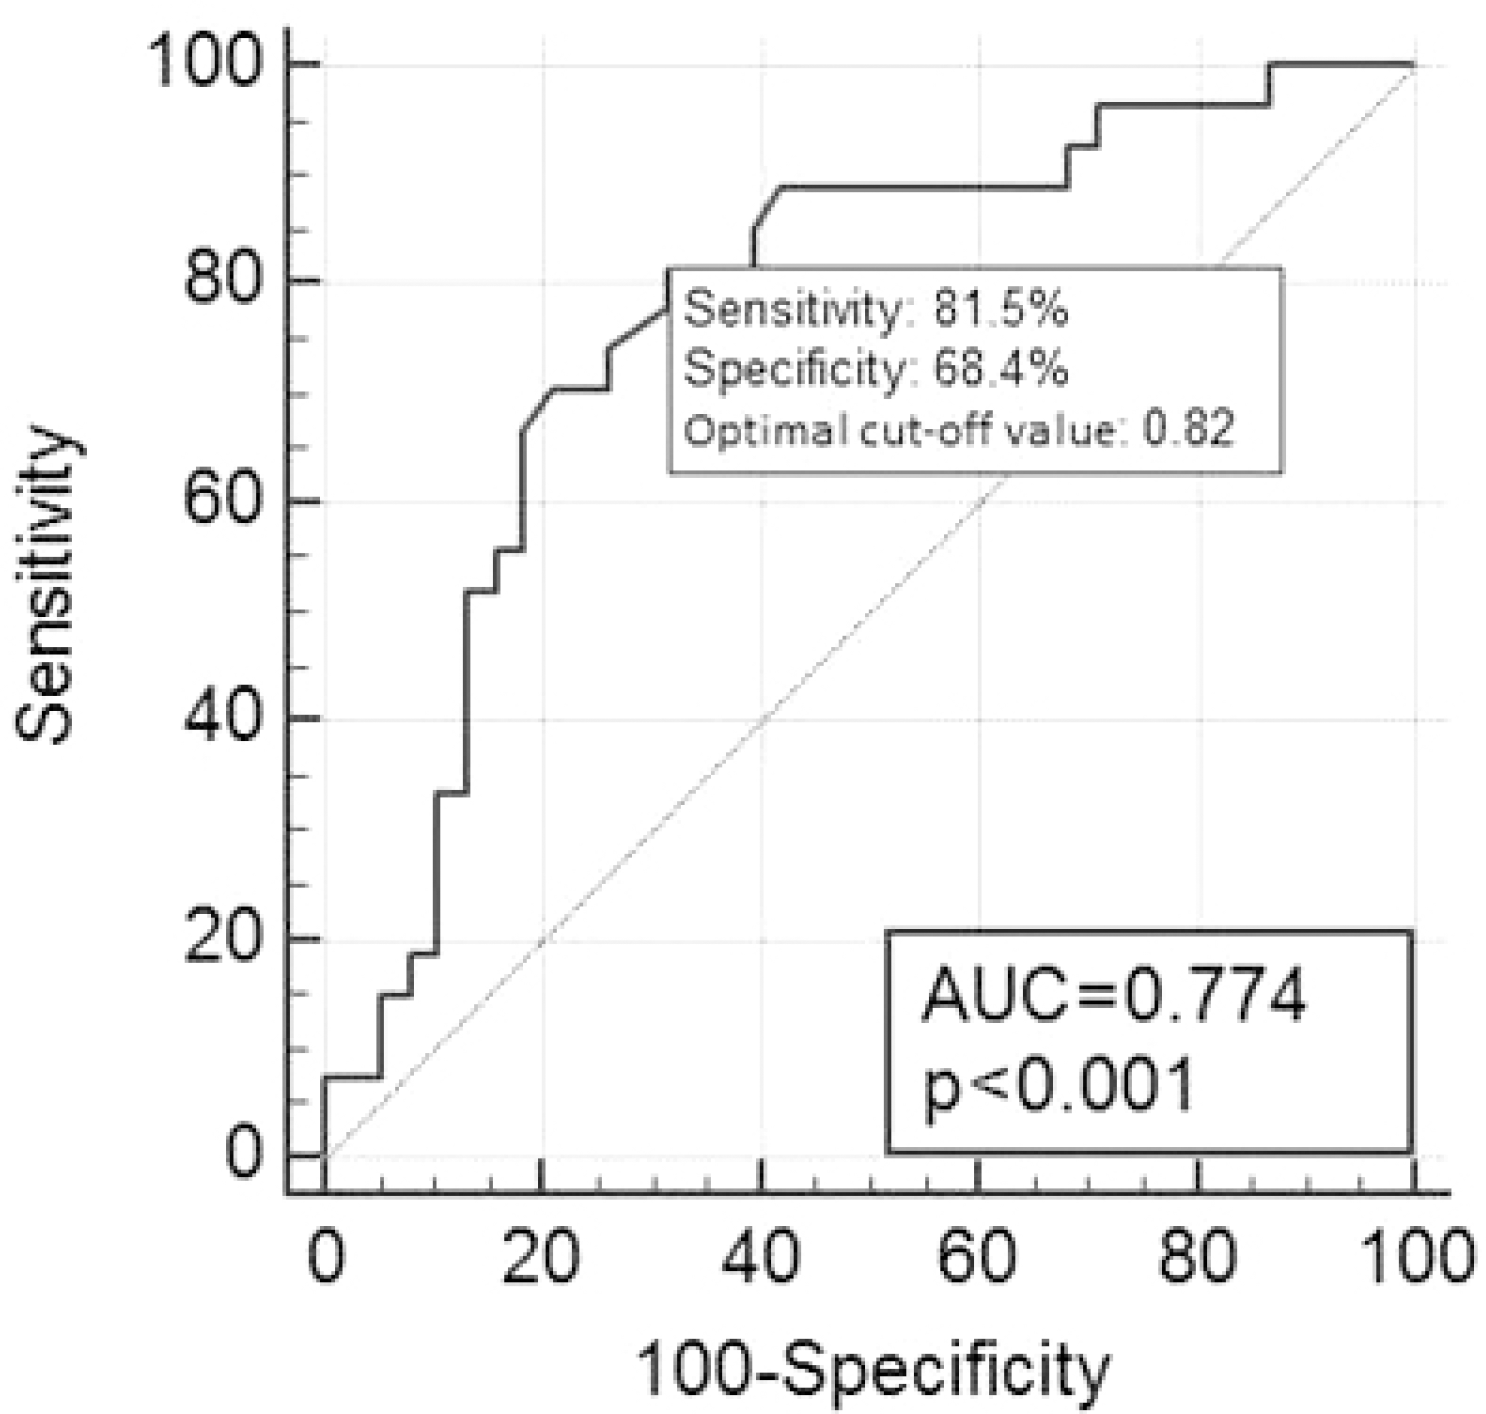
Fig. 3.
Total bilirubin ROC curves of the univariable logistic regression of liver function deterioration. AUC, area under the curve; ROC, receiver operating characteristic.
kjg-75-147f3.tif
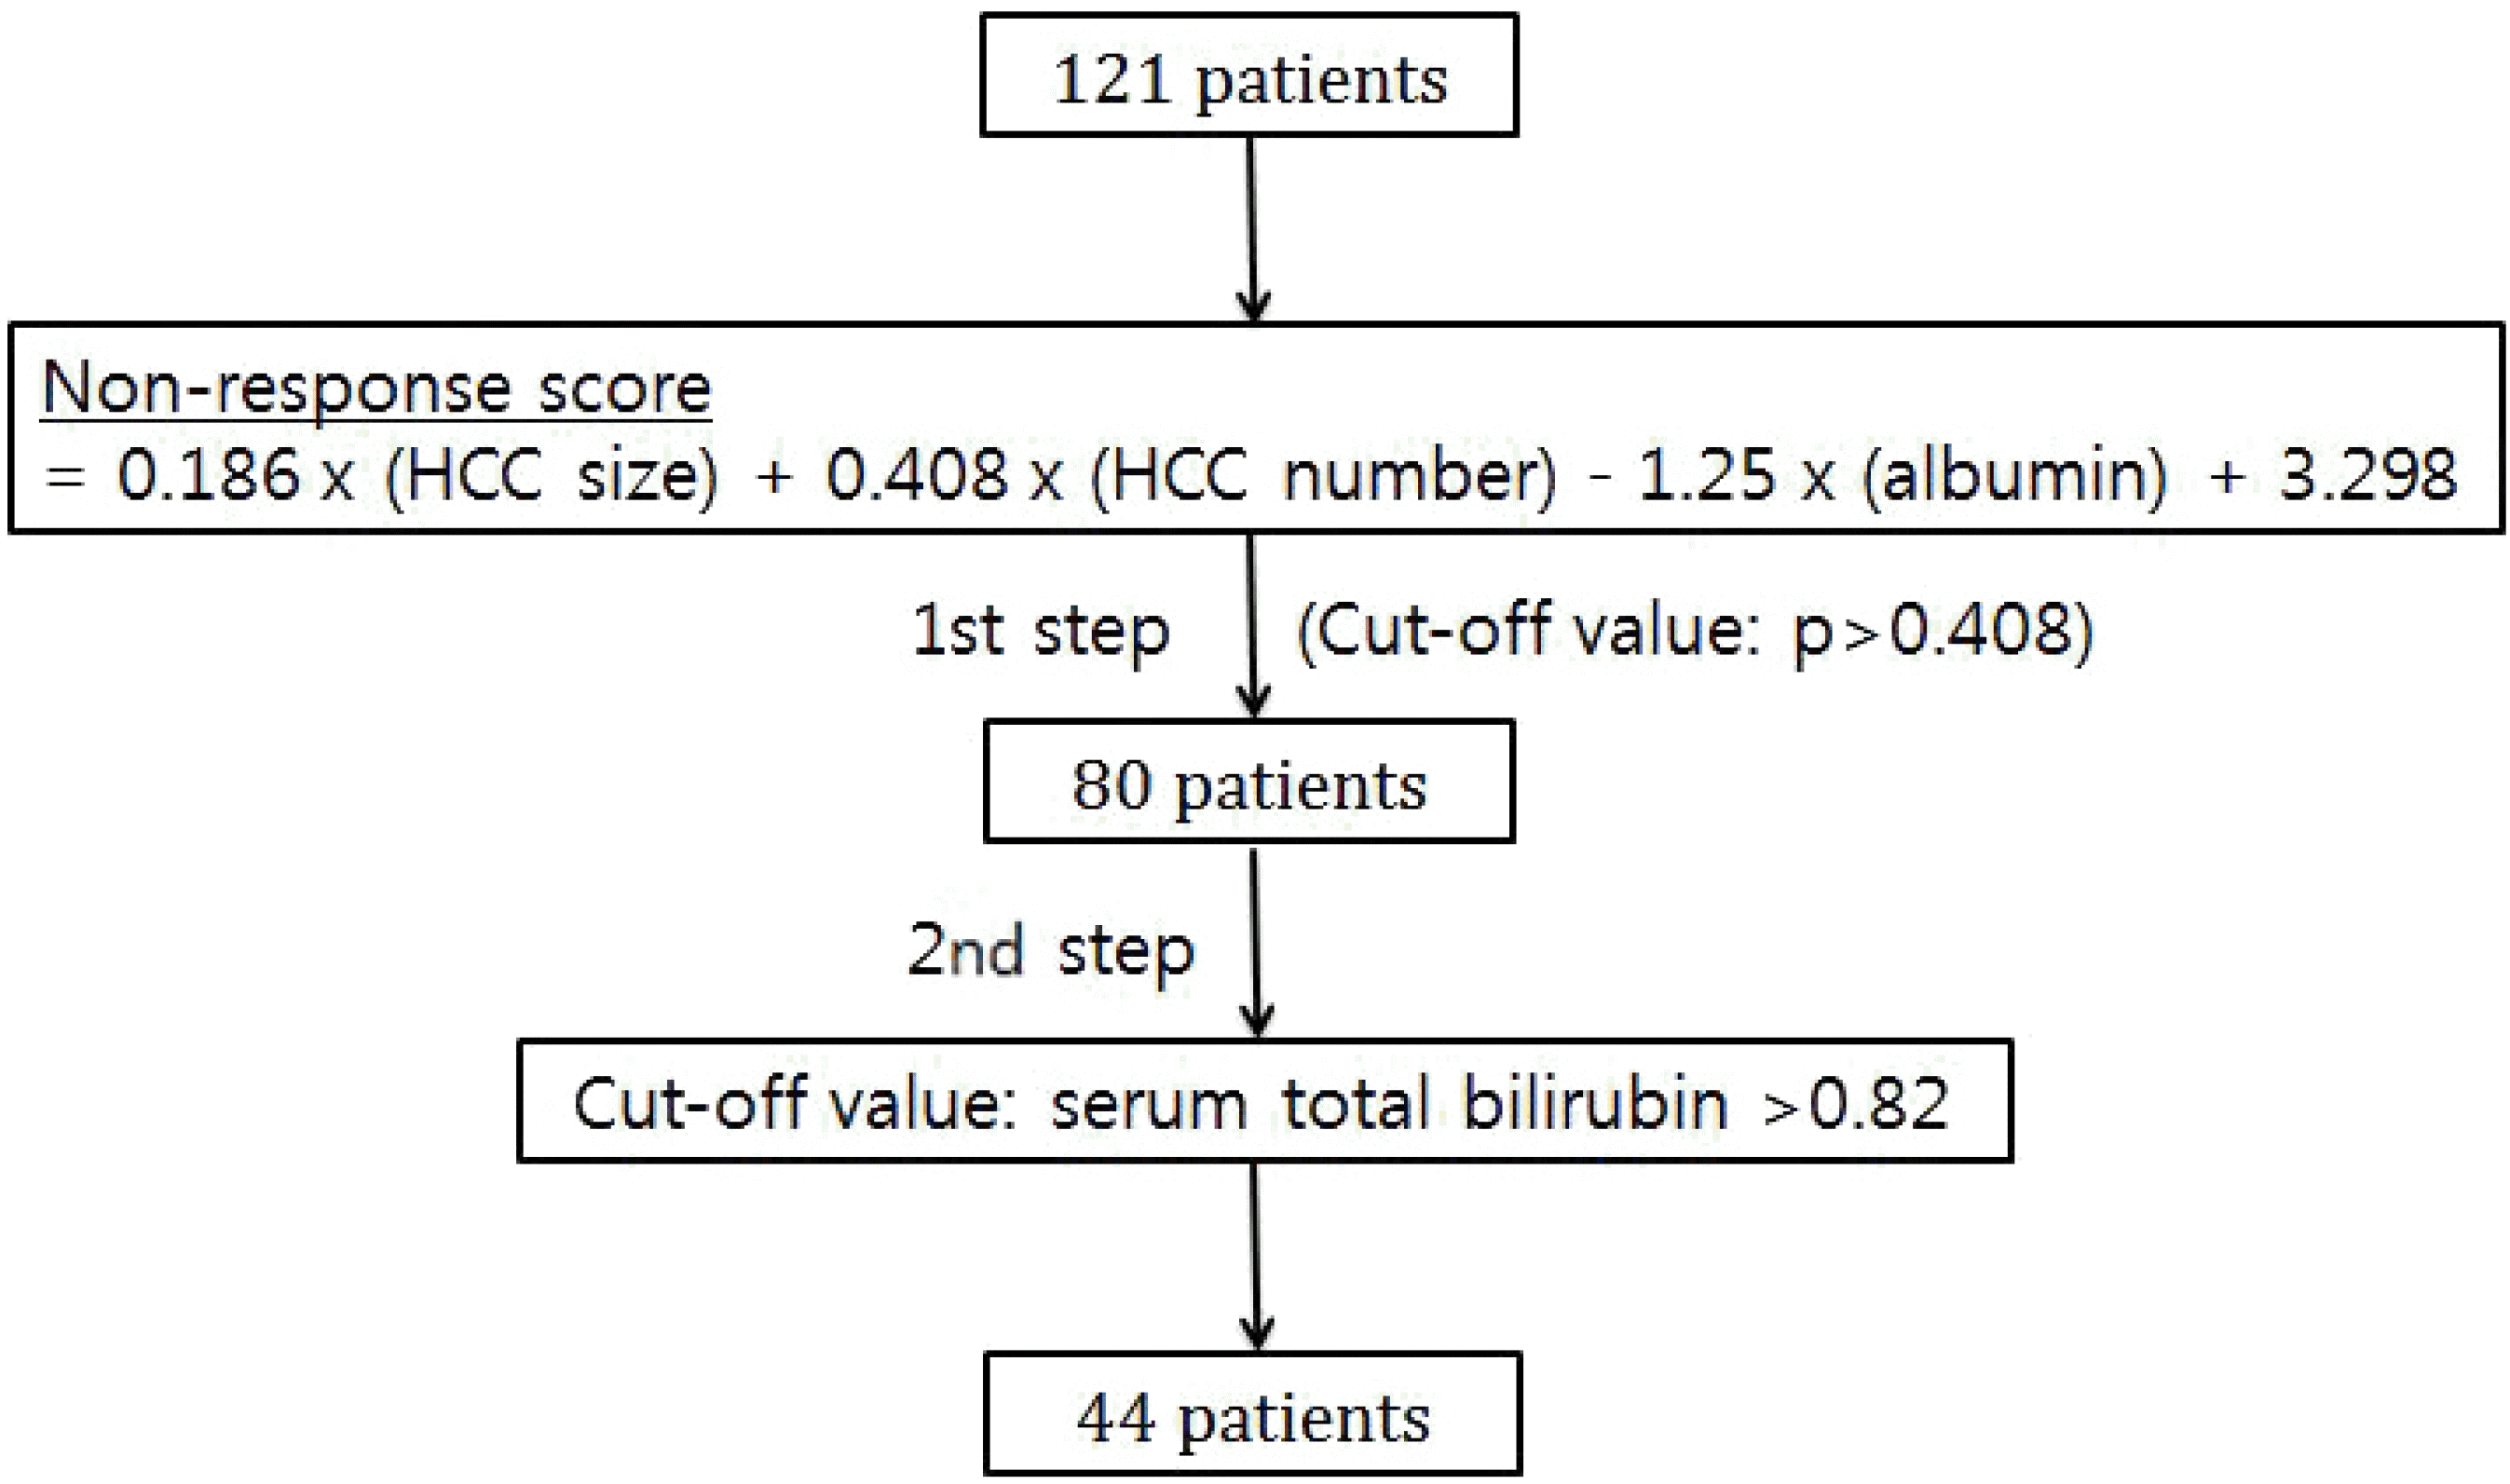
Fig. 4.
Prediction of patients with reduced liver function without a response after TACE using the regression formula. HCC, hepatocellular carcinoma; TACE, transarterial chemoembolization.
kjg-75-147f4.tif
Table 1.
Baseline Characteristics of All the Patients (n=121) with HCC and Child-Pugh Class A Liver Function First Treated by TACE and Comparisons of the Patients according to the TACE Response
Variable Total With TACE response (n=56) Without TACE response (n=65) p-value
Age (years) 65.1 (58.0-74.0) 66.6 (68.0-72.8) 63.9 (55.5-76.0) 0.336
Male 84 (69.4) 37 (66.1) 47 (72.3) 0.458
Diabetes mellitus 45 (37.2) 20 (35.7) 25 (38.5) 0.755
BMI (kg/m2) 23.2 (20.7-26.1) 23.8 (21.0-26.3) 23.1 (20.6-26.0) 0.222
Alcohol (g/day) 1.8 (0.0-54.0) 27.6 (0.0-54.0) 32.4 (0.0-54.0) 0.929
Etiology of HCC       0.527
 HBV 65 (53.7) 30 (53.6) 35 (53.8)  
 HCV 23 (19) 9 (16.1) 14 (21.5)  
 Alcohol 23 (19) 12 (21.4) 11 (16.9)  
 Other 10 (8.3) 5 (8.9) 5 (7.7)  
Final follow-up state       <0.001
 Died 25 (20.7) 5 (8.9) 20 (30.8)  
 Ongoing follow-up 61 (50.4) 42 (75.0) 19 (29.2)  
 Lost to follow-up 35 (28.9) 9 (16.1) 26 (40.0)  
Tumor size (cm) 2.5 (1.6-5.3) 2.9 (1.5-3.6) 4.7 (2.0-6.4) 0.006
Number of tumors 2.0 (1.0-3.0) 1.7 (1.0-2.0) 2.9 (1.0-5.0) <0.001
Portal vein thrombosis 8 (6.6) 1 (1.8) 7 (10.8) 0.067
Liver cirrhosis 113 (93.4) 53 (94.6) 60 (92.3) 0.724
Platelet (×103/µL) 130.0 (86.0-166.0) 137.3 (97.5-159.3) 125.0 (76.0-168.5) 0.229
Albumin (g/dL) 3.8 (3.4-4.1) 3.9 (3.6-4.3) 3.62 (3.3-4.0) 0.003
Total bilirubin (mg/dL) 0.9 (0.6-1.2) 0.9 (0.9-1.2) 1.0 (0.6-1.3) 0.682
AST (U/L) 50 (33.5-67.0) 55.8 (30.0-66.8) 62.6 (36.5-68.5) 0.231
ALT (U/L) 34 (22.0-45.0) 32.3 (21.0-44.0) 41.5 (22.0-48.0) 0.437
BUN (mg/dL) 14.5 (12.5-17.6) 15.0 (12.6-17.0) 15.5 (12.5-18.0) 0.457
Creatinine (mg/dL) 0.9 (0.7-1.0) 0.9 (0.7-1.0) 0.9 (0.7-1.0) 0.843
Na (mmol/L) 139.0 (136.0-141.0) 138.9 (137.0-140.8) 138.1 (136.0-141.0) 0.427
Prothrombin time (INR) 1.1 (1.0-1.2) 1.1 (1.0-1.1) 1.1 (1.0-1.2) 0.052
AFP (ng/mL) 14.1 (5.7-102.1) 201.5 (4.3-44.1) 14,799.6 (8.8-384.8) 0.004
PIVKA II (mAU/mL) 54.8 (21.5-313.0) 357.6 (19.6-168.2) 5,216.2 (24.0-721.0) 0.036
MELD score 8.0 (7.0-9.0) 8.1 (7.0-9.0) 8.6 (7.0-10.0) 0.010
Modified UICC       0.023
 Stage I 22 (18.2) 15 (26.8) 7 (10.8)  
 Stage II 43 (35.5) 22 (39.3) 21 (32.3)  
 Stage III 38 (31.4) 16 (28.6) 22 (33.8)  
 Stage IV 18 (14.8) 3 (5.4) 15 (23)  
BCLC stage       0.030
 Very early stage (0) 8 (6.6) 13 (23.2) 6 (9.2)  
 Early stage (A) 14 (11.6) 16 (28.6) 13 (20)  
 Intermediate stage (B) 25 (20.7) 15 (26.8) 25 (38.5)  
 Advanced stage (C) 72 (59.5) 10 (23) 21 (32.3)  
 Terminal sate (D) 2 (1.7) 2 (3.6) 0 (0)  
Child-Pugh       0.031
 Score 5 74 (61.2) 40 (71.4) 34 (52.3)  
 Score 6 47 (38.8) 16 (28.6) 31 (47.7)  

Values are presented as median (interquartile range) or n (%).

HCC, hepatocellular carcinoma; TACE, transarterial chemoembolization; BMI, body mass index; HBV, hepatitis B virus; HCV, hepatitis C virus; AST, aspartate transaminase; ALT, alanine transaminase; BUN, blood urea nitrogen; Na, sodium; INR, international normalized ratio; AFP, alpha-fetoprotein; PIVKA II, protein induced by vitamin K absence-II; MELD, model for end-stage liver disease; UICC, Union for International Cancer Control; BCLC, Barcelona Clinic Liver Cancer.

Table 2.
Prognostic Factor Analysis for the TACE Refractoriness by Logistic Regression
Characteristic Univariable OR (95% CI) p-value Multivariable OR (95% CI) p-value
Age (years) 0.977 (0.945-1.010) 0.169    
Male 0.746 (0.343-1.619) 0.458    
BMI (kg/m2) 0.936 (0.843-1.040) 0.221    
Portal vein thrombosis 0.151 (0.018-1.265) 0.081    
Tumor size (cm) 1.238 (1.067-1.437) 0.005 1.204 (1.018-1.424) 0.030
Number of tumors 1.642 (1.235-2.184) 0.001 1.503 (1.117-2.023) 0.007
Albumin (g/dL) 0.321 (0.142-0.686) 0.004 0.287 (0.120-0.685) 0.005
Platelet (×103/μ L) 0.996 (0.990-1.003) 0.244    
Na (mmol/L) 0.933 (0.838-1.040) 0.209    
Prothrombin time (INR) 23.864 (0.870-654.732) 0.060    
AFP (ng/mL) 1.000 (1.000-1.001) 0.232    
PIVKA II (mAU/mL) 1.000 (1.000-1.000) 0.245    

TACE, transarterial chemoembolization; OR, odds ratio; CI, confidence interval; BMI, body mass index; Na, sodium; INR, international normalized ratio; AFP, alpha-fetoprotein; PIVKA II, protein induced by vitamin K absence-II.

Table 3.
Baseline Clinical and Tumor Characteristics according to Liver Function Deterioration after TACE among the Patients Who Showed TACE Refractoriness
Variable Remained in Child-Pugh class A (n=38) Worsened to Child-Pugh class B or C (n=27) p-value
Age (years) 65.2 (57.5-75.3) 62.0 (49.0-76.0) 0.351
Male 29 (76.3) 18 (66.7) 0.392
Diabetes mellitus 16 (42.1) 9 (33.3) 0.474
BMI (kg/m2) 23.5 (20.8-26.5) 22.5 (19.8-25.3) 0.242
Alcohol (g/day) 25.1 (0.0-43.2) 42.6 (0.0-72.0) 0.136
Tumor size (cm) 4.4 (2.1-5.6) 5.2 (1.6-9.4) 0.920
Number of tumors 2.8 (1.0-6.0) 2.9 (1.0-4.0) 0.632
Portal vein thrombosis 4 (10.5) 3 (11.1) 1.000
Liver cirrhosis 34 (89.5) 26 (96.3) 0.393
Platelet (×103/μ L) 126.1 (76.8-161.3) 123.4 (73.0-179.0) 0.859
Albumin (g/dL) 3.7 (3.4-4.0) 3.5 (3.1-4.0) 0.207
Total bilirubin (mg/dL) 0.8 (0.5-1.0) 1.2 (0.9-1.4) <0.001
AST (U/L) 58.0 (35.8-60.0) 69.1 (38.0-86.0) 0.082
ALT (U/L) 38.8 (22.0-42.3) 45.2 (26.0-59.0) 0.196
BUN (mg/dL) 16.1 (13.3-17.9) 14.7 (11.1-18.1) 0.214
Creatinine (mg/dL) 0.9 (0.8-1.0) 0.8 (0.6-1.0) 0.285
Na (mmol/L) 137.7 (136.0-140.0) 138.7 (136.0-141.0) 0.260
Prothrombin time (INR) 1.1 (1.0-1.2) 1.2 (1.0-1.3) 0.024
AFP (ng/mL) 19,298.5 (8.9-231.0) 8,467.9 (7.3-963.4) 0.331
PIVKA II (mAU/mL) 867.1 (23.5-403.3) 11,337.3 (24.0-2147.0) 0.372
MELD score 8.1 (7.0-9.0) 9.2 (8.0-11.0) 0.023
Modified UICC     0.628
 Stage I 3 (7.9) 4 (14.8)  
 Stage II 12 (31.6) 9 (33.3)  
 Stage III 15 (39.5) 7 (25.9)  
 Stage IV 8 (21.1) 7 (25.9)  
BCLC stage     0.948
 Very early stage (0) 1 (2.6) 1 (3.7)  
 Early stage (A) 2 (5.3) 1 (3.7)  
 Intermediate stage (B) 9 (23.7) 5 (18.5)  
 Advanced stage (C) 26 (68.4) 20 (74.1)  
 Terminal sate (D) 0 (0) 0 (0)  
Child-Pugh     0.038
 Score 5 24 (63.2) 10 (37.0)  
 Score 6 14 (36.8) 17 (63.0)  

Values are presented as median (interquartile range) or n (%).

TACE, transarterial chemoembolization; BMI, body mass index; AST, aspartate transaminase; ALT, alanine transaminase; BUN, blood urea nitrogen; Na, sodium; INR, international normalized ratio; AFP, alpha-fetoprotein; PIVKA II, protein induced by vitamin K absence-II; MELD, model for end-stage liver disease; UICC, Union for International Cancer Control; BCLC, Barcelona Clinic Liver Cancer.

Table 4.
Prognostic Factor Analysis for Liver Function Deterioration after TACE by Logistic Regression
Characteristic Univariable OR (95% CI) p-value Multivariable OR (95% CI) p-value
Age (years) 0.980 (0.942-1.019) 0.313    
Male 1.611 (0.539-4.817) 0.393    
BMI (kg/m2) 0.916 (0.791-1.060) 0.239    
Alcohol (g/day) 1.008 (0.997-1.020) 0.145    
Albumin (g/dL) 0.515 (0.184-1.438) 0.205    
Total bilirubin (mg/dL) 10.441 (2.511-43.410) 0.001 10.441 (2.511-43.410) 0.001
BUN (mg/dL) 0.926 (0.820-1.045) 0.213    
Prothrombin time (INR) 115.984 (1.728-7,786.880) 0.027    
PIVKA II (mAU/mL) 1.000 (1.000-1.000) 0.177    

TACE, transarterial chemoembolization; OR, odds ratio; CI, confidence interval; BMI, body mass index; BUN, blood urea nitrogen; INR, international normalized ratio; PIVKA II, protein induced by vitamin K absence-II.

Table 5.
Calculation of the Prediction of Patients with Reduced Liver Function without a Response after TACE Using the Regression Formula
  No response and liver function deteriorated to Child-Pugh class B or C
  Positive (n=27) Negative (n=94)
Calculation using regression formula    
 Positive (n=44) True positive (n=20) False positive (n=24)
 Negative (n=77) False negative (n=7) True negative (n=70)

Sensitivity=74.1%, specificity=74.5%, positive predictive value=45.5%, negative predictive value=90.9%. TACE, transarterial chemoembolization.

TOOLS
ORCID iDs

Jeong Han Kim
https://orcid.org/0000-0002-8383-8524

Similar articles