Abstract
Objective
This study aimed to evaluate the relationship between circulating interleukin (IL)-18 levels and systemic lupus erythematosus (SLE) and establish a correlation between plasma/serum IL-18 levels and SLE activity.
Methods
We performed a meta-analysis comparing plasma/serum IL-18 levels in patients with SLE to controls by using fixed or random effects model based on the heterogeneity.
Results
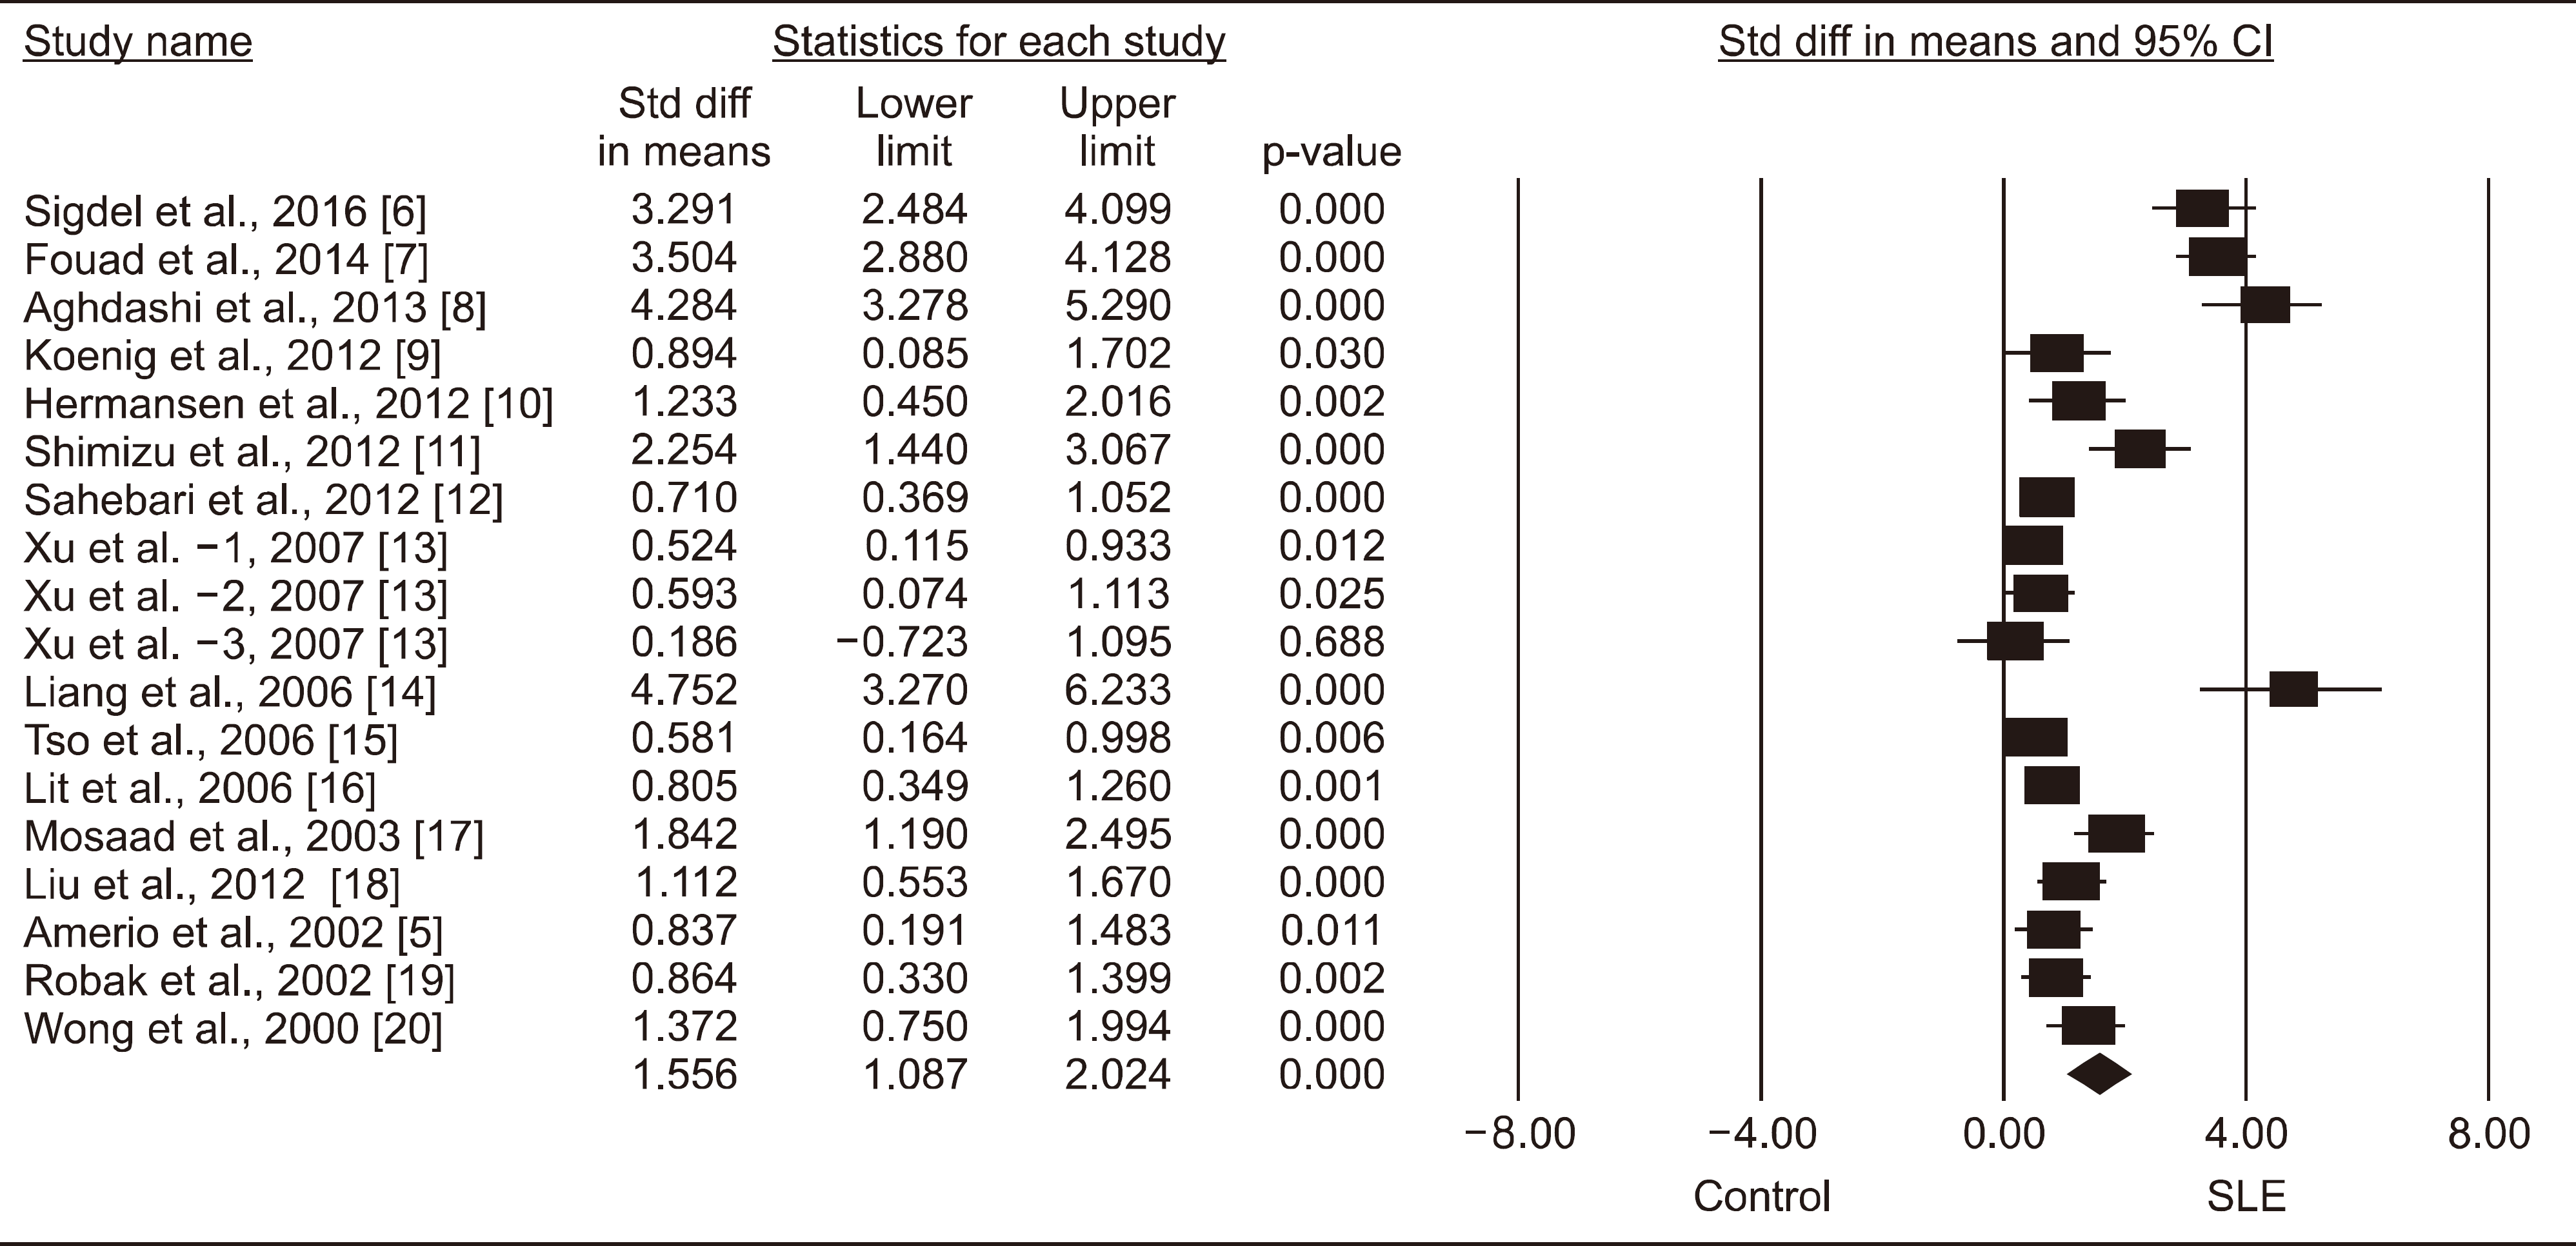
Sixteen studies with 659 SLE patients and 502 controls were included in this meta-analysis. Meta-analysis showed that IL-18 levels were significantly higher in the SLE group (standardized mean difference=1.556, 95% confidence interval=1.087∼2.024, p<0.001). Stratifying by ethnicity showed that IL-18 levels were significantly elevated in the SLE groups of European, Asian, and Arab populations. Stratification by adjustment for age and/or sex revealed a significantly higher IL-18 level in the SLE group, independently of the adjustment. Subgroup analysis by sample size showed significantly higher IL-18 levels in the SLE group for both large sample (n≥50) and small sample (n<50) subgroups. Subgroup analysis by data type showed significantly higher IL-18 levels in the SLE group for both original and calculated data populations.
Go to : 
REFERENCES
1. Ruiz-Irastorza G, Khamashta MA, Castellino G, Hughes GR. Systemic lupus erythematosus. Lancet. 2001; 357:1027–32.

2. Shao WH, Cohen PL. Disturbances of apoptotic cell clearance in systemic lupus erythematosus. Arthritis Res Ther. 2011; 13:202.

3. Nakamura K, Okamura H, Wada M, Nagata K, Tamura T. Endotoxin-induced serum factor that stimulates gamma interferon production. Infect Immun. 1989; 57:590–5.

4. Nakanishi K. Unique action of interleukin-18 on T cells and other immune cells. Front Immunol. 2018; 9:763.

5. Amerio P, Frezzolini A, Abeni D, Teofoli P, Girardelli CR, De Pità O, et al. Increased IL-18 in patients with systemic lupus erythematosus: relations with Th-1, Th-2, proinflammatory cytokines and disease activity. IL-18 is a marker of disease activity but does not correlate with proinflammatory cytokines. Clin Exp Rheumatol. 2002; 20:535–8.
6. Sigdel KR, Duan L, Wang Y, Hu W, Wang N, Sun Q, et al. Serum cytokines Th1, Th2, and Th17 expression profiling in active lupus nephritis-IV: from a Southern Chinese Han population. Mediators Inflamm. 2016; 2016; 4927530.

7. Fouad NA, Baraka EA, Hassan WA. Interleukin-18 gene polymorphisms in systemic lupus erythematosus: relation to disease status. Egypt J Immunol. 2014; 21:1–12.
8. Aghdashi M, Aribi S, Salami S. Serum levels of IL-18 in Iranian females with systemic lupus erythematosus. Med Arch. 2013; 67:237–40.

9. Koenig KF, Groeschl I, Pesickova SS, Tesar V, Eisenberger U, Trendelenburg M. Serum cytokine profile in patients with active lupus nephritis. Cytokine. 2012; 60:410–6.

10. Hermansen ML, Hummelshøj L, Lundsgaard D, Hornum L, Keller P, Fleckner J, et al. Increased serum β 2-micro-globulin is associated with clinical and immunological markers of disease activity in systemic lupus erythematosus patients. Lupus. 2012; 21:1098–104.
11. Shimizu C, Fujita T, Fuke Y, Ito K, Satomura A, Matsumoto K, et al. High circulating levels of interleukin-18 binding protein indicate the severity of glomerular involvement in systemic lupus erythematosus. Mod Rheumatol. 2012; 22:73–9.

12. Sahebari M, Rezaieyazdi Z, Nakhjavani MJ, Hatef M, Mahmoudi M, Akhlaghi S. Correlation between serum concentrations of soluble Fas (CD95/Apo-1) and IL-18 in patients with systemic lupus erythematosus. Rheumatol Int. 2012; 32:601–6.

13. Xu Q, Tin SK, Sivalingam SP, Thumboo J, Koh DR, Fong KY. Interleukin-18 promoter gene polymorphisms in Chinese patients with systemic lupus erythematosus: association with CC genotype at position-607. Ann Acad Med Singapore. 2007; 36:91–5.
14. Liang D, Ma W, Yao C, Liu H, Chen X. Imbalance of interleukin 18 and interleukin 18 binding protein in patients with lupus nephritis. Cell Mol Immunol. 2006; 3:303–6.
15. Tso TK, Huang WN, Huang HY, Chang CK. Elevation of plasma interleukin-18 concentration is associated with insulin levels in patients with systemic lupus erythematosus. Lupus. 2006; 15:207–12.
16. Lit LC, Wong CK, Tam LS, Li EK, Lam CW. Raised plasma concentration and ex vivo production of inflammatory chemokines in patients with systemic lupus erythematosus. Ann Rheum Dis. 2006; 65:209–15.

17. Mosaad YM, Metwally SS, Auf FA, AbdEL-Samee ER, el-Deek B, Limon NI, et al. Proinflammatory cytokines (IL-12 and IL-18) in immune rheumatic diseases: relation with disease activity and autoantibodies production. Egypt J Immunol. 2003; 10:19–26.
18. Liu X, Bao C, Hu D. Elevated interleukin-18 and skewed Th1: Th2 immune response in lupus nephritis. Rheumatol Int. 2012; 32:223–9.
19. Robak E, Woźniacka A, Sysa-Jedrzejowska A, Stepień H, Robak T. Circulating angiogenesis inhibitor endostatin and positive endothelial growth regulators in patients with systemic lupus erythematosus. Lupus. 2002; 11:348–55.
20. Wong CK, Ho CY, Li EK, Lam CW. Elevation of proinflammatory cytokine (IL-18, IL-17, IL-12) and Th2 cytokine (IL-4) concentrations in patients with systemic lupus erythematosus. Lupus. 2000; 9:589–93.
21. Moher D, Liberati A, Tetzlaff J, Altman DG. PRISMA Group. Preferred reporting items for systematic reviews and meta-analyses: the PRISMA statement. PLoS Med. 2009; 6:e1000097.

22. Hozo SP, Djulbegovic B, Hozo I. Estimating the mean and variance from the median, range, and the size of a sample. BMC Med Res Methodol. 2005; 5:13.

23. Ridout KK, Ridout SJ, Price LH, Sen S, Tyrka AR. Depression and telomere length: a meta-analysis. J Affect Disord. 2016; 191:237–47.

24. Cohen J. Statistical power analysis for the behavioral sciences. 2nd ed.Hillsdale: Lawrence Eribaum Associated;1988.
25. Egger M, Smith GD, Phillips AN. Meta-analysis: principles and procedures. BMJ. 1997; 315:1533–7.

27. Higgins JP, Thompson SG. Quantifying heterogeneity in a meta-analysis. Stat Med. 2002; 21:1539–58.

28. Egger M, Davey Smith G, Schneider M, Minder C. Bias in meta-analysis detected by a simple, graphical test. BMJ. 1997; 315:629–34.

29. Duval S, Tweedie R. Trim and fill: a simple funnel-plot-based method of testing and adjusting for publication bias in meta-analysis. Biometrics. 2000; 56:455–63.

30. [The levels of plasminogen and inhibitor of plasminogen activators of type 1 in antiphospholipid syndrome]. Ter Arkh. 2012; 84:50–7. Russian.
31. Neumann D, Del Giudice E, Ciaramella A, Boraschi D, Bossù P. Lymphocytes from autoimmune MRL lpr/lpr mice are hyperresponsive to IL-18 and overexpress the IL-18 receptor accessory chain. J Immunol. 2001; 166:3757–62.

32. Nolan KF, Greaves DR, Waldmann H. The human interleukin 18 gene IL18 maps to 11q22.2-q22.3, closely linked to the DRD2 gene locus and distinct from mapped IDDM loci. Genomics. 1998; 51:161–3.
33. Giedraitis V, He B, Huang WX, Hillert J. Cloning and mutation analysis of the human IL-18 promoter: a possible role of polymorphisms in expression regulation. J Neuroimmunol. 2001; 112:146–52.

Go to : 
 | Figure 1.Meta-analysis of relationship of interleukin-18 level with systemic lupus erythematosus (SLE). Std diff: standardized difference, CI: confidence interval. |
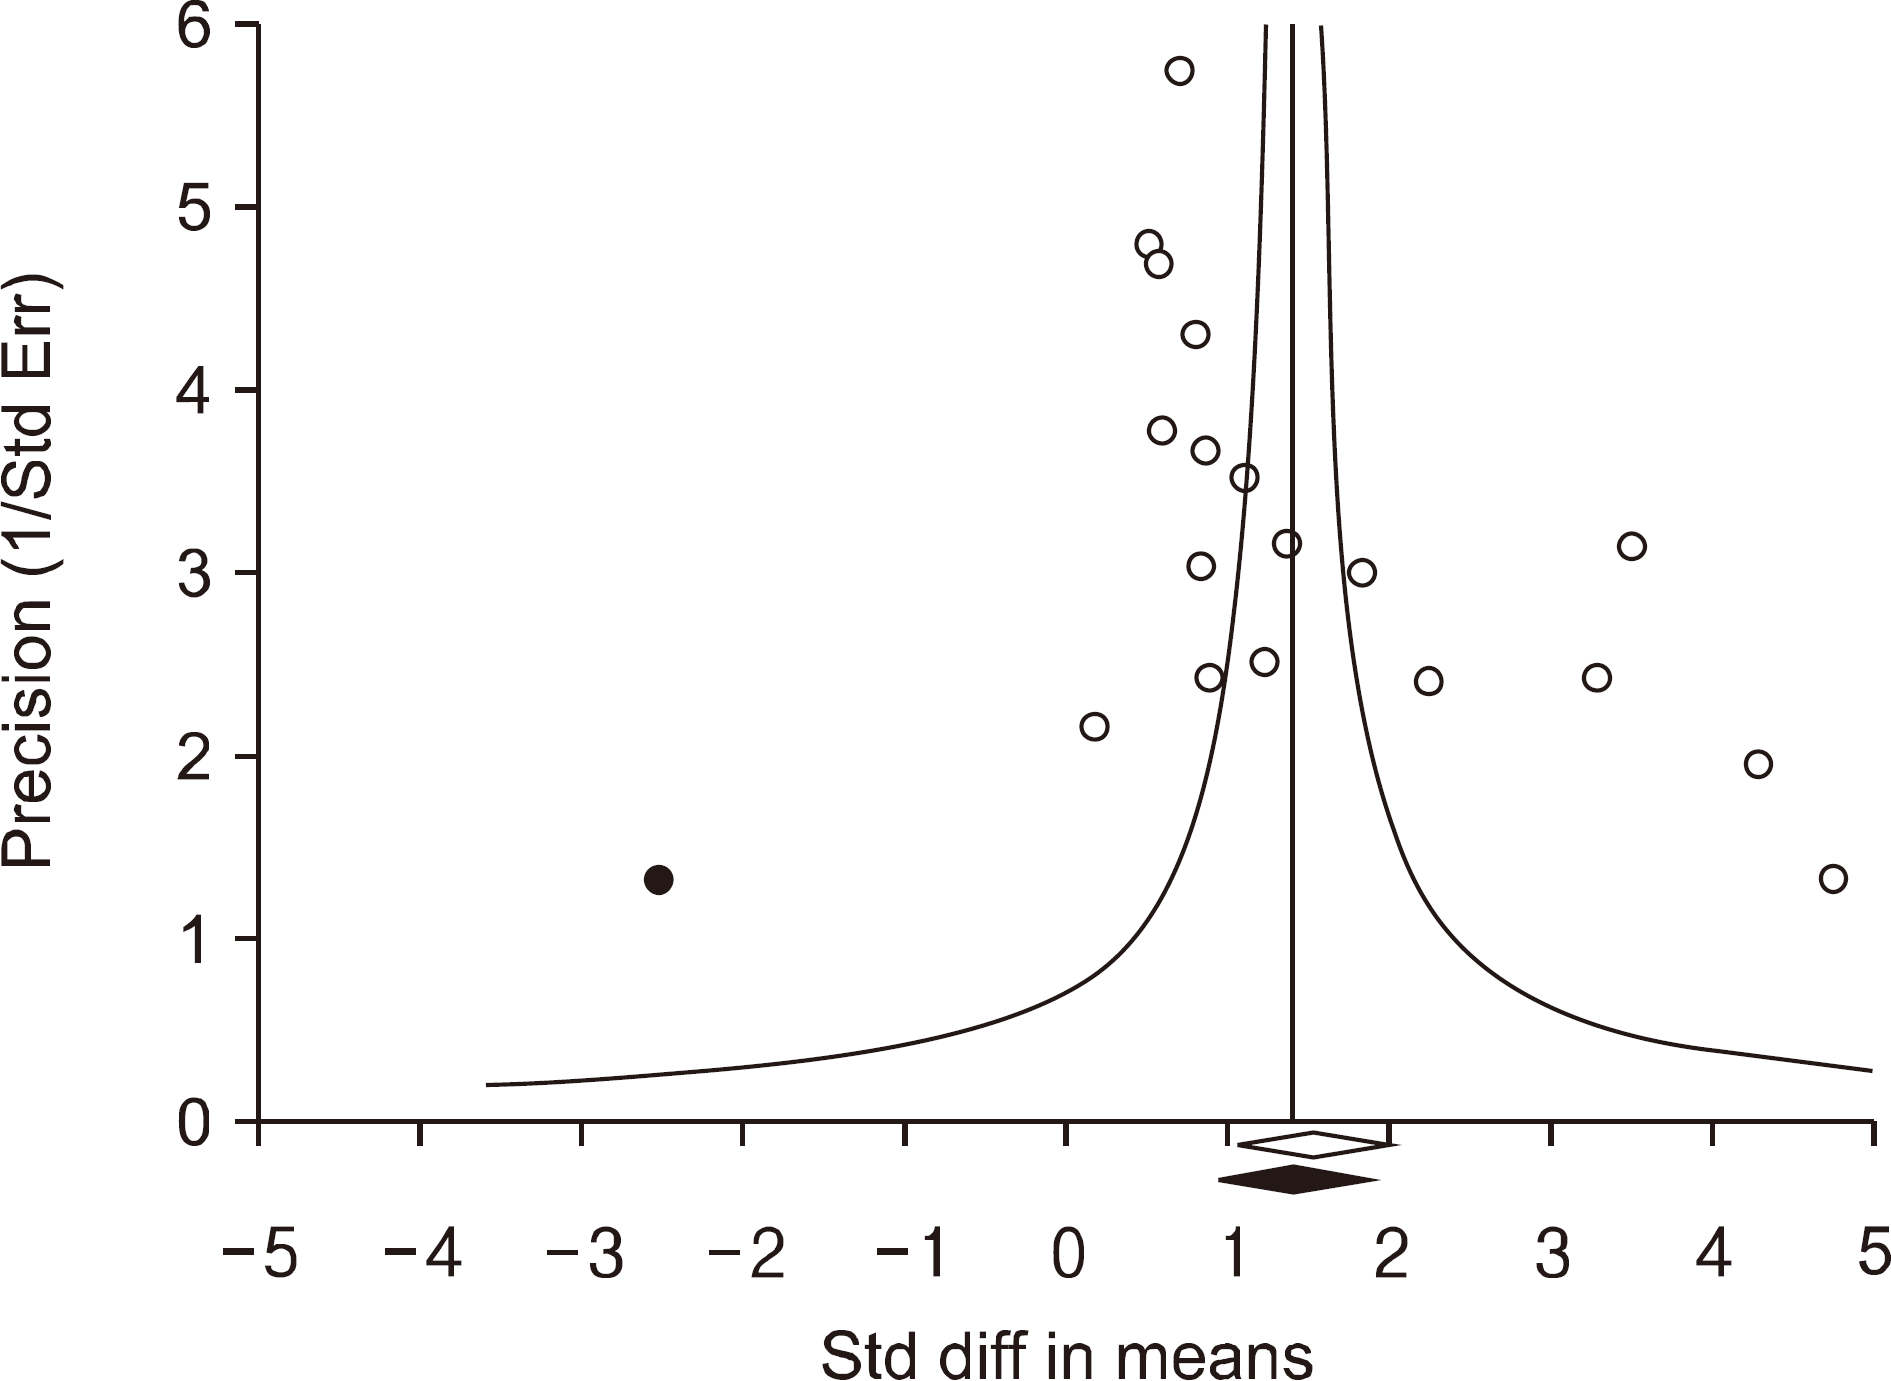
 | Figure 2.Funnel plot investigating the relation of inter-leukin-18 with systemic lupus erythematosus (Egger regression p-value=0.003). Filled circles reflect studies showing publication bias. Diamonds at the bottom of the figure display estimates of summary effect before (open) and after (filled) adjustment of publishing bias. Std diff: standardized difference, Std err: standardized error. |
Table 1.
Characteristics of individual studies included in the meta-analysis
| Author | Country | Ethnicity | Cohort size (n) | IL-18 levels (pg/mL) | Statistical findings | ||||
|---|---|---|---|---|---|---|---|---|---|
| Cases | Controls | Cases | Controls | SMD | Magnitude* | p-value | |||
| Sigdel et al., 2016 [6] | China | Asian | 32 | 24 | 76.12 | 11.67 | 3.291 | Large | <0.001 |
| Fouad et al., 2014 [7] | Egypt | Arab | 50 | 50 | 296.90 | 112.90 | 3.504 | Large | <0.001 |
| Aghdashi et al., 2013 [8] | Iran | Arab | 25 | 25 | 281.15 | 85.12 | 4.284 | Large | <0.001 |
| Koenig et al., 2012 [9] | Switzerland | European | 12 | 14 | 328.66 | 67.41 | 0.894 | Large | 0.030 |
| Hermansen et al., 2012 [10] | Denmark | European | 26 | 10 | 59.00 | 11.00 | 1.233 | Large | 0.002 |
| Shimizu et al., 2012 [11] | Japan | Asian | 12 | 32 | 570.00 | 244.00 | 2.254 | Large | <0.001 |
| Sahebari et al., 2012 [12] | Iran | Arab | 114 | 50 | 370.28 | 84.91 | 0.710 | Medium | <0.001 |
| Xu et al.-1, 2007 [13] | Singapore | Asian | 48 | 47 | 217.30 | 136.70 | 0.524 | Medium | 0.012 |
| Xu et al.-2, 2007 [13] | Singapore | Asian | 22 | 45 | 214.20 | 143.70 | 0.593 | Medium | 0.025 |
| Xu et al.-3, 2007 [13] | Singapore | Asian | 6 | 21 | 75.30 | 65.90 | 0.186 | Small | 0.688 |
| Liang et al., 2006 [14] | China | Asian | 16 | 11 | 767.00 | 238.90 | 4.752 | Large | <0.001 |
| Tso et al., 2006 [15] | Taiwan | Asian | 70 | 34 | 254.34 | 189.66 | 0.581 | Medium | 0.006 |
| Lit et al., 2006 [16] | Hong Kong | Asian | 40 | 40 | 250.00 | 171.33 | 0.805 | Large | 0.001 |
| Mosaad et al., 2003 [17] | Egypt | Arab | 32 | 21 | 2343.46 | 24.41 | 1.842 | Large | <0.001 |
| Liu et al., 2012 [18] | China | Asian | 46 | 20 | 146.00 | 48.00 | 1.112 | Large | <0.001 |
| Amerio et al., 2002 [5] | Italy | European | 20 | 20 | 278.20 | 185.00 | 0.837 | Large | 0.011 |
| Robak et al., 2002 [19] | Poland | European | 52 | 20 | 753.30 | 267.30 | 0.864 | Large | 0.002 |
| Wong et al., 2000 [20] | Hong Kong | Asian | 36 | 18 | 368.70 | 141.10 | 1.372 | Large | <0.001 |
Table 2.
Meta-analysis of the association between circulating IL-18 levels and SLE
| Groups | Population | No. of studies | Test of association | Test of heterogeneity | ||||
|---|---|---|---|---|---|---|---|---|
| SMD† | 95% CI | p-value | Model | p-value | I2 | |||
| All | Overall | 18 | 1.556 | 1.087∼2.024 | <0.001 | R | <0.001 | 91.0 |
| Ethnicity | European | 4 | 0.929 | 0.596∼1.261 | <0.001 | F | 0.868 | 0 |
| Asian | 10 | 1.397 | 0.828∼1.966 | <0.001 | R | <0.001 | 88.9 | |
| Arab | 4 | 2.549 | 0.916∼4.183 | 0.002 | R | <0.001 | 96.5 | |
| Adjustment | Yes* | 11 | 1.701 | 1.062∼2.339 | <0.001 | R | <0.001 | 92.7 |
| NA | 7 | 0.898 | 0.663∼1.134 | <0.001 | R | <0.001 | 86.4 | |
| Sample size | Number ≥50 | 12 | 1.560 | 0.992∼2.128 | <0.001 | R | <0.001 | 92.8 |
| Number <50 | 6 | 1.566 | 0.647∼2.486 | 0.001 | R | <0.001 | 85.6 | |
| Data type | Original | 13 | 1.652 | 1.040∼2.264 | <0.001 | R | <0.001 | 92.1 |
| Calculated | 5 | 1.343 | 0.578∼2.108 | 0.001 | R | <0.001 | 88.5 | |


 PDF
PDF ePub
ePub Citation
 Print
Print


 XML Download