Journal List > Yonsei Med J > v.61(4) > 1144369

Lee, Kim, Kim, Lee, and Lim: Effects of Indoor Air Purifiers on Children with Asthma

Abstract

Purpose

To evaluate the effects of air purifiers on the concentrations of indoor air pollutants and on asthma control in children.

Materials and Methods

In this randomized crossover trial, daily use of an air purifier filter was compared with a matched placebo with the filter off. Thirty elementary school students who had asthma were enrolled and randomly allocated to one of two groups. The primary endpoints were changes in indoor air quality, asthma severity, lung function, airway inflammatory, urine microbiome, and phthalate after the installation of air purifiers. PM2.5 and CO2 were measured as indoor air pollutants. Asthma severity was assessed in terms of both symptom and medication scores acquired using a daily questionnaire. The higher the score, the better the symptom or the less frequent the use of medication. Peak expiratory flow rate and fractional exhaled nitric oxide were also measured.

Results

The mean age of the enrolled patients was 9.2±1.98 years. The mean concentration of PM2.5 was 17.0 µg/m3 in the filter-off condition, but significantly lower at 9.26 µg/m3 in the filter-on condition. Medication scores were 6.9 for the filter-off and 7.12 for the filter-on conditions, reflecting a statistically significant decrease in the frequency of medications used during air purifier operation. Bacterial richness, as determined using the Chao 1 index, was markedly lower in the filter-on than the filter-off condition.

Conclusion

This study suggests that air purifiers benefit medication burden in children with asthma by reducing PM2.5 levels.

INTRODUCTION

The use of air purifiers is rapidly increasing due to increases in fine dust and respiratory diseases.1 Particulate matter with an aerodynamic diameter of 2.5 µm or less (PM2.5) is a principal component of indoor air pollution in homes and is a major cause of asthma exacerbation and lung dysfunction.23 With people spending most of their time indoors nowadays, there has been increasing interest in the practical effect of using air purifiers to improve indoor air pollution.
In South Korea, a recent study suggested that air purifiers may improve the severity of atopic dermatitis by reducing air pollutants and fine particles.4 However, no studies have analyzed the effects of air purifiers on children with asthma in South Korea. According to a recent study in Fresno, CA, air purifiers are effective in reducing indoor PM2.5 and significantly improve symptoms and peak flow rates in children with allergic diseases.5 However, the study was limited by the small number of study subjects and a very low basal PM2.5 levels in the city where the study was conducted. Also, recent evidence has indicated that microbial diversity and phthalate can exacerbate asthma.67
The purpose of this study was to evaluate the control of indoor air quality through the use of air purifier actually and its effects on Korean children with asthma. This study measured PM2.5 levels, asthma severity, lung function, and urine microbiome and phthalate concentrations.

MATERIALS AND METHODS

Patients and study setting

The participants consisted of elementary school students who were living in cities in the Incheon and Gyeonggi-do regions and who had been diagnosed with asthma at Inha Hospital. The diagnosis was determined according to the GINA guidelines.8 This study was conducted as a randomized, single-blind, cross-over study between September 3 and October 27, 2018 with a 2-week wash out period.

Inclusion/exclusion criteria

The inclusion criteria comprised at least two periods of asthma exacerbation in the last year. We excluded children who had been born during gestational week 34 or earlier, children with a birth weight of 2.5 kg or lower, children with a congenital deformity, children with immune dysfunction, and cases where consent to participate was not given.

Intervention

A total of 30 asthma patients were randomly allocated to Group A (n=15) or Group B (n=15) (Fig. 1). The 30 households participating in the study installed an air purifier (TOWER XQ; Winix, Siheung, South Korea) in the living room, where the children spent most of their time. Participants were instructed to use the air purifier 24 hours per day, every day, for 6 weeks. The air purifiers operated normally throughout the study period, without any problems. Group A used the air purifier with a filter for the first 3 weeks, while Group B used the air purifier without a filter during that time, so that it did not provide any actual function. Following a 2-week filter change period, the groups were changed over the next 3 weeks (Supplementary Table 1, only online).

Outcome measurement

We compared indoor PM2.5, carbon dioxide (CO2) concentration, relative humidity, and temperature before and after air purifier use. We also examined whether there were any changes in asthma symptoms and frequency of medication use. To compare lung function and airway inflammation, we measured peak expiratory flow rate (PEFR) and fractional exhaled nitric oxide (FeNO). In addition, we analyzed changes in microbes and phthalate metabolites in urine.

Indoor air quality

Indoor air quality data, including PM2.5, CO2, temperature, relative humidity, were obtained using ESCORT (ESCORT, Asan, Korea). PM2.5 concentrations were measured through a laserlight scattering sensor at 2-minute intervals in each household's main living space. Then, to match our health symptom data, we calculated daily mean values. We also evaluated the performance of a real-time PM2.5 sensor, compared with the US EPA Federal Equivalent Method.9

Asthma control questionnaire

To objectively measure symptom improvements and changes in medication use after air purifier use, we had the participants complete the asthma control questionnaire every day. The asthma control questionnaire used in this study was based on the Test for Respiratory and Asthma Control in Kids (TRACK)10 (Supplementary Tables 2 and 3, only online). The response to each question was scored, with higher scores indicating greater improvement in symptoms and a lower frequency of medication use.

Lung function test

We used PEFR as surrogate marker for lung function. The PEFR measurement was performed using Smart One® (Medical International Research; Roma, Italy). Portable measuring instruments were distributed to the study subjects, and measurements were taken three times each morning and evening, the highest value of which was recorded. Measurements were linked to mobile phone applications, and data were extracted for each follow-up visit.

Airway inflammatory test

We used FeNO as a surrogate marker for airway inflammation. FeNO was measured at each follow-up visit using NIOX MINO® (Aerocrine, Solna, Sweden). To do so, the participant was asked to sit in a chair and, while wearing a nose plug, inhale nitric oxide-free air to maximum lung capacity. Then, while biting a mouthpiece and looking at a monitor, the participant exhaled at a constant rate of 50 mL/s. In accordance with the NIOX MINO® instruction manual, the test was performed once using the method in the ATS/ERS guidelines11 and repeated in the event of errors.

Isolation of microbiome extracellular vesicles and DNA extraction from urine

Two milliliters of voided clean catch midstream urine were collected and stored at −20℃. To isolate the extracellular vesicles, urine samples underwent differential centrifugation by a micro-centrifuge at 10000×g for 10 minutes at 4℃.12 The supernatant was then filtered through a 0.22-µm filter to eliminate bacteria and foreign particles. For DNA extraction, isolated extracellular vesicles were boiled at 100℃ for 40 minutes and centrifuged at 13000 rpm for 30 minutes at 4℃ to eliminate the remaining floating particles and waste. Subsequently, the supernatant was collected and subjected to DNA isolation using a FastDNA® SPIN Kit for Soil (MP Biomedicals, Solon, OH, USA) according to the standard protocol for DNA extraction. The DNA in each sample was quantified using an Epoch™ Spectrophotometer system (BioTek Instruments, Winooski, VT, USA).

16S rDNA sequencing and taxonomic assignment

Bacterial genomic DNA PCR amplification was executed with primers specific for V3–V4 hypervariable regions of the 16S rDNA gene. The amplicons were pooled, and the sequencing was carried out at ChunLab, Inc. (Seoul, Korea), with a MiSeq Sequencing system (Illumina Inc., San Diego, CA, USA) according to the manufacturer's instructions.
Raw reads were processed with quality check and filtering of low quality (<Q25) reads by Trimmomatic 0.32.13 After passing quality control, paired-end sequence data were merged together using PANDAseq.14 Primers were then trimmed with a ChunLab in-house program at a similarity cut off of 0.8. Non-specific amplicons that do not encode 16S rRNA were detected by HMMER's hmmsearch program15 with 16S rRNA profiles. Sequences were denoised using DUDE-Seq,16 and non-redundant reads were extracted by UCLUST-clustering.17 The EzBio-Cloud database was used for taxonomic assignment using USEARCH (8.1.1861_i86linux32),17 followed by more precise pairwise alignment.18 UCHIME19 and the non-chimeric 16S rRNA database from EzBioCloud were used to detect chimera on reads that contained a less than 97% best hit similarity rate. Sequence data were then clustered using CD-HIT20 and UCLUST.17 The alpha diversity indices and rarefaction curves were estimated by in-house code.

Urine phthalate

For analysis of monophthalates, we focused on mono-n-butylphthalate, mono-(2-ethyl-5-hydroxyhexyl) phthalate, mono-(2-ethyl-5-oxohexyl) phthalate, mono-(2-ethyl-5-carboxylpentyl) phthalate, and mono-benzylphthalate, which are widely used metabolites of di-n-butyl phthalate (DnBP), di(2-ethylhexyl) phthalate (DEHP), and butylbenzyl phthalate (BBzP). After collection, urine specimens were frozen at −70℃ until analyzed. Samples were thawed at room temperature before pretreatment. In an 8-mL glass vial, 1 mL of 2 M sodium acetate and 20 µL of β-glucuronidase were added to 500 µL of each urine sample. After vortexing for 10 minutes using a large vortexer, the mixture was incubated at 37℃ for 16 hours to hydrolyze the phthalate metabolite complexes. After adding 100 µL of 2 M HCl, 50 µL of internal standard, and 4 mL of ethyl acetate and vortexing for 15 minutes, the solution was centrifuged for 5 minutes at 3000 rpm. The supernatant was collected for analysis, with care being taken not to disturb the solid at the bottom of the tube. The quantity of phthalate metabolites in the samples was measured using LC-MS/MS.

Statistical analysis

All data analysis was performed using the one-way ANOVA procedure in Statistical Analysis System (SAS), version 9.4 (SAS Institute Inc., Cary, NC, USA), at a 95% confidence level.

Ethical consideration

This clinical study was approved by the Research Ethics Committee of Inha University Hospital (IRB No. 2018-07-007), and written consent was obtained from the legal guardians of all participants.

RESULTS

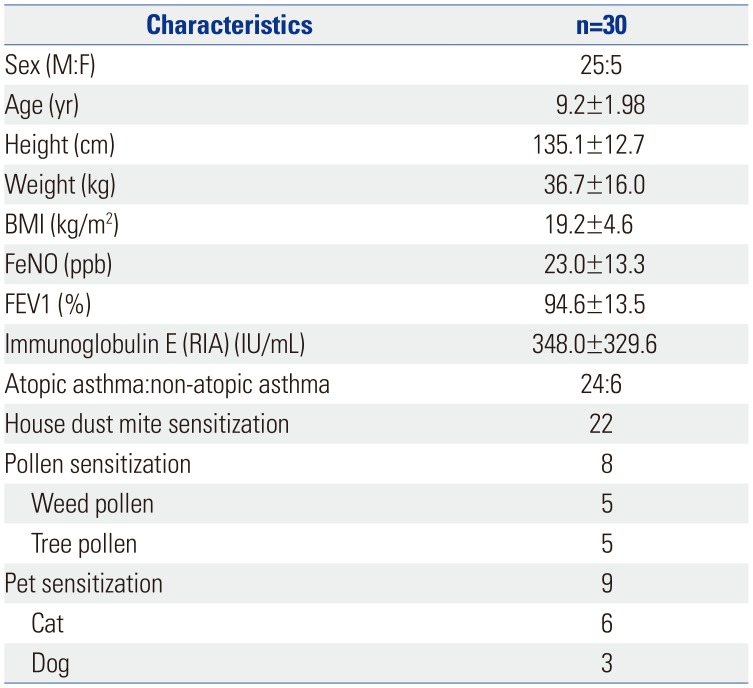
A total of 30 children were randomized and evenly assigned to two groups. All of them completed the study without any complications. The mean age of the enrolled patients was 9.20±1.98 years (minimum–maximum age: 6.08–12.41 years). Baseline characteristics, including sex, age, height, weight, body mass index, FeNO, forced expiratory volume in 1 second (FEV1), immunoglobulin E (IgE), and allergen sensitization, are summarized in Table 1 and Supplementary Table 4 (only online).

Indoor air pollutant concentration

PM2.5 and CO2 concentrations were measured to assess indoor air pollution. The mean levels of PM2.5 were 17 µg/m3 with the filter off and 9.26 µg/m3 with the filter on, indicating a statistically significant decrease when the air purifier was used (p<0.001) (Table 2). However, CO2 concentration, relative humidity, and temperature showed no significant differences depending on air purifier use (Supplementary Table 5, only online).

Asthma symptoms, medication use, and PEFR

Symptom scores were 14.03 in the filter-off condition and 13.97 in the filter-on condition, with no significant difference between the two (Table 3). Medication scores were 6.9 in the filter-off condition and 7.12 in the filter-on condition, reflecting a statistically significant decrease in the use of anti-asthmatic medications when the air purifier was used (p<0.001) (Table 3). PEFRs were 326.24 L/min in the filter-off condition and 321.33 L/min in the filter-on condition, which was not a statistically significant difference (Table 4).

FeNO, urine microbiome, and urine phthalate

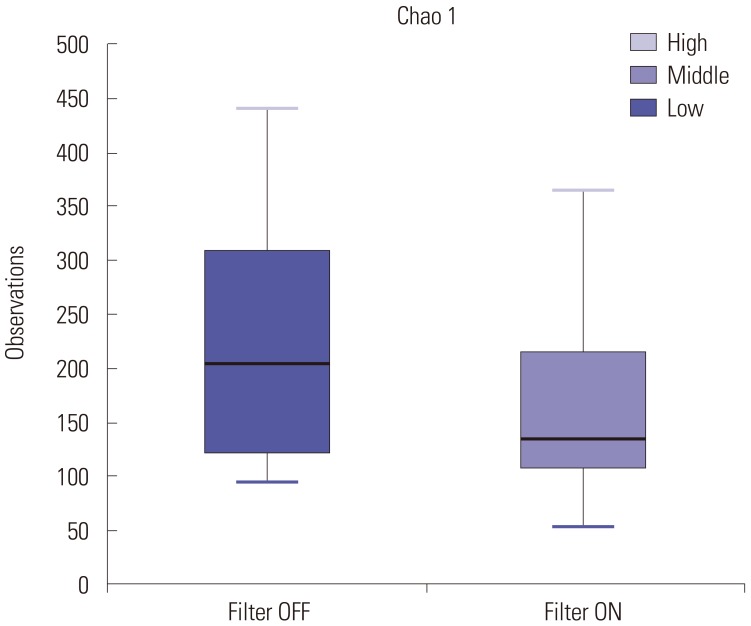
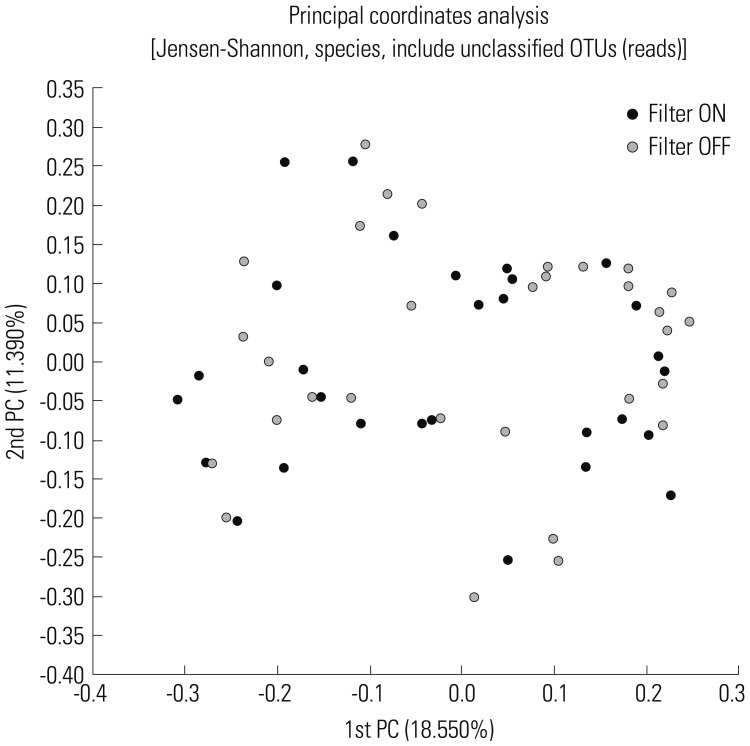
FeNO levels were 27.76 ppb in the filter-off condition and 28.5 ppb in the filter-on condition, which was not a statistically significant difference (Table 4). Bacterial richness, as determined using the Chao 1 index, was markedly lower in the filter-on condition than in the filter-off condition (Fig. 2). No significant difference in the diversity of bacterial extracellular vesicles between the filter-on and -off conditions was observed under principal component analysis (Fig. 3). The concentration of phthalate metabolites also showed no significant difference between the two (Table 5).

DISCUSSION

PM2.5 is known to penetrate the vascular and lymphatic systems after inhalation and to be strongly associated with respiratory and allergic diseases.21 Moreover, a significant association between short-term PM exposure and asthma-related hospital visits has been demonstrated.22 Accordingly, reducing indoor exposure to PM2.5 may be beneficial to asthma management. The results of this study showed that the use of an air purifier for 3 weeks significantly decreased indoor PM2.5 levels, thereby reducing the frequency of medication use and urine microbiome burden in children with asthma.
As of now, the role of an air purifier in allergic disease prevention continues to be debated. While a number of studies have evaluated the impact of air purifiers on allergic disease, many are limited by small sample sizes and inadequate blinding.23 A study funded by Samsung Electronics Co., Ltd demonstrated that reducing indoor PM2.5 levels with air purifiers improved childhood asthma control test scores and mean evening peak flow rates.4 However, since the city where the study was conducted had a very low basal PM2.5 level of 7.42 µg/m3, and the concentration change due to the use of air purifiers was not significant, it is thought that the symptom relief will not be significant. It is also likely that the placebo effect was not excluded since crossover study was not performed with a small sample size of 9 people.
In the present study, we documented a significant reduction in indoor PM2.5 levels and improvement in medication scores. While the outdoor temperature and air pollutants might have differed during the cross-over period, the study was conducted under the same conditions during this period, and thus, the difference in outdoor atmospheric factors would not have affected the study outcomes. In addition, since the basal PM2.5 value was higher than that in the study mentioned above, the decrease in PM2.5 values after use of the air purifier is more meaningful. Moreover, the decrease in the frequency of medication used was significant since the placebo effect was excluded through the single blind and cross-over study design with a sample size of 30 people.
There is a hygiene hypothesis that suggests that decreased microbiome diversity is an environmental cause of increased asthma prevalence.6 Although the exact mechanism by which PM2.5 exposure perturbs airway microbiome is unknown, it has been found that individuals with better lung function have greater airway bacteria diversity in the bronchial tree.24 In support thereof, previous studies in patients with respiratory or allergic diseases have consistently shown reduced airway microbiome diversity and increased total richness.25 In our study, there was a significant decrease in urine microbiome richness in the filter-on condition, while there was no significant difference in urine bacterial diversity. Also, another study demonstrated that the number of airborne fungi decreases when an air purifier fan is on.26 These results suggest that air purifiers are beneficial to asthma patients by reducing total microbiome burden. Accordingly, we suggest that the urine microbiome burden is significantly reduced with the use of an air purifier to filter out and reduce the number and volume of bacteria in indoor air.
Recent research has proposed that phthalates, which are used as plasticizers, can affect bronchial epithelial cells to cause remodeling, resulting in asthma exacerbation,7 and significant correlations between concentrations of dust in indoor air and excreted phthalate metabolites in urine.27 We also observed higher phthalate concentrations in the asthma patient group than in a healthy control group (data not shown). This is consistent with the hypothesis of previous studies, in which phthalates exacerbate asthma by causing remodeling of the bronchial epithelium.28 However, in this study, urine phthalate metabolites did not differ between the individuals using the air purifier and those who were not, perhaps because of the route of phthalate exposure. Specifically, in prior research, the routes of phthalate exposure have included ingestion, inhalation, and direct dermal absorption.29 In the present study, DEHP and BBzP exposure mostly occurred by ingestion, while DnBP exposure occurred via inhalation and dermal absorption, suggesting that using an air purifier filter reduces phthalate exposure by inhalation, but does not affect exposure by ingestion or dermal absorption.
Our study also evaluated the role of PM2.5 in respiratory function and respiratory inflammation. It has been shown that urban air pollution is associated with PEFR decrements in children.30 As a well-known noninvasive biomarker for assessing airway inflammation, FeNO has been positively linked to exposure to PM2.5 in recent human studies.3132 In our study, no significant changes in asthma scores, PEFR, FeNO, or urine phthalate values were identified. Considering that a PM2.5 concentration exceeding the alarm standard set by the Ministry of Environment occurred only 3 days during the study period, it would be difficult to expect the air purifier would exert its maximum effect (Supplementary Fig. 1, only online).
In conclusion, we found that the indoor PM2.5 concentrations significantly decreased through the use of air purifier for 3 weeks, thereby reducing the frequency of medications used and significantly reducing the urine microbiome burden in children with asthma. We concluded that air purifiers can have a positive effect on the health of asthma patients by filtering fine dust and microbes from indoor air. This study can be used as basic data for further studies in the future, given that it is the first study in Korea on the effects of using air purifiers on children with asthma.

ACKNOWLEDGEMENTS

This study was supported by the Korea Environmental Industry and Technology Institutes and the Korea Ministry of Environment.

Notes

This manuscript was presented at the 69th Conference of the Korean Pediatric Society in 2019.

The authors have no potential conflicts of interest to disclose.

AUTHOR CONTRIBUTIONS:

  • Conceptualization: Dae Hyun Lim.

  • Data curation: Sungroul Kim and Dae Hyun Lim.

  • Formal analysis: Ga Hee Lee, Sungroul Kim, and Dae Hyun Lim.

  • Funding acquisition: Sungroul Kim and Dae Hyun Lim.

  • Investigation: Sangwoon Lee, Sungroul Kim, and Dae Hyun Lim.

  • Methodology: Sungroul Kim and Dae Hyun Lim.

  • Project administration: Dae Hyun Lim.

  • Resources: Jeong Hee Kim and Dae Hyun Lim.

  • Software: Ga Hee Lee, Sangwoon Lee, Sungroul Kim, and Dae Hyun Lim.

  • Supervision: Dae Hyun Lim.

  • Validation: Sungroul Kim, Jeong Hee Kim, and Dae Hyun Lim.

  • Visualization: Sungroul Kim and Dae Hyun Lim.

  • Writing—original draft: Ga Hee Lee and Dae Hyun Lim.

  • Writing—review & editing: Ga Hee Lee and Dae Hyun Lim.

  • Approval of final manuscript: all authors.

References

1. Park C. Air purifier market and technology trends. J Korea Inst Archit Sustain Environ Build Syst. 2016; 10:7–11.
2. Guarnieri M, Balmes JR. Outdoor air pollution and asthma. Lancet. 2014; 383:1581–1592. PMID: 24792855.
crossref
3. Breysse PN, Diette GB, Matsui EC, Butz AM, Hansel NN, McCormack MC. Indoor air pollution and asthma in children. Proc Am Thorac Soc. 2010; 7:102–106. PMID: 20427579.
crossref
4. Park HC, Kim YH, Kim JE, Ko JY, Nam Goung SJ, Lee CM, et al. Effect of air purifier on indoor air quality and atopic dermatitis. Allergy Asthma Respir Dis. 2013; 1:248–256.
crossref
5. Park HK, Cheng KC, Tetteh AO, Hildemann LM, Nadeau KC. Effectiveness of air purifier on health outcomes and indoor particles in homes of children with allergic diseases in Fresno, California: a pilot study. J Asthma. 2017; 54:341–346. PMID: 27723364.
crossref
6. Webley WC, Aldridge KL. Infectious asthma triggers: time to revise the hygiene hypothesis? Trends Microbiol. 2015; 23:389–391. PMID: 26070971.
crossref
7. Jaakkola JJ, Knight TL. The role of exposure to phthalates from polyvinyl chloride products in the development of asthma and allergies: a systematic review and meta-analysis. Environ Health Perspect. 2008; 116:845–853. PMID: 18629304.
crossref
8. Global Initiative for Asthma. Global strategy for asthma management and prevention. 2018. accessed on 2018 August 1. Available at: https://ginasthma.org/wp-content/uploads/2019/01/2018-GINA.pdf.
9. Environmental Protection Agency. Automated equivalent method (EQPM-1090-079). Fed Regist. 1990; 55:43406.
10. Murphy KR, Zeiger RS, Kosinski M, Chipps B, Mellon M, Schatz M, et al. Test for Respiratory and Asthma Control in Kids (TRACK): a caregiver-completed questionnaire for preschool-aged children. J Allergy Clin Immunol. 2009; 123:833–839. PMID: 19348922.
crossref
11. American Thoracic Society. European Respiratory Society. ATS/ERS recommendations for standardized procedures for the online and offline measurement of exhaled lower respiratory nitric oxide and nasal nitric oxide, 2005. Am J Respir Crit Care Med. 2005; 171:912–930. PMID: 15817806.
12. Lee EY, Bang JY, Park GW, Choi DS, Kang JS, Kim HJ, et al. Global proteomic profiling of native outer membrane vesicles derived from Escherichia coli. Proteomics. 2007; 7:3143–3153. PMID: 17787032.
13. Bolger AM, Lohse M, Usadel B. Trimmomatic: a flexible trimmer for Illumina sequence data. Bioinformatics. 2014; 30:2114–2120. PMID: 24695404.
crossref
14. Masella AP, Bartram AK, Truszkowski JM, Brown DG, Neufeld JD. PANDAseq: paired-end assembler for illumina sequences. BMC Bioinformatics. 2012; 13:31. PMID: 22333067.
crossref
15. Eddy SR. Accelerated profile HMM searches. PLoS Comput Biol. 2011; 7:e1002195. PMID: 22039361.
crossref
16. Lee B, Moon T, Yoon S, Weissman T. DUDE-Seq: fast, flexible, and robust denoising for targeted amplicon sequencing. PLoS One. 2017; 12:e0181463. PMID: 28749987.
crossref
17. Edgar RC. Search and clustering orders of magnitude faster than BLAST. Bioinformatics. 2010; 26:2460–2461. PMID: 20709691.
crossref
18. Myers EW, Miller W. Optimal alignments in linear space. Comput Appl Biosci. 1988; 4:11–17. PMID: 3382986.
crossref
19. Edgar RC, Haas BJ, Clemente JC, Quince C, Knight R. UCHIME improves sensitivity and speed of chimera detection. Bioinformatics. 2011; 27:2194–2200. PMID: 21700674.
crossref
20. Fu L, Niu B, Zhu Z, Wu S, Li W. CD-HIT: accelerated for clustering the next-generation sequencing data. Bioinformatics. 2012; 28:3150–3152. PMID: 23060610.
crossref
21. Samet JM, Dominici F, Curriero FC, Coursac I, Zeger SL. Fine particulate air pollution and mortality in 20 U.S. cities, 1987-1994. N Engl J Med. 2000; 343:1742–1749. PMID: 11114312.
crossref
22. Song DJ, Choi SH, Song WJ, Park KH, Jee YK, Cho SH, et al. The effects of short-term and very short-term particulate matter exposure on asthma-related hospital visits: National Health Insurance data. Yonsei Med J. 2019; 60:952–959. PMID: 31538430.
crossref
23. Wood RA. Air filtration devices in the control of indoor allergens. Curr Allergy Asthma Rep. 2002; 2:397–400. PMID: 12165206.
crossref
24. Wang L, Cheng H, Wang D, Zhao B, Zhang J, Cheng L, et al. Airway microbiome is associated with respiratory functions and responses to ambient particulate matter exposure. Ecotoxicol Environ Saf. 2019; 167:269–277. PMID: 30342360.
crossref
25. Hong SN, Park P, Cho SH, Kim DY. Microbiome of the upper airway focusing on chronic rhinosinusitis and allergic rhinitis. Allergy Asthma Respir Dis. 2016; 4:399–405.
crossref
26. Hashimoto K, Kawakami Y. Effectiveness of airborne fungi removal by using a HEPA air purifier fan in houses. Biocontrol Sci. 2018; 23:215–221. PMID: 30584208.
crossref
27. Fromme H, Lahrz T, Kraft M, Fembacher L, Dietrich S, Sievering S, et al. Phthalates in German daycare centers: occurrence in air and dust and the excretion of their metabolites by children (LUPE 3). Environ Int. 2013; 61:64–72. PMID: 24103347.
crossref
28. Jepsen KF, Abildtrup A, Larsen ST. Monophthalates promote IL-6 and IL-8 production in the human epithelial cell line A549. Toxicol In Vitro. 2004; 18:265–269. PMID: 15046772.
crossref
29. Wormuth M, Scheringer M, Vollenweider M, Hungerbühler K. What are the sources of exposure to eight frequently used phthalic acid esters in Europeans? Risk Anal. 2006; 26:803–824. PMID: 16834635.
crossref
30. Correia-Deur JE, Claudio L, Imazawa AT, Eluf-Neto J. Variations in peak expiratory flow measurements associated to air pollution and allergic sensitization in children in Sao Paulo, Brazil. Am J Ind Med. 2012; 55:1087–1098. PMID: 22544523.
crossref
31. Salam MT, Byun HM, Lurmann F, Breton CV, Wang X, Eckel SP, et al. Genetic and epigenetic variations in inducible nitric oxide synthase promoter, particulate pollution, and exhaled nitric oxide levels in children. J Allergy Clin Immunol. 2012; 129:232–239. PMID: 22055874.
crossref
32. Chen R, Qiao L, Li H, Zhao Y, Zhang Y, Xu W, et al. Fine particulate matter constituents, nitric oxide synthase DNA methylation and exhaled nitric oxide. Environ Sci Technol. 2015; 49:11859–11865. PMID: 26372312.
crossref

SUPPLEMENTARY MATERIALS

Supplementary Table 1

Summary of Inspection List
ymj-61-310-s001.pdf

Supplementary Table 2

Symptom Score (Asthma Control Questionnaire)
ymj-61-310-s002.pdf

Supplementary Table 3

Medication Score (Asthma Control Questionnaire)
ymj-61-310-s003.pdf

Supplementary Table 4

Prescribed Medicines among Enrolled Asthma Patients
ymj-61-310-s004.pdf

Supplementary Table 5

Outdoor Temperature and Air Pollutant Concentrations During Cross-Over Period
ymj-61-310-s005.pdf

Supplementary Fig. 1

PM2.5 atmospheric distribution
ymj-61-310-s006.pdf
Fig. 1

Overview of the study design. Randomized, crossover trial. Each patient was randomly allocated to one of the two possible sequences. *Clinic visits.

ymj-61-310-g001
Fig. 2

Alpha-diversity as determined by the Chao 1 index (p=0.040). Alpha diversity summarize the structure of an ecological community with respect to its richness.

ymj-61-310-g002
Fig. 3

Beta-diversity defined by principal component analysis. Beta diversity summarize the quantified differences in species composition between ecological community. OTU, operational taxonomic unit; PC, principal component.

ymj-61-310-g003
Table 1

Baseline Characteristics of the Study Population

ymj-61-310-i001
Characteristics n=30
Sex (M:F) 25:5
Age (yr) 9.2±1.98
Height (cm) 135.1±12.7
Weight (kg) 36.7±16.0
BMI (kg/m2) 19.2±4.6
FeNO (ppb) 23.0±13.3
FEV1 (%) 94.6±13.5
Immunoglobulin E (RIA) (IU/mL) 348.0±329.6
Atopic asthma:non-atopic asthma 24:6
House dust mite sensitization 22
Pollen sensitization 8
 Weed pollen 5
 Tree pollen 5
Pet sensitization 9
 Cat 6
 Dog 3

BMI, body mass index; FeNO, fractional exhaled nitric oxide; FEV1, forced expiratory volume in 1 second; RIA, radioimmunoassay.

Values are presented as a mean±standard deviation.

Table 2

Changes in Indoor Air Quality

ymj-61-310-i002
Variable Filter OFF Filter ON p value
Temperature (℃) 29.72±1.89 29.63±2.75 0.543
Relative humidity (%) 34.68±7.38 34 22±7.88 0.347
CO2 (ppm) 743.48±273.91 756.87±254.47 0.443
PM2.5 (μg/m3) 17.00±9.58 9.26±7.20 <0.001

Values are presented as a mean±standard deviation.

Table 3

Asthma Symptom Scores and Medication Scores with the Filter OFF or ON

ymj-61-310-i003
Variable Filter OFF Filter ON p value
Symptom score 14.03±0.28 13.97±0.35 0.428
Medication score 6.90±0.29 7.12±0.14 <0.001

Values are presented as a mean±standard deviation.

Table 4

PEFR and FeNO with the Filter OFF or ON

ymj-61-310-i004
Variable Filter OFF Filter ON p value
PEFR (L/min) 326.24±67.54 321.33±63.38 0.620
FeNO (ppb) 27.76±16.87 28.5±18.97 0.874

PEFR, peak expiratory flow rate; FeNO, fractional exhaled nitric oxide.

Values are presented as a mean±standard deviation.

Table 5

Concentration of Urine Phthalate with the Filter OFF or ON

ymj-61-310-i005
Variable Filter OFF Filter ON p value
MnBP (ng/mL) 58.2±44.9 46.4±26.9 0.221
MBzP (ng/mL) 7.4±7.0 10.9±24.5 0.450
MEHHP (ng/mL) 36.7±19.4 44.0±33.7 0.308
MEOHP (ng/mL) 55.1±13.0 27.9±21.2 0.303
MECCP (ng/mL) 55.1±25.9 61.1±34.8 0.446

MnBP, mono-n-butylphthalate; MBzP, mono-benzylphthalate; MEHHP, mono-(2-ethyl-5-hydroxyhexyl) phthalate; MEOHP, mono-(2-ethyl-5-oxohexyl) phthalate; MECCP, mono-(2-ethyl-5-carboxylpentyl) phthalate.

Values are presented as a mean±standard deviation.

TOOLS
Similar articles