

 PDF
PDF ePub
ePub Citation
 Print
Print


Abstract
Objective
To examine whether uric acid level or gout is causally associated with the risk of osteoarthritis.
Methods
We performed a two-sample Mendelian randomization (MR) analysis using inverse-variance weighted (IVW), MR-Egger regression, and weighted median methods. We used the publicly available summary statistics datasets of uric acid level or gout genomewide association studies (GWASs) as the exposure, and a GWAS in 3,498 patients with osteoarthritis in the arcOGEN study and 11,009 controls of European ancestry as the outcome.
Results
Six single nucleotide polymorphisms (SNPs) from the GWAS data on uric acid level and 12 SNPs from the GWAS data on gout were selected as instrumental variables (IVs). The IVW analysis did not support a causal association between uric acid level or gout and risk of osteoarthritis (beta=–0.026, standard error [SE]=0.096, p=0.789; beta=–0.018, SE=0.025, p=0.482). MR-Egger regression revealed no causal association between uric acid level or gout and risk of osteoarthritis (beta=0.028, SE=0.142, p=0.852; beta=–0.056, SE=0.090, p=0.548). Similarly, no evidence of a casual association was provided by the weighted median approach (beta=0.004, SE=0.064, p=0.946; beta=–0.005, SE=0.025, p=0.843).
Conclusion
The results of MR analysis demonstrates that uric acid level and gout may be not causally associated with the increased risk of osteoarthritis. Considering MR study is not susceptible to bias from unmeasured confounders or reverse causation, the epidemiological evidence for an association between uric acid level or gout and a higher risk of osteoarthritis may be due to residual confounding or reverse causation rather than direct causality.
Go to : 
REFERENCES
1. Dieppe PA, Lohmander LS. Pathogenesis and management of pain in osteoarthritis. Lancet. 2005; 365:965–73.

2. Litwic A, Edwards MH, Dennison EM, Cooper C. Epidemiology and burden of osteoarthritis. Br Med Bull. 2013; 105:185–99.
3. Wortmann RL. Gout and hyperuricemia. Curr Opin Rheumatol. 2002; 14:281–6.
4. Terkeltaub RA. Clinical practice. Gout. N Engl J Med. 2003; 349:1647–55.
5. Ding X, Zeng C, Wei J, Li H, Yang T, Zhang Y, et al. The associations of serum uric acid level and hyperuricemia with knee osteoarthritis. Rheumatol Int. 2016; 36:567–73.
6. Howard RG, Samuels J, Gyftopoulos S, Krasnokutsky S, Leung J, Swearingen CJ, et al. Presence of gout is associated with increased prevalence and severity of knee osteoarthritis among older men: results of a pilot study. J Clin Rheumatol. 2015; 21:63–71.
7. Dalbeth N, Aati O, Kalluru R, Gamble GD, Horne A, Doyle AJ, et al. Relationship between structural joint damage and urate deposition in gout: a plain radiography and dual-energy CT study. Ann Rheum Dis. 2015; 74:1030–6.
8. Yokose C, Chen M, Berhanu A, Pillinger MH, Krasnokutsky S. Gout and osteoarthritis: associations, pathophysiology, and therapeutic implications. Curr Rheumatol Rep. 2016; 18:65.
9. Burgess S, Daniel RM, Butterworth AS, Thompson SG. EPIC-InterAct Consortium. Network Mendelian randomization: using genetic variants as instrumental variables to investigate mediation in causal pathways. Int J Epidemiol. 2015; 44:484–95.
10. Kolz M, Johnson T, Sanna S, Teumer A, Vitart V, Perola M, et al. Meta-analysis of 28,141 individuals identifies common variants within five new loci that influence uric acid concentrations. PLoS Genet. 2009; 5:e1000504.
11. Sulem P, Gudbjartsson DF, Walters GB, Helgadottir HT, Helgason A, Gudjonsson SA, et al. Identification of low-frequency variants associated with gout and serum uric acid levels. Nat Genet. 2011; 43:1127–30.
12. Matsuo H, Yamamoto K, Nakaoka H, Nakayama A, Sakiyama M, Chiba T, et al. Genomewide association study of clinically defined gout identifies multiple risk loci and its association with clinical subtypes. Ann Rheum Dis. 2016; 75:652–9.
13. Nakayama A, Nakaoka H, Yamamoto K, Sakiyama M, Shaukat A, Toyoda Y, et al. GWAS of clinically defined gout and subtypes identifies multiple susceptibility loci that include urate transporter genes. Ann Rheum Dis. 2017; 76:869–77.
14. arcOGEN Consortium;arcOGEN Collaborators. Zeggini E, Panoutsopoulou K, Southam L, Rayner NW, Day-Williams AG, Lopes MC, et al. Identification of new susceptibility loci for osteoarthritis (arcOGEN): a genomewide association study. Lancet. 2012; 380:815–23.
15. Burgess S, Butterworth A, Thompson SG. Mendelian randomization analysis with multiple genetic variants using summarized data. Genet Epidemiol. 2013; 37:658–65.
16. Hartwig FP, Davies NM, Hemani G, Davey Smith G. Two-sample Mendelian randomization: avoiding the down-sides of a powerful, widely applicable but potentially fallible technique. Int J Epidemiol. 2016; 45:1717–26.
17. Pierce BL, Burgess S. Efficient design for Mendelian randomization studies: subsample and 2-sample instrumental variable estimators. Am J Epidemiol. 2013; 178:1177–84.
18. Bowden J, Davey Smith G, Burgess S. Mendelian randomization with invalid instruments: effect estimation and bias detection through Egger regression. Int J Epidemiol. 2015; 44:512–25.
19. Burgess S, Thompson SG. Interpreting findings from Mendelian randomization using the MR-Egger method. Eur J Epidemiol. 2017; 32:377–89.
20. Bowden J, Davey Smith G, Haycock PC, Burgess S. Consistent estimation in Mendelian randomization with some invalid instruments using a weighted median estimator. Genet Epidemiol. 2016; 40:304–14.
21. Hemani G, Zheng J, Wade KH, Laurin C, Elsworth B, Burgess S, et al. MR-Base: a platform for systematic causal inference across the phenome using billions of genetic associations. bioRxiv. 2016; 16:78972.
22. Egger M, Smith GD, Phillips AN. Meta-analysis: principles and procedures. BMJ. 1997; 315:1533–7.
23. Neogi T, Krasnokutsky S, Pillinger MH. Urate and osteoarthritis: Evidence for a reciprocal relationship. Joint Bone Spine. 2019; 86:576–82.
24. Hill HA, Kleinbaum DG. Bias in observational studies. Wiley StatsRef. 2000; DOI: DOI: 10.1002/9781118445112.stat05111.
25. Lee YH, Bae SC, Song GG. Hepatitis B virus (HBV) reactivation in rheumatic patients with hepatitis core antigen (HBV occult carriers) undergoing anti-tumor necrosis factor therapy. Clin Exp Rheumatol. 2013; 31:118–21.
26. Smith GD, Ebrahim S. Mendelian randomization: genetic variants as instruments for strengthening causal inference in observational studies. Weinstein M, Vaupel JW, Wachter KW, editors. Biosocial surveys. Washington D.C.: National Academies Press (US);2008.
27. VanderWeele TJ, Tchetgen Tchetgen EJ, Cornelis M, Kraft P. Methodological challenges in Mendelian randomization. Epidemiology. 2014; 25:427–35.
28. Thompson JR, Minelli C, Bowden J, Del Greco FM, Gill D, Jones EM, et al. Mendelian randomization incorporating uncertainty about pleiotropy. Stat Med. 2017; 36:4627–45.
29. Paaby AB, Rockman MV. The many faces of pleiotropy. Trends Genet. 2013; 29:66–73.
30. Smith GD, Ebrahim S. Mendelian randomization: prospects, potentials, and limitations. Int J Epidemiol. 2004; 33:30–42.
31. Swerdlow DI, Kuchenbaecker KB, Shah S, Sofat R, Holmes MV, White J, et al. Selecting instruments for Mendelian randomization in the wake of genomewide association studies. Int J Epidemiol. 2016; 45:1600–16.
32. Burgess S, Dudbridge F, Thompson SG. Combining information on multiple instrumental variables in Mendelian randomization: comparison of allele score and summarized data methods. Stat Med. 2016; 35:1880–906.
Go to :
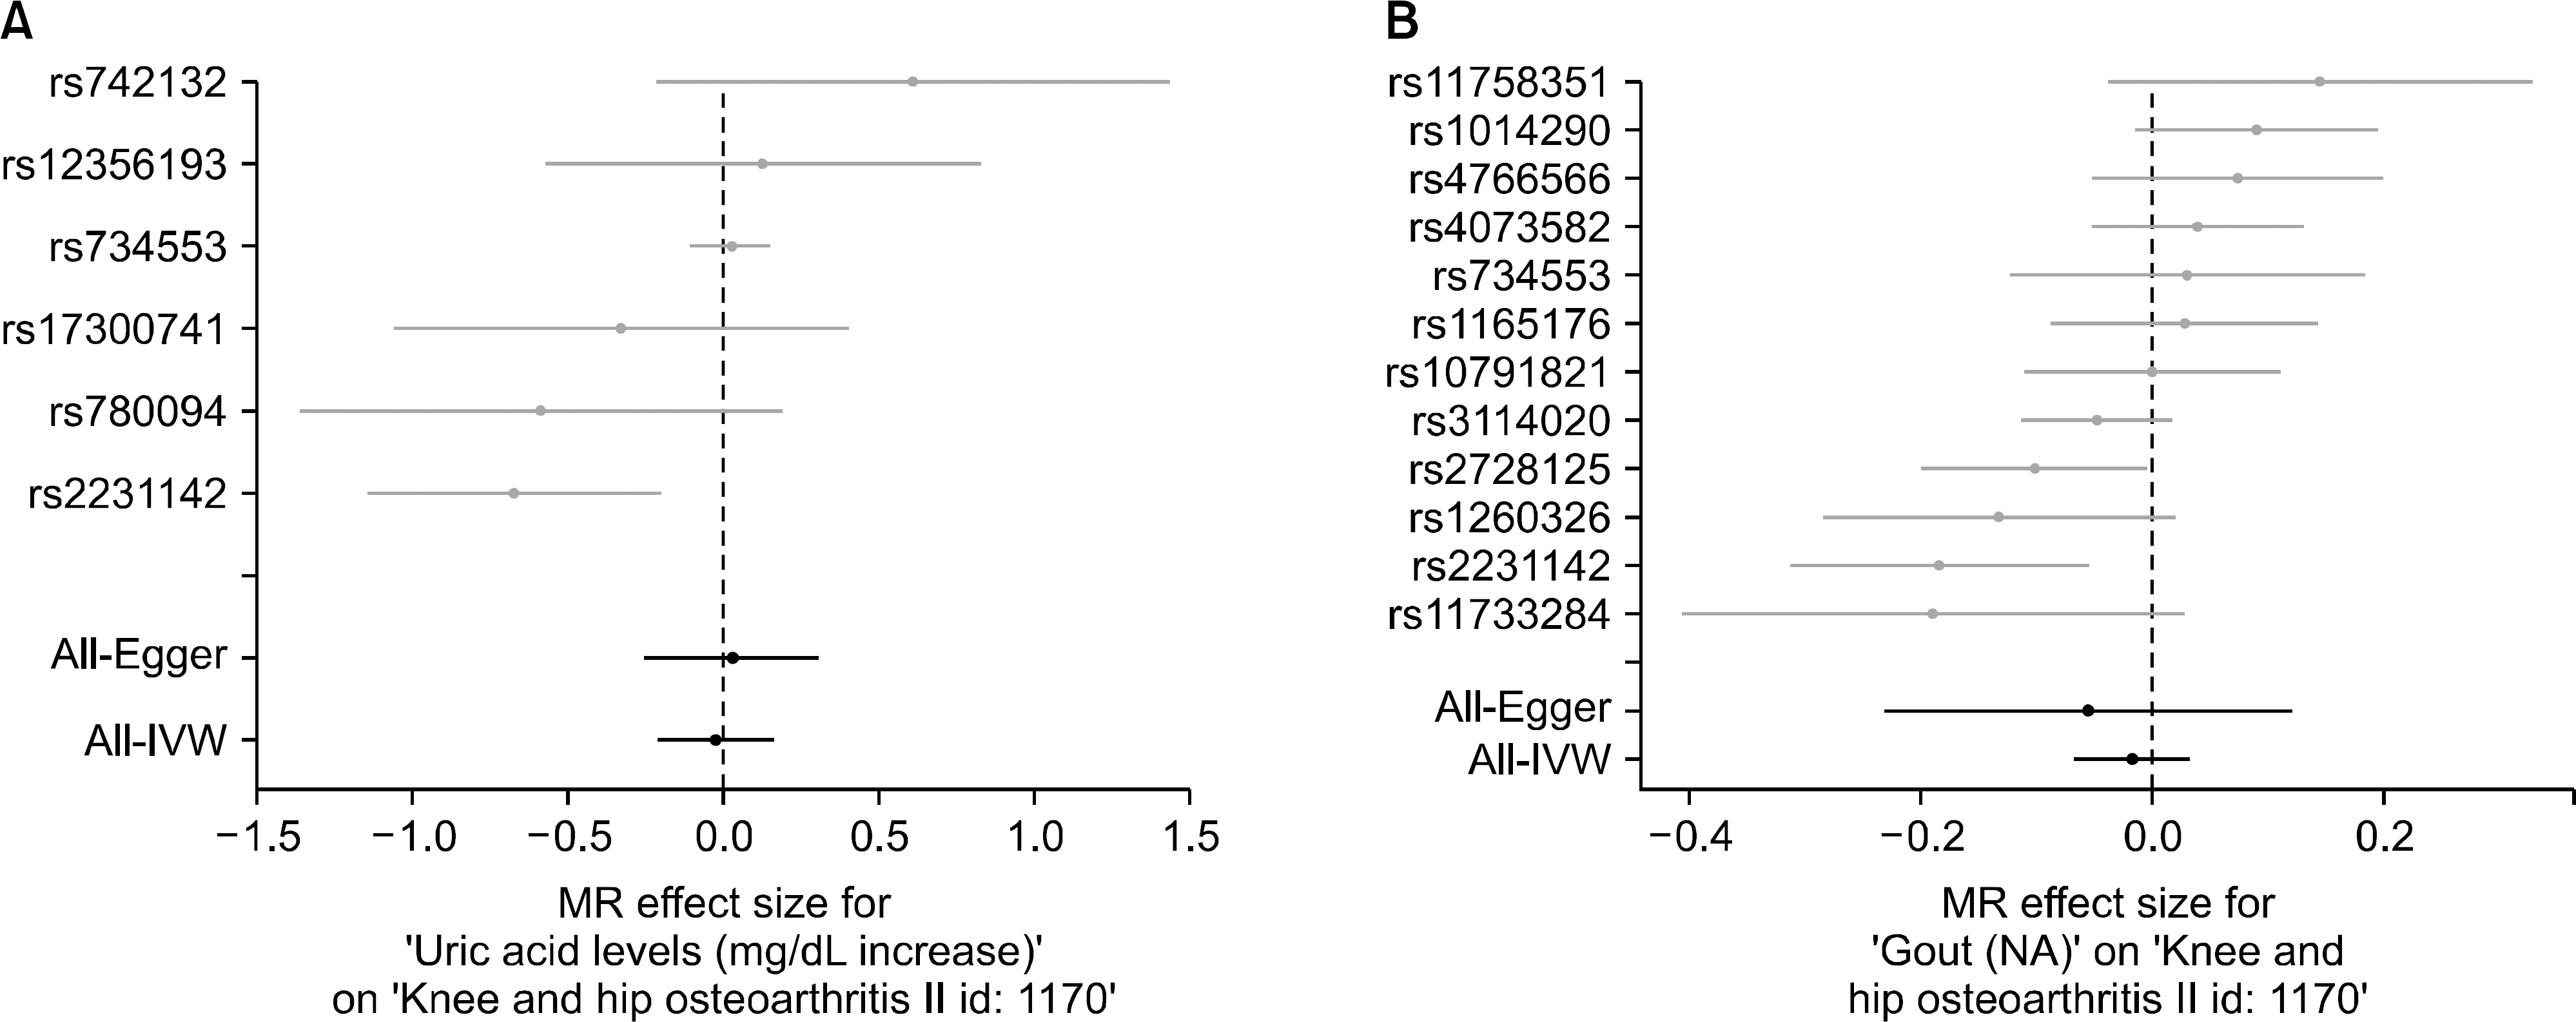 | Figure 1.Forrest plot of the causal effects of uric acid level (A) or gout (B)-associated SNPs on osteoarthritis. SNP: single nucleotide polymorphism, MR: Mendelian randomization, IVW: inverse-variance weighted, Na: not available. |
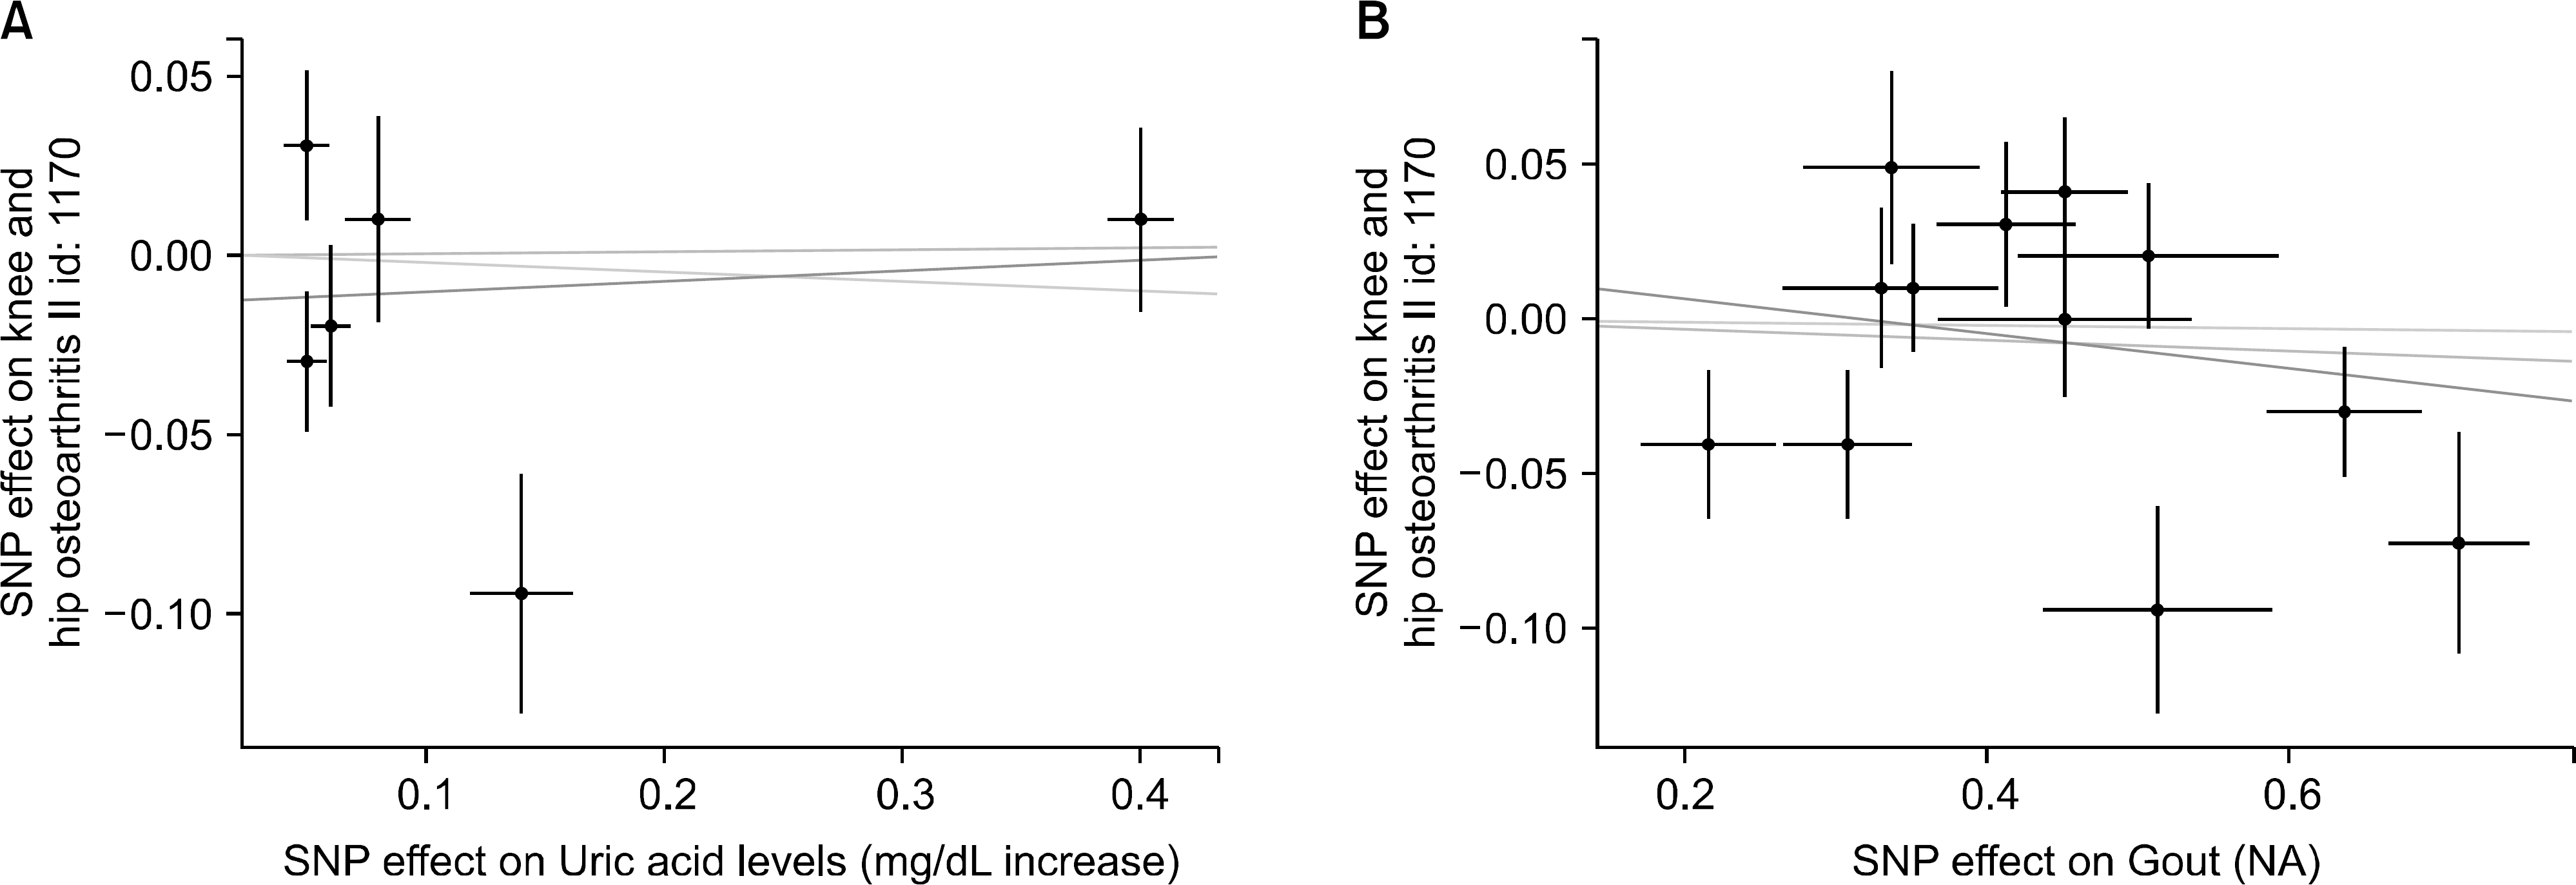 | Figure 2.Scatter plots of genetic associations of uric acid level (A) or gout (B) against the genetic associations of osteoarthritis. The slopes of each line represent the causal association for each method. Blue line represents the IVW estimate, green line represents the weighted median estimate, and dark blue line represents the MR-Egger estimate. IVW: inverse-variance weighted, SNP: single nucleotide polymorphism, MR: Mendelian randomization, Na: not available. |
 | Figure 3.Funnel plot to assess the heterogeneity of the causal effects of uric acid level (A) or gout (B)-associated SNPs on osteoarthritis. Blue line represents the IVW estimate, and dark blue line represents the MR-Egger estimate. SNP: single nucleotide polymorphism, IVW: inverse-variance weighted, MR: Mendelian randomization, SE: standard error, β: beta coefficient. |
Table 1.
Instrumental SNPs from uric acid level (A) or gout (B) and osteoarthritis GWASs
SNP: single nucleotide polymorphism, GWAS: genomewide association study, Beta: beta coefficient, SE: standard error, SLC16A9: Solute Carrier Family 16 Member 9, SLC22A11: Solute Carrier Family 22 Member 11, ABCG2: ATP Binding Cassette Subfamily G Member 2 (Junior Blood Group), SLC2A9: Solute Carrier Family 2 Member 9, SCGN: Secretagogin, EF-Hand Calcium Binding Protein, GCKR: Glucokinase Regulator, MAP3K11: Mitogen-Activated Protein Kinase Kinase Kinase 11, SLC17A1: Solute Carrier Family 17 Member 1, NIPAL1: NIPA-Like Domain Containing 1, HIST1H2BF: Histone Cluster 1 H2B Family Member F, CNIH-2: Cornichon Family AMPA Receptor Auxiliary Protein 2, CUX2: Cut-Like Homeobox 2.
Table 2.
The MR estimates of the causal effect of uric acid level (A) and gout (B) on osteoarthritis risk, derived using different methods
 XML Download