

 PDF
PDF ePub
ePub Citation
 Print
Print


INTRODUCTION
Alzheimer's disease (AD) is a form of dementia pathologically characterized by the presymptomatic accumulation of extracellular amyloid-β (Aβ) deposits and intracellular neurofibrillary tangles, subsequently leading to brain atrophy and cognitive impairment from neuronal death.1 The clinical criteria specified in a 1984 report by the National Institute of Neurological and Communicative Disorders and Stroke of the United States and the Alzheimer's Disease and Related Disorders Association (NINCDS-ADRDA) had provided a diagnosis for “probable”, “possible”, or “definite” AD.2 The NINCDS-ADRDA criteria was further updated in 2011 by a working group of the National Institute on Aging and the Alzheimer's Association (NIA-AA), with integration of biomarker evidence to AD diagnostics.3 Also, significant advancements in the biological understanding of AD has supported the development of diagnostic tools for the disease. Diagnostic methods currently in clinical use can be largely classified into three categories: neuropsychological tests, neuroimaging biomarkers, and measurement of fluid biomarkers in the cerebrospinal fluid (CSF).4
Neuropsychological tests are specifically designed tasks used to assess the functioning of memory and other cognitive domains.5 Abnormal performance is identified through normative comparison with a reference group matched for age, sex, and education, while progressive cognitive decline can be determined by comparison with the individual’s previous test records.2 The global Clinical Dementia Rating (CDR) is a 5-point scale used to assess the severity of dementia through structured interviews evaluating cognitive and functional performance in six domains: memory, orientation, judgment and problem solving, community affairs, home and hobbies, and personal care.6 Standardized for use in the formal staging of dementia, the global CDR score is derived by an algorithm integrating the six domain scores, in which ‘0’ indicates no dementia, and ‘0.5’ is questionable, ‘1’ is mild, ‘2’ is moderate, and ‘3’ is severe dementia. Alternatively, the sum of boxes (CDR-SOB) score can be obtained through the summation of the six domain scores, yielding a score from 0–18.7 CDR-SOB provides additional information for global CDR scores when distinguishing those with mild cognitive impairment (MCI) and clinical dementia.8 The Mini-Mental State Examination (MMSE), a brief neuropsychological test comprising a total of 30 questions, is the most widely used screening tool for quick measurements of cognitive function.9 However, the MMSE is exceptional in its brevity as most neuropsychological assessments used in clinical settings comprise multiple tests in the form of a comprehensive multifaceted battery.10 As the only diagnostic method that provides information of the cognitive and functional state of an individual,11 neuropsychological tests are essential in the overall diagnostic process of AD.
Imaging biomarkers are mainly measured by structural magnetic resonance imaging (MRI) and molecular neuroimaging of positron emission tomography (PET).12 The pathological pathway of AD involves early changes in medial temporal structures such as the hippocampus and entorhinal cortex, areas associated with episodic memory.1213 Atrophy in the medial temporal lobe measured by MRI differentiates AD patients from the normal age-matched control group with a sensitivity and specificity higher than 85%.14 PET scans with fluorodeoxyglucose indicate distinctive spatial patterns of hypometabolism in temporoparietal regions in the AD brain,15 with a high diagnostic accuracy of 94% sensitivity and 73% specificity.16 While brain imaging of Aβ aggregates through PET tracers have been approved for clinical use, tau-PET tracers are currently under assessment.1718
Another clinical method for the diagnosis of AD is the measurement of pathophysiological biomarkers within the CSF. As CSF circulates within the cavities of the central nervous system, CSF biomarker analysis is the most direct way to study biochemical changes within the brain, highly sensitive and specific in the identification of AD.1920 Research on the biomarkers of AD has led to a descriptive classification system, grouping into those of Aβ deposition, pathologic tau, and neurodegeneration (ATN).2122 CSF biomarkers of the ATN system include the reduction of Aβ for biomarkers of amyloid deposition, elevated phosphorylated tau (p-tau) for biomarkers of tau pathology, and increase of total tau (t-tau) as biomarkers of neurodegeneration.192022
The current diagnostic tools for AD are well characterized in their ability to accurately identify patients, but the overall process of diagnosis could be advanced if there was a practical method available at a screening level for preventative purposes. An emerging diagnostic method is to differentiate AD patients through the assessment of blood-based biomarkers. As vascular transport across the blood brain barrier is the main pathway for rapid elimination of Aβ in the brain, ATN biomarkers found in the CSF also have potential as plasma biomarkers.23 Also, patients with early AD were found to have leakage in the blood brain barrier, increasing the permeability of exchange of ATN proteins between the CSF and blood.24 Blood collection is a relatively non-invasive process and samples can be easily acquired through venipuncture in the presence of an anticoagulant.25 Blood-based biomarkers are implemented in frontline screening tests for cardiovascular disease and cancer.26 This application of AD blood tests in the diagnosis scheme is promising as an accessible method for frontline screening and also for continuously monitoring the pathophysiological progression of the disease.
However, several complications pose difficulties in the development of AD blood tests. The low concentration of ATN biomarkers in the plasma poses a challenge for accurate detection and quantification. Aβ,2728 p-tau,29 and t-tau30 exist in the blood at concentrations of pg/mL and, as such, detection would require excellent sensitivity and specificity. Previous inconsistencies found in studies measuring plasma ATN biomarkers31 may be amended with refined detection technology. The complex nature of blood adds difficulty regarding accurate biomarker detection, as the blood comprises an innumerable amount of proteins, lipids, and other metabolic products.32 The abundant constituents of blood may interfere with the detection of ATN biomarkers through epitope masking or sequestering. In the case of Aβ, the amphoteric and amphipathic properties of the peptide enable interaction with multiple plasma proteins and erythrocytes.33
Recently, AD blood test technologies in South Korea approach these problems directly with distinctive methods of heightening detection sensitivity of specific plasma ATN biomarkers. In this review paper, we discuss the advances in the development of blood-based biomarkers as potential diagnostic measures for AD, with focus on three different clinical studies occurring in South Korea. Also, we examined the methodology of the overall technologies as well as the accuracy of the distinguished biomarkers as diagnostic measures through the outcomes of clinical trials obtained in each study, with the potential impact of integrating AD blood tests in clinical and research settings.
Go to : 
CRITERIA FOR NEW DIAGNOSIS TOOLS
When discerning the adequacy of a new diagnostic test, an objective measure for qualitative assessment is needed. In this case, the area under the receiver operating characteristic (ROC) curve (AUC) is the most widely used metric to assess the discriminatory ability of a novel diagnostic model.34 The sensitivity of a diagnostic test refers to the ability of the test to correctly identify true positive instances, i.e., positive results for patients with the disease, while the specificity refers to the ability of the test to correctly identify true negative instances, i.e., negative results for patients without the disease.35 The ROC curve is a plot of (1 – specificity) of the test on the x-axis against the sensitivity of the test on the y-axis, and the AUC describes the overall accuracy of a test, with a maximum value of 1.0.35
As stated in the Consensus Report of the Working on Molecular and Biochemical Markers of Alzheimer's Disease,36 the ideal diagnostic biomarker for AD should detect a fundamental feature of neuropathology with sensitivity and specificity for AD both higher than 80%. Using these standards, the sufficiency of a new diagnostic measure for AD can be assessed through clinical examination. As such, the sensitivity and specificity of AD blood tests from clinical trials referenced in this review were addressed.
Go to :
PRECEDING INTERNATIONAL APPROACHES FOR AD BLOOD TESTS TECHNOLOGY
Multiple international companies have strived to develop diagnostic blood tests for AD. In this section, we briefly introduce four preceding diagnostic technologies using blood-based AD biomarkers, with approaches made in areas of Aβ, tau, and proteomics.
Araclon Biotech (Zaragoza, Spain) developed a colorimetric sandwich enzyme-linked immunosorbent assay (ELISA) test to quantify levels of Aβ40 and Aβ42 in three different conditions of blood samples.37 After centrifugation of the blood samples, the Spanish researchers assessed the Aβ levels in two plasma aliquots, one diluted in a formulated sample buffer and one undiluted, and also in the erythrocyte pellets, to assess cell bound Aβ fractions. In a clinical evaluation involving healthy controls (n=19) and individuals with MCI (n=27),38 the proprietary ELISA sandwich detected four single or combinatory composite biomarkers with significant odd ratios (95% confidence interval [CI]) differing the two groups. However, the diagnostic results were moderate, as the AUC did not exceed 0.80 for any of the Aβ biomarkers.
In another study assessing the plasma Aβ biomarker, researchers from Washington University (St. Louis, MI, USA) applied the stable isotope labeling kinetics quantification method, originally devised to determine the turnover rate of Aβ proteins in the CSF,39 to investigate the differences of Aβ isotope dynamics in the blood of amyloid positive and amyloid negative individuals.40 Blood was collected hourly through an intravenous line and 13C6-leucine, a stable isotope-labeled amino acid, was administered after the hour zero blood draw. Subsequently, plasma Aβ isoforms were purified through simultaneous immunoprecipitation via the monoclonal mid-domain HJ5.1 antibody and subjected to liquid chromatography-mass spectrometry analysis. As a result, the average plasma Aβ42/Aβ40 ratio of the amyloid positive group noticeably decreased at the 12-hour mark, whereas the Aβ42/Aβ40 ratio of amyloid negative individuals stayed consistent. The ROC analysis of absolute plasma Aβ42/Aβ40 concentrations demonstrated an AUC of 0.8865.
The immunomagnetic reduction (IMR) technology by MagQu Company (New Taipei City, Taiwan) is a highly sensitive assay involving magnetic nanoparticles bio-functionalized by antibodies against Aβ40 and Aβ42.4142 IMR technology measures alternating-current magnetic susceptibility caused by the association of antigen with bio-functionalized magnetic nanoparticles via a superconducting quantum interference device. The magnitude of reduction in the oscillation speed of the magnetic nanoparticles corresponds to the amount of antigen-antibody interaction.43 Plasma biomarkers, such as Aβ40, Aβ42, and tau proteins, were measured by the IMR assay in a clinical evaluation composed of individuals with healthy cognition, MCI, very mild dementia (CDR: 0.5), and mild-to-severe dementia (CDR: 1–3).44 IMR results revealed elevated levels of Aβ42 and tau proteins in AD patients, and healthy individuals were differentiated from the other groups with a 96% sensitivity and 97% specificity. However, the discrimination of AD patients from those with MCI by IMR had a lower sensitivity and specificity of 80% and 82%, respectively.
A different approach in the search of blood-based AD biomarkers is through the examination of plasma proteome biomarkers. Hye and colleges45 conducted two-dimensional gel electrophoresis and coupled mass spectrometry to find plasma protein biomarkers that differ in the blood of individuals with AD and normal cognition. Mass spectrometric analysis of plasma proteomics identified multiple biomarkers of related to AD pathology, including complement factor H precursor and a-2-macroglobulin, which yielded 62% sensitivity and 60% specificity when used in a combined analysis. Although this study was unable to yield sufficient results, further research using this proteome-based method revealed an association between proteomic-based AD biomarkers and plasma apolipoprotein-E concentration,46 brain atrophy, disease severity, and rate of clinical progression in AD.47
Go to :
OAβ TEST VIA THE MULTIMER DETECTION SYSTEM
A potential AD blood test in which plasma Aβ oligomers are selectively detected by a multimer detection system (MDS) has been developed in collaboration among PeopleBio Inc (Seoul, Korea), Gachon University (Seongnam, Korea), and Seoul National University Bundang Hospital (Seongnam, Korea).48 Originally designed to detect misfolded prions in the blood, MDS is a modified sandwich ELISA, distinguished in that the capture and detection antibodies are specific to a unique overlapping epitope.49 When repurposed for the oligomeric Aβ (OAβ) test, competition between two different antibodies for the same region at the N terminus of Aβ enables MDS to selectively measure the oligomeric form of Aβ.4850 Whereas monomeric Aβ only has one epitope available, the aggregation of multiple monomers into OAβ create multiple binding areas for the competing antibodies. The ability to identify AD patients through the OAβ test is further enhanced by incubating plasma samples with synthesized Aβ42 prior to the assay.48
The overall procedure of the OAβ Test is characterized by the incubation phase and MDS technology (Fig. 1).4850 Plasma samples are incubated with synthetic Aβ42 (10 ng/mL) at 37°C for 144 hours. Then the samples are added to wells that have been precoated by mouse monoclonal antibody 6E10, capturing Aβ at residues 3–8. FF51-horseradish peroxidase antibody, binding to Aβ residues 1–4, was used as the detection antibody, before the addition of a chemiluminescent substrate solution. Subsequently, the level of Aβ oligomers was quantified using a spectrophotometer.
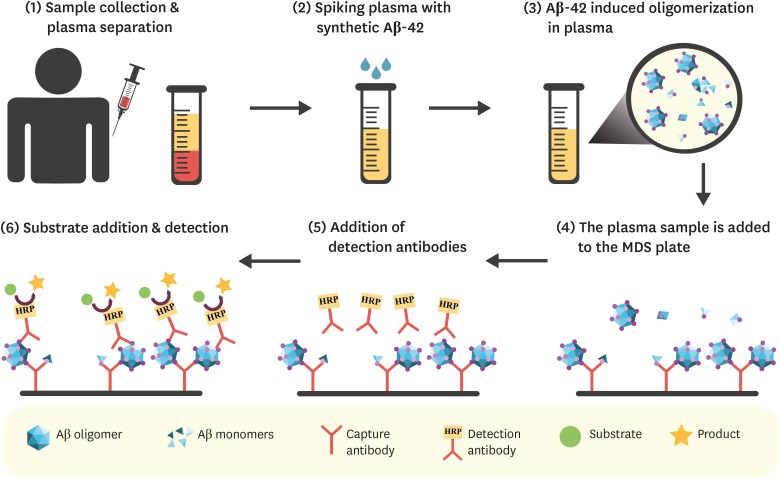 | Fig. 1OAβ Test via Multimer Detection System. (1) Blood sample is collected and centrifuged. (2) Isolated plasma is spiked with synthetic Aβ42 (10 ng/mL) and incubated at 37°C for 144 hours. (3) Spiked Aβ42 induces Aβ oligomerization, thereby changing the levels of plasma Aβ oligomers. (4) The sample is added to wells that have been precoated by mouse monoclonal antibody 6E10 (capture antibody), which captures Aβ at residues 3-8. (5) FF51-horseradish peroxidase antibody (detection antibody) binds to Aβ residues 1–4. (6) Addition of a chemiluminescent substrate solution results in the formation of a colored product, which can be detected and quantified using a spectrophotometer.Aβ: amyloid-β, MDS: multimer detection system.
|
In a proof of concept trial for the OAβ test, the MDS was used to delineate the changing patterns of Aβ oligomer levels in the blood samples of AD patients and age-matched healthy controls upon incubation with the synthesized Aβ42.48 The course of change was assessed in pooled plasma samples from 11 AD patients and nine healthy normal controls, as well as in individual plasma samples of 24 AD patients and 80 normal controls. The AD patients were well-diagnosed with probable AD according to the criteria of the NIA-AA and had an average CDR-SOB score of 6.35, while normal controls scored an average of 0.03. Ensuing initial exposure to synthetic Aβ42 (10 ng/mL), the pattern of change in the OAβ levels differed in the plasma of AD patients and of the age-matched healthy controls during different lengths of incubation. The largest difference was observed at 144 hours of incubation, as samples from AD patients had significantly higher levels of oligomers than of the control group when measured by MDS (p<0.0001). This study by An et al.48 established the apt duration of sample incubation for Aβ oligomerization.
The diagnostic ability of the OAβ test shows promising potential, as AD patients (n=24) were differentiated from age-matched normal control individuals (n=37) with a sensitivity of 78.3% and a specificity of 86.5% in a study by Wang and colleagues.50 The AD patients were diagnosed with probable AD by the NIA-AA criteria, with CDR scores of 0.5–2 and CDR-SOB scores exceeding 2.5. All participants underwent extensive clinical evaluations, such as brain MRI, CSF measurement of Aβ42 and tau biomarkers, amyloid-PET, and neuropsychological assessment. The levels of plasma OAβ by MDS had moderately high correlation with other conventional biomarkers, such as CSF Aβ42 (r=−0.443), CSF p-tau (r=0.530), CSF t-tau (r=0.604), and standardized uptake value in PET (r=0.430). Also, plasma Aβ oligomer biomarkers by MDS had an AUC of 0.844, not significantly different from the AUC of the clinically used AD biomarkers (p=0.250).
The competency of the OAβ test was further validated in a recent study by assessing the association of plasma OAβ levels with AD brain neurodegeneration.51 A total of 162 participants were composed by 92 healthy normal controls, 38 AD patients meeting the NINCDS-ADRDA criteria for probable AD, 15 individuals with MCI due to AD (CDR=0.5), and 17 individuals with subjective cognitive decline. Healthy normal controls and individuals with subjective cognitive decline both had normal general cognition with Korean MMSE scores higher than 26, but only those with subjective cognitive decline had memory complaints. Plasma Aβ oligomerization by MDS negatively correlated with the MRI results showing brain volume reduction in areas affected by AD pathology (p<0.05), being the first study to imply a correlation between oligomerization tendencies in the blood and neurodegenerative brain volume reduction.
OAβ is the most toxic form of Aβ, as it induces abnormal phosphorylation of tau in AD pathology.5253 The manipulation of overlapping antibodies characteristic of MDS enables specific application to such protein structures. This detection technology has great flexibility because of its ability to use various antibodies. However, the range of detection by MDS technology is limited to proteins with multiple epitopes available for binding on the surface, making detection difficult if the binding site is buried within the antigen or masked by another protein. Although the incubation of samples with synthesized Aβ42 allows sensitive detection of OAβ, this process requires at least six days and clinical settings will readily need synthetic Aβ42 to perform the MDS assay. The application of MDS to detect OAβ has been approved by the Korean FDA (registration number: TRKO201900002724) and is patented by PeopleBio Inc.54
Go to :
COMPARING LEVELS OF Aβ BY SELF-STANDARD ANALYSIS VIA INTERDIGITATED MICROELECTRODE SENSORS
Collaborative research between Yonsei University (Seoul, Korea) and Kyung Hee University (Seoul, Korea) has devised a novel biosensor system that identifies AD patients through comparative analyses of plasma Aβ in heterogeneous and monomerized states.55 The Korean researchers aliquoted human blood samples into two samples, and treated only one with 4-(2-hydroxyethyl)-1-piperazinepropanesulphonic acid (EPPS), a small molecule that disaggregates Aβ oligomers and fibrils,56 to homogenize the plasma biomarkers into a monomeric state. Subsequently, an interdigitated microelectrode (IME) sensor system was used to quantify Aβ levels in the monomerized sample and untreated heterogeneous sample on a scale of 0.1 pg/mL.5758 When comparing the measurements of plasma Aβ monomers before and after treatment with EPPS, AD patients showed elevated levels of Aβ, whereas normal controls did not exhibit a change in patterns.55 This difference makes it possible to differentiate AD patients from normal controls through application of a calculated self-standard ratio, in which the concentration of homogenized Aβ monomers in the EPPS-treated sample is divided by the concentration of Aβ monomers in the untreated heterogeneous sample.
Concentrations of plasma Aβ fluctuate on a monthly and even hourly basis,5960 underscoring the need to normalize these variations before evaluation of the biomarker. The method of comparing levels of Aβ by self-standard analysis (CLASS) attains this requirement,55 thus enabling intra- and interindividual comparison. The overall process of the CLASS method is described in Fig. 2. Collected plasma samples are aliquoted into two and incubated separately at room temperature at 30 minutes, one standard sample with no additional chemicals added and one treated with 100 mM EPPS to monomerize the Aβ content. After incubation, both samples are applied to an IME sensor chip, comprising two microchannels for simultaneous loading and four IME sensors with a sensing zone fabricated with immobilized 6E10 antibodies between each pair of electrodes. The Aβ monomer concentration of each sample is then determined through detection by an impedance measurement system, a procedure that can be accomplished in approximately 30 minutes.5758 The self-standard ratio is then calculated and used to distinguish AD patients from unaffected individuals.
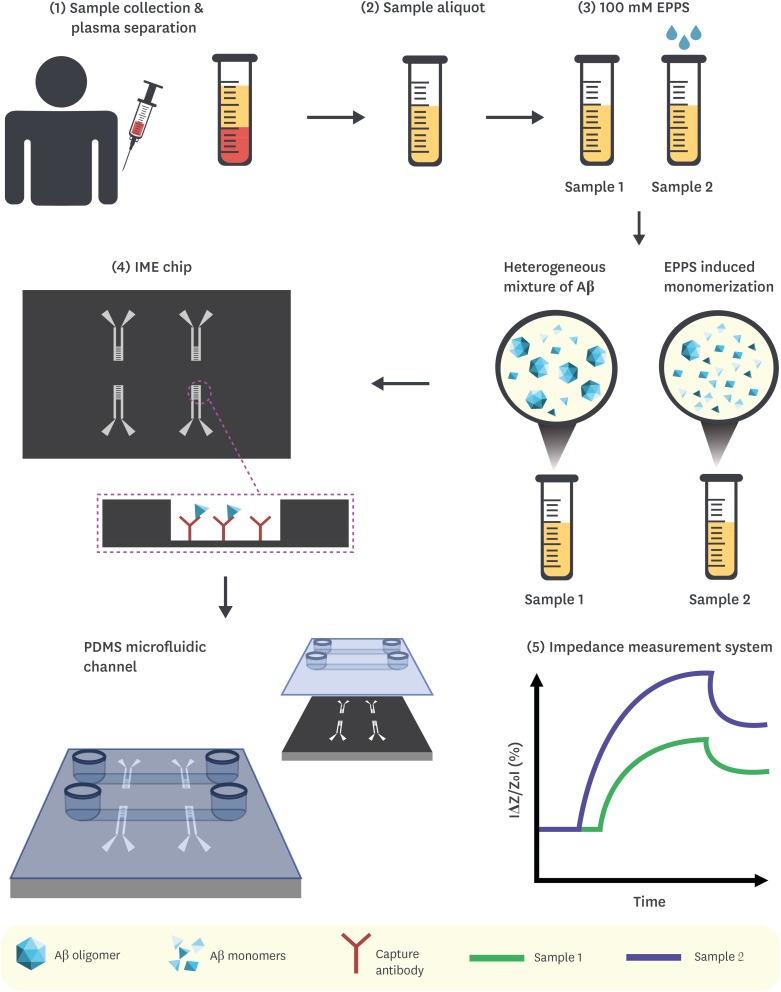 | Fig. 2Comparing levels of Aβ by self-standard analysis via IME sensors. (1) Blood sample is collected and centrifuged. (2) Isolated plasma is divided into 2 aliquots. (3) Sample 1 is a control (no additional reagent), and Sample 2 is treated with 100 mM EPPS and incubated at room temperature for 30 minutes, which results in monomerization of plasma Aβ oligomers. (4) Both samples are applied to an IME sensor chip, which is composed of 2 PDMS microfluidic channels for simultaneous loading and 4 sensors with a sensing zone fabricated with immobilized 6E10 antibodies between each pair of electrodes. (5) The interaction between Aβ monomers and detection antibodies results in the impedance change, thus, allowing to determine the concentration of Aβ monomers in each sample. The self-standard ratio is calculated by dividing the concentration of homogenized Aβ monomers by the concentration of heterogeneous Aβ monomers in the untreated sample.Aβ: amyloid-β, IME: interdigitated microelectrode, EPPS: 4-(2-hydroxyethyl)-1-piperazinepropanesulphonic acid, PDMS: polydimethylsiloxane.
|
When subject to clinical research, the CLASS method was able to differentiate AD patients (n=61) from normal controls (n=45) (p<0.0001) when implemented on blood samples donated by the Korea Institute of Radiological & Medical Sciences (KIRAM) (Seoul, Korea) and the Asan Medical Center (AMC) (Seoul, Korea).55 From the AMC, the patients in the AD group (n=32) fulfilled the NINCDS-ADRDA criteria for probable AD, and also had significantly higher CDR scores (1.5, n=9; ≥1, n=23) and significantly lower Korean MMSE scores (mean±standard deviation [SD], 19.7±4.5) in comparison to the normal controls (n=21), who had lower CDR scores (0, n=12; 1.5, n=9) (p<0.0001) and higher scores on the MMSE (27.5±2.0) (p<0.0001). From the KIRAM, the AD patients (n=29) had significantly higher CDR scores (0.5, n=5; ≥1, n=24) and significantly lower MMSE scores (13.0±29.4) compared the normal control participants (CDR 0, n=24, p<0.0001; MMSE, 29.4±1.0, p<0.0001). The diagnostic ability of CLASS had the sensitivity and specificity of 93% and 97%, respectively, a statistic that exceeds the idealistic standard of AD biomarkers.36 Also, the clinical implication of CLASS method was emphasized as the self-standard ratio of plasma Aβ had strong correlations with current diagnosis methods of AD, such as amyloid-PET and the Korean version of the MMSE.55 The correlation coefficient of CLASS with the amyloid-PET scans was calculated separately for the patients from AMC (r=0.5511, p<0.0001) and KIRAM (r=0.4141, p<0.0021), as the AMC used the [18F]-florbetaben tracer61 and KIRAM used the [18F]-FC119S tracer.62 CLASS results also strongly correlated with the Korean MMSE scores of AMC patients (r=−0.5456, p<0.0001) and KIRAM patients (r=−0.6011, p<0.0001). Despite positive correlations between amyloid-PET results and CLASS analyses in the assessment of total participants, an inverse correlation was observed for the AD subgroup from the KIRAM dataset, speculated to be from the use of different amyloid-PET tracers.
A notable feature of the CLASS method is the attainment of a sensor system sensitive enough to detect minuscule changes in the levels of plasma Aβ, overcoming a major obstacle in the development of AD plasma biomarkers. Also, the process of homogenization by EPPS and the application of a self-standard analysis normalizes fluctuations of plasma protein levels, enabling comparative analyses of intra- and inter-individual variations. Consequently, the CLASS method has optimized ability as an AD blood test, capable of differentiating AD patients with excellent sensitivity (93%) and specificity (97%). Another advantage of the CLASS method is that the whole procedure can be executed within a day, as the process of incubation and detection both take approximately 30 minutes.
Despite the many advantages of the CLASS method, there exist areas for further enhancement. One possible aspect is the application of different antibodies, as the 6E10 antibody used in this study was unable to distinguish between Aβ40 and Aβ42 because of its interaction at the N terminus. The differentiation of the amyloid isoforms would enhance the specificity of AD diagnosis, as the distinguished patterns of aggregation may aid in the delineation of the pathophysiological progression.
Go to :
RATIO OF TOTAL TAU AND ABETA42 BY SIMOA HD AND XMAP
In a study conducted at Seoul National University (Seoul, Korea), the researchers adopted a different approach by using existing technologies to test four tau-related plasma biomarkers, such as p-tau proteins at Thr181 (p-tau181), t-tau, p-tau181/Aβ42, and t-tau/Aβ42.63 Among these four biomarkers, the composite biomarker of t-tau/Aβ42 showed the highest correlation with pathological tau accumulation in the brain. The amount of tau in plasma was quantified using Simoa human tau immunoassay on Simoa HD-I analyzer developed by Quanterix Corporation. Simoa HD-I Analyzer, also known as Single Molecule Array, is a fully automated ELISA instrument capable of single-molecule and multiplex analysis.64 The platform is used in conjunction with Simoa assays which include standard ELISA reagents and a combination of monoclonal antibodies for a target protein coupled to microscopic beads.65 The microbead-based instrumentation and miniaturized ELISA plate, comprising more than 200,000 wells, improve sensitivity to fg/mL and allow to perform a high throughput analysis, as depicted in Fig. 3.66
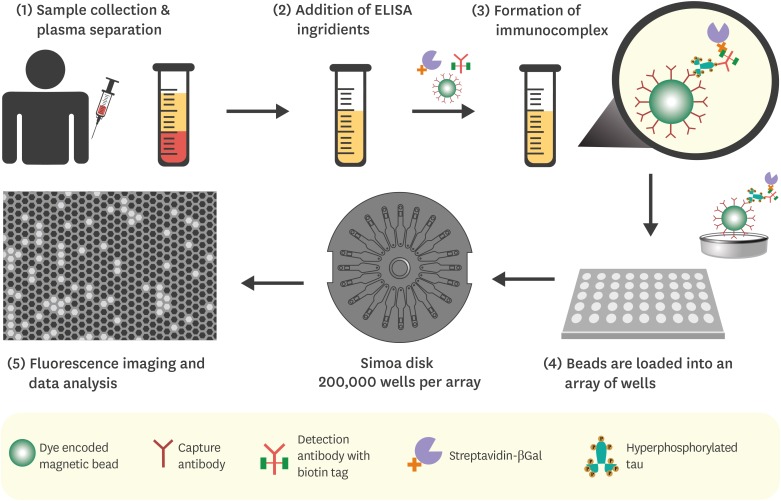 | Fig. 3Quantification of plasma tau using Simoa HD-I analyzer. (1) Blood sample is collected and centrifuged. (2) Paramagnetic microbeads coupled to detection antibodies (supplied along with Simoa Human tau immunoassay kit) are added to the plasma sample, preceding the addition of standard ELISA reagents. (3) If hyperphosphorylated tau protein is present (the target of the immunoassay) in the plasma sample, the formation sandwich immunocomplex will occur. (4) The microbeads are then concentrated by magnetic separation and loaded onto the arrays of femtomolar-wells, each capable of fitting a single immunocomplex. The arrays are located on the Simoa disk composed of 24 arrays. (5) After adding a fluorogenic substrate and sealing the wells using an oil solution, a single-binding event is detected and quantified by the instrument.ELISA: enzyme-linked immunosorbent assay.
|
In the same study, Park and colleagues63 measured the concentration of Aβ42 in plasma using xMAP technology by Luminex Corporation (Austin, TX, USA). xMAP technology, originally named FlowMetrix™ System, is based on the concept of a liquid array that uses proprietary microsphere-based assays to perform real-time multiplex analysis.67 Reactions are conducted on the surface of dye-encoded microspheres, and the signals are detected by multiple lasers or LEDs.68 To increase the stability of Aβ oligomers in the plasma and improve quantification, plasma samples were incubated with a mixture of protease and phosphatase inhibitors, as reported previously.69
To evaluate the diagnostic capabilities of the biomarkers, the study recruited 76 subjects of which 52 were cognitively normal (CDR=0), nine had MCI (CDR=0.5), and 15 were diagnosed with AD (CDR≥0.5). The subjects were assessed as specified by the NIA-AA criteria and Diagnostic and Statistical Manual of Mental Disorders 4th edition released by the American Psychiatric Association. To investigate tau deposition in the brain, tau-PET imaging was performed using 18F-AV-1451 tracer, and the distribution of tracer uptake in the brain was categorized and evaluated according to the Braak stages.7071
By comparing the performance of the four tau-related biomarkers and pathological tau accumulation in AD-associated brain regions assessed via tau-PET imaging, it was demonstrated that the ratio of t-tau/Aβ42 exhibited a stronger correlation with the Braak staging. Also, the ROC analysis revealed that t-tau/Aβ42 also had the highest performance in distinguishing tau-PET-positive and tau-PET-negative subjects with the specificity of 91.4% and sensitivity of 80.0% (p<0.0001). In accordance with the ROC results, relative risk analysis showed that the subjects with increased amount of plasma t-tau/Aβ42 had higher risk of developing tau-PET positive status. In the two-year longitudinal study, the changes in the amount of plasma t-tau/Aβ42 predicted two-year neuropathological changes and tau deposition in the brain.
The major advantage of the study by Park and his colleagues is a multiple-biomarker approach in predicting AD-associated neuropathology. Earlier studies have focused solely on the concentration of plasma t-tau and concluded that t-tau only is insufficient in reflecting Alzheimer's neuropathology.7273 On the contrary, the ratio of tau/Aβ42 was strongly tethered to AD-associated cognitive deficits.747576 As a result, Park and colleagues63 have further confirmed that the composite biomarkers of tau and Aβ42 are effective and applicable for blood-based diagnosis of AD. Another advantage of the Park et al.63 study is the accessibility and availability of Simoa and xMAP technology, which can be customized for a particular research purpose, providing additional flexibility. Multiplexing capability and automated instrumentation significantly reduce the sample size, yield rapid data acquisition, and allow to perform a high-throughput examination and overcome unexpected artifacts, which commonly occur in conventional biochemical assays.6667 Also, previous studies have proven that Simoa and xMAP are efficient and reliable analytical tools in the investigation of potential AD-related biomarkers.296477 These characteristics make Simoa and xMAP relevant to clinical applications.
Despite a number of advantages, there are certain limitations to this approach. Since Simoa is an immunoassay-based technology, it is confined by the number of available capture antibodies against the target protein. This aspect limits the quantification process to only p-tau181 and t-tau isoforms during the application of Simoa kits and the corresponding analyzer. Additionally, this study has not measured tau-related biomarkers in CSF, thus, the direct link between CSF and plasma tau biomarkers has not been established. It is noteworthy to mention that there were p-tau181 outliers that fell below the detection limit in this study, which has led to the different number of samples for p-tau181 and t-tau tests.
Go to :
CONCLUSION
Although current diagnostic methods for AD are potent in diagnosing AD patients, the benefits of a blood test, such as high accessibility and low cost, are indisputable and would allow for preventive screening services in the general public. Three novel blood-based biomarker detection technologies have emerged in Korean research institutions, of which have distinguished methods of heightening detection sensitivity and diagnostic accuracy. MDS is a modified sandwich ELISA that selectively measures oligomeric Aβ,50 the CLASS method implements a self-standard analysis on Aβ biomarkers quantified by an IME sensor chip,55 and the composite biomarker of plasma t-tau/Aβ42 had a high correlation with AD-related pathology in the brain of patients.63 The OAβ test and the CLASS analysis enhanced the detection level of plasma Aβ by incubating blood samples with an additional component, but for opposing purposes: MDS spiked the samples with synthesized Aβ42 to promote oligomerization, while CLASS method treated a sample aliquot with EPPS to homogenize Aβ aggregates into monomers. Park and colleagues were the only group to use both tau and Aβ biomarkers and to use prevailing detection technologies. The combination of biomarkers into a stated algorithm in the CLASS method and the plasma t-tau/Aβ42 biomarker may have contributed to the excellent specificity of the two methods.
While the OAβ test and CLASS analysis are different from the plasma t-tau/Aβ42 ratio in terms of requirement of a supplementary reagent, they also share another fundamental distinction, reflected in advantages and limitations of each technology. The OAβ test and CLASS are designed for one biomarker. This single biomarker approach is appealing in its simplicity and convenience of assaying the target analyte via one instrument, reducing the cost of the analysis. In comparison to the OAβ test and CLASS, the third approach of quantifying the ratio of plasma t-tau and Aβ42 is intended for multiple biomarkers. Although the multiple biomarker strategy has improved the overall accuracy in predicting AD related neuropathology, the procedure is more complicated and time consuming. Quantitative assessment of t-tau/Aβ42 relies on the use of two analytical instruments, increasing the cost of the procedure, consumption of chemical reagents, and associated wastes.
The OAβ test is not restricted to the exclusive detection of Aβ oligomers for the diagnostics of AD. MDS used in the OAβ test can detect other forms of misfolded proteins associated with Creutzfeldt-Jakob's disease and Parkinson's disease. This feature of MDS extends the application of the technology and facilitates the development blood-based screening methods for a variety of neurodegenerative disorders. This technology is also available for commercialization in several countries, which would provide global access for academic researchers and clinical investigators. Also, the MDS-OAβ test has achieved good diagnostic ability by yielding 78.3% sensitivity and 86.5% specificity. However, the OAβ test is limited to proteins whose overlapping epitopes are exposed on the surface of the protein for capture and detection by MDS. Although the incubation of plasma samples with synthetic Aβ42 enhances the detection of Aβ oligomers, the mechanism of oligomerization is unknown, and the incubation time takes at least 144 hours.
Regarding the CLASS analysis, the optimized IME system has shown remarkable results in achieving the limit of detection as low as 0.1 pg/mL, solving the problem of detecting low abundance protein in plasma samples. Miniaturized dimensions of IME chip significantly reduce sample volume size, thereby allowing a more rationalized analysis of samples only available in modest quantities. Another advantage of CLASS analysis is the rapidity of the overall process, as the monomerization of Aβ using EPPS and quantification of Aβ monomers via IME each takes approximately 30 minutes. Also, the diagnostic capability of this approach is validated by its high sensitivity and specificity, 93% and 97%, respectively. Nonetheless, the CLASS analysis can be further improved, as the current platform is unable to distinguish monomerized Aβ40 and Aβ42 peptides because of a limited number of well characterized monoclonal antibodies against Aβ. Since the IME sensor has been developed in the laboratory of Kyung Hee University and remains a proprietary technology of this institute, its production and availability are currently restricted to this lab. It is also unknown if the sensor solely detects Aβ monomers since Aβ oligomers can also interact with 6E10 antibodies on the IME sensor, yielding nonspecific signals. Also, the normalization process of CLASS could be refined through elucidation of the extent of Aβ homogenization in plasma samples subject to EPPS treatment.
One of the main advantages of the blood test based on measuring the plasma ratio of t-tau and Aβ42 is the use of commercially available instruments. Commercial off-the-shelf systems can also be customized for a particular experimental purpose, thus increasing the precision of measurement and providing additional flexibility for researchers. Full automation of analytical instruments also generates more rapid delivery of data, reducing the time of the sample assessment to less than one hour. Also, the combination of t-tau and Aβ42 has demonstrated 80% sensitivity and 91.4% specificity respectively, in tracking AD-associated neuropathological changes. Apart from the disadvantages of using the multiple biomarker approach, this diagnostic method requires further research on the correlation between the plasma tau/Aβ42 and CSF tau/Aβ42, which has not been elucidated in this study.
Pathophysiological changes in the AD brain begin decades before the onset of symptoms.78 If such changes are discovered before signs of cognitive impairment, preventive measures can be initiated to slow and possibly inhibit further insidious pathogenesis. Neuropsychological testing, brain imaging, and CSF analysis are only available to those who seek medical diagnosis, and individuals in such cases are more likely to be in a later stage of AD. The clinical implementation of AD blood tests would provide an accessible diagnostic method for presymptomatic individuals as a primary screening point and enable early identification of those in need of secondary screening. Early diagnosis followed by early intervention is critical in the prevention of AD progression, as a modest delay of five years in the onset of AD is estimated to lower the prevalence rates by 41%.79 Also, since blood collection is easy to perform, the samples can be collected in primary care settings26 and the homes of immobilized patients. This simplicity is also advantageous for tracking the progression of the disease because they can be conducted multiple times with a small burden on patients.
Following the impact in clinical settings, development of AD blood tests will also accelerate the clinical development of new therapeutics in research settings. As diagnostic blood tests will increase the number of AD patients identified in various preclinical stages, an increased number of clinical trials can be performed with patients in specific stages of the disease. The efficacy of the drugs can be evaluated by closely monitoring the pathophysiological changes in the blood of AD patients weekly or daily. Altogether, the development of an accurate blood test will facilitate the discovery of a disease-modifying drug for AD.
The major issue for AD blood tests is that there is currently no cure for AD. Although symptomatic drugs, such as acetylcholinesterase inhibitors and memantine,80 and nonpharmaceutical interventions such as cognitive training818283 have been shown to ameliorate cognitive impairment, there is no possible path to completely cure AD. While clinical blood tests for AD are beneficial in many aspects, we must see commercially available disease-modifying drugs to make use of this technology. Although implementation of an AD blood test will eventually expedite AD drug discovery, without an immediate treatment, the point-of-care diagnosis may be rejected by the general public. A prerequisite for AD blood tests to be widely accommodated is a method to inhibit and cure the disease. Diagnosis and treatment are essential to overcome the silent epidemic, and the development of an AD blood test may be the key to both.
Go to :
 XML Download