

 PDF
PDF ePub
ePub Citation
 Print
Print


INTRODUCTION
It is difficult to estimate the depth of the focal source by activation mapping, even with the use of an electroanatomical mapping system. This is a particularly important issue for a thick myocardial region, such as the left ventricle. Ablation lesion depth in experimental preparations is ≤6 mm as measured by a conventional 4-mm-tip catheter1)2) and 9.9 mm as measured by an external irrigation catheter.3) However, the creation of transmural lesions by radiofrequency (RF) ablation technology is limited in real-world clinical practice despite the fact that RF energy delivery with high power and high contact force can improve lesion volume and depth.4) If a deep target location is found during the catheter ablation procedure, it is possible to move to the other side, such as the epicardium. Therefore, if the depth of the target site is known, adjustments can be confidently made to the ablation strategy.
The earliest activation site can be detected with conventional electrophysiological mapping methods or an electroanatomical mapping system. The distal electrode (D) of the mapping catheter can be placed at the earliest activation site to record the time interval between the distal and proximal electrodes during tachycardia (Ttachy; Figure 1A and B). That site can also be stimulated with D pacing to record the time interval between distal and proximal electrodes during pacing (Tpace; Figure 1C).
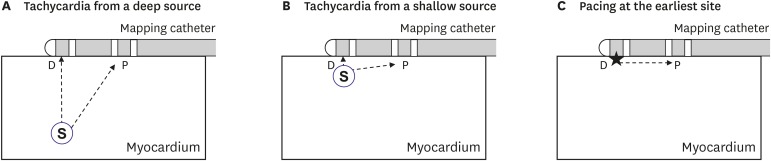
In the case of focal activation from a deep source, Ttachy will be short because the difference between the time intervals from the focal activation source (S) to the proximal electrode (P) and from S to the D is small (Figure 1A). However, in the case of focal activation from a shallow source, Ttachy will be longer due to the shorter time interval from S to D (Figure 1B). As Ttachy can be affected by the conduction velocity of the underlying myocardium, its absolute value may vary. Ttachy can be corrected with Tpace to reduce this variability.
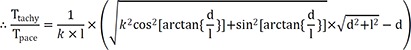
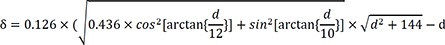
The depth index (δ) is defined as follows:

If the depth of the focal source=0, δ will be ~1. This index may be more independent of conduction velocity than Ttachy. Deeper focal sources will be associated with lower δ values.
The present study was performed to demonstrate the usefulness of these parameters in estimating the depth of the S.
Go to : 
METHODS
Surgical preparation for in vivo experiments
The study protocol was approved by Seoul National University Hospital Institutional Animal Care and Use Committee (IACUC No. 16-0136-S1A0). Three adult male mongrel dogs weighing 25–30 kg were used. Dogs were anesthetized with a tiletamine/zolazepam combination (Zoletil 5 mg/kg intravenous; Virbac, Carros, France), intubated, respirated, and monitored under gaseous anesthesia (1–2% isoflurane/O2). All measures were taken to ensure that the degrees of discomfort, distress, pain, and injury were limited to that which was unavoidable. Surface electrocardiogram (ECG) and O2 saturation were monitored continuously throughout the experiment. An electric heating pad was used to maintain body temperature at 36–37°C. Median thoracotomy and pericardiotomy were performed to expose the epicardial surface of the left ventricle.
Electrophysiological study protocol
ECG and ventricular unipolar and bipolar electrograms were displayed and recorded on a Prucka Cardiolab EP System (GE Medical Systems, Fairfield, CT, USA) with a filter setting of 0.05–500 Hz for unipolar and 30–500 Hz for bipolar electrograms.
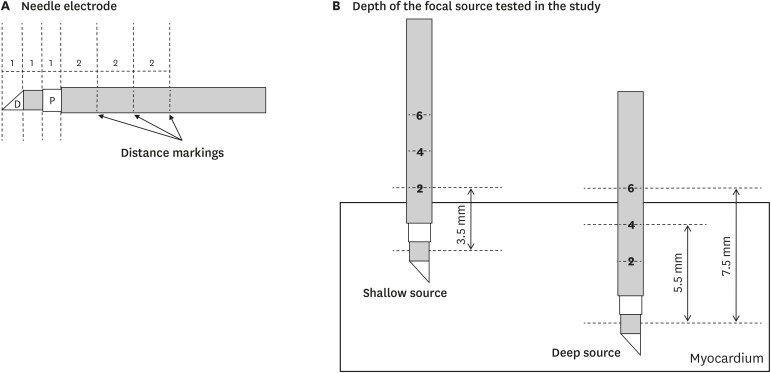
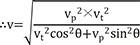
A custom-made bipolar needle electrode was used to simulate the focal source of ventricular activation (Figure 2A). The electrode was 1 mm in size and had 2-mm depth markings along its length, and the inter-electrode distance was 1 mm. The electrode was inserted at a predefined depth from the epicardial side of the left ventricle. For shallow source simulation, its depth was maintained at <3.5 mm (i.e., lower than the first marking) throughout the experiment. For deep source simulation, its depth was maintained at 5.5–7.5 mm (i.e., between the second and third markings; Figure 2B). A mapping catheter (Duo-Decapolar, Livewire; Abbott, Plymouth, MN, USA) with an electrode tip size of 2 mm, band electrode size of 1 mm, and inter-electrode spacing of 2-10-2 mm was placed at the mapping area. The position of the center of the distal 2 electrodes was kept at the insertion site of the needle electrode. All 4 electrodes of the mapping catheter were kept in contact with the epicardial surface during the experiment.
Ventricular pacing was delivered by the bipolar needle electrode for focal source simulation or the distal 2 electrodes of the mapping catheter for depth estimation pacing with twice the diastolic threshold and cycle length of 400 ms for 3 seconds in each pacing session. Time intervals between unipolar electrograms of distal (1) and proximal (3) electrodes of the mapping catheter were measured during needle electrode pacing (Ttachy) and mapping catheter pacing (Tpace; Figure 3A and B, Figure 4). Local activation time point was defined as maximum negative dV/dt in unipolar electrogram.
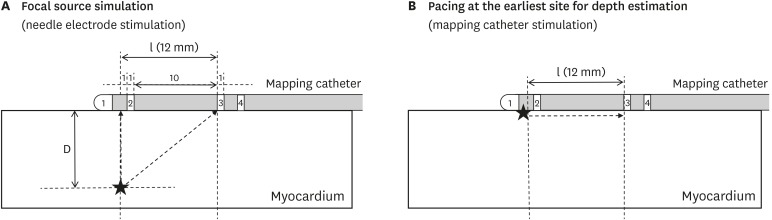 | Figure 3Mapping catheter position during focal source simulation (A) and pacing at the earliest site for depth estimation (B). Stars indicate stimulation sites.D = distal electrode; l = inter-electrode distance.
|
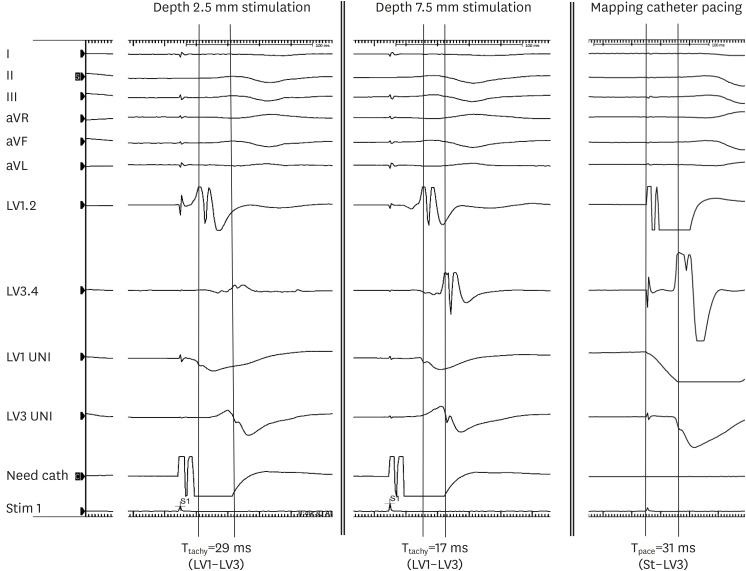 | Figure 4Representative electrograms during focal source simulation (depth 2.5 mm and 7.5 mm) and mapping catheter pacing at the earliest site. I, II, III, aVR, aVL, and aVF are ECG channels. LV1, 2 and LV3, 4 are bipolar electrograms. LV1 UNI and LV3 UNI are unipolar electrograms.aVF = augmented vector foot; aVL = augmented vector left; aVR = augmented vector right; ECG = electrocardiogram; LV = left ventricular; Need cath = needle electrode catheter; Tpace = time interval between distal and proximal electrodes during distal electrode pacing of the mapping catheter; Ttachy = time interval between distal and proximal electrodes of the mapping catheter during needle electrode pacing.
|
Average parallel conduction velocity (vp) was calculated during mapping catheter pacing as (inter-electrode distance)/Tpace, and average transmural conduction velocity (vt) was calculated during needle electrode pacing as depth/(time interval from stimulation to the D of the mapping catheter) in each pacing session.
Theoretical consideration
If we assume that depth (d), inter-electrode distance (l), average conduction velocity from the source to the proximal electrode (v), vp, and vt (Figure 5), Ttachy and Tpace are expressed by the following equations:
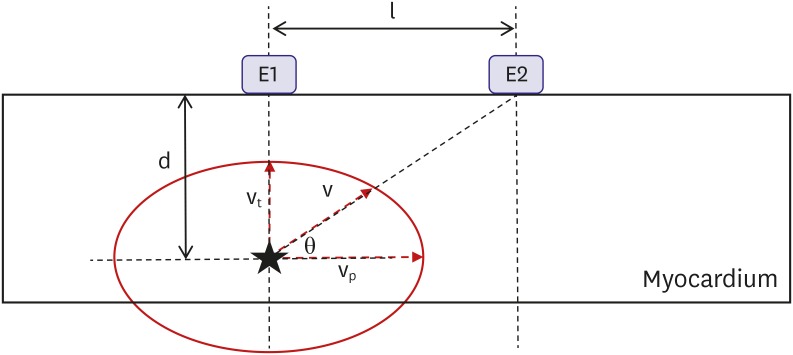 | Figure 5Experimental setting assumptions. Star indicates focal activation source.d = depth; E1 and E2 = electrodes; l = inter-electrode distance; θ = vector angle of v; v = average conduction velocity from the source to the proximal electrode (E2); vp = average parallel conduction velocity; vt = average transmural conduction velocity.
|

If vt=k×vp (0<k≤1), then
If we assume elliptical conduction (Figure 5), then
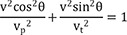
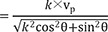
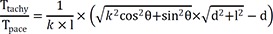
The vector angle of v (θ) is calculated as:

Therefore, the following equation will be applicable equation (1):
If we consider that l=10 mm in case of non-anisotropic conduction (k=1), then equation (1) will be:
However, anisotropic conduction should be considered. The ratio of longitudinal-to-transverse conduction velocity measured in the muscle bundles of the calf right ventricle=3.0.5) In this condition, k=1/3, and equation (1) is:
However, the real-world ratio (k) of average transmural-to-parallel conduction velocity in the left ventricle depends on the underlying myocardial fiber orientation and mapping catheter position. Therefore, k will generally have a value between 1/3 and 1. Plots of δ and depth according to k are shown in Figure 6A.
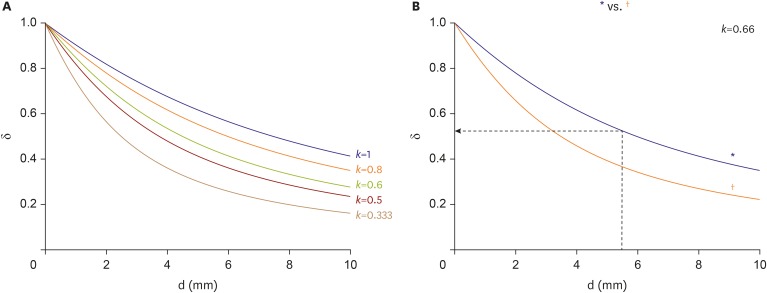 | Figure 6δ versus d of the focal source. (A) δ depending on different conditions of anisotropic conduction (k=vt/vp). (B) δ according to inter-electrode distance of the mapping catheter when k=0.66.δ = depth index; d = depth; vp = average parallel conduction velocity; vt = average transmural conduction velocity.
*2-10-2 spacing; †2-5-2 spacing.
|
Statistical analysis
Numerical data are presented as mean±standard deviation. Comparisons were performed using t-tests. P values<0.05 were considered statistically significant. ROC analysis was performed with Prism 6 (GraphPad Software Inc., San Diego, CA, USA). Simulations for each equation were performed with MATLAB R2018b (The MathWorks Inc., Natick, MA, USA).
Go to :
RESULTS
In vivo results
A total of 44 focal sources (15 shallow and 29 deep) were evaluated. vp was 0.45±0.12 mm/ms. vt was 0.29±0.046 mm/ms. The k of vt to vp was 0.66±0.081 (range, 0.51–0.83).
Ttachy were 24±7.7 ms and 15±5.6 ms for shallow-source and deep-source simulation, respectively (p<0.001, Figure 7A). According to ROC analysis, a Ttachy<21 ms was indicative of a deep source with 73% specificity and 86% sensitivity (Figure 7B).
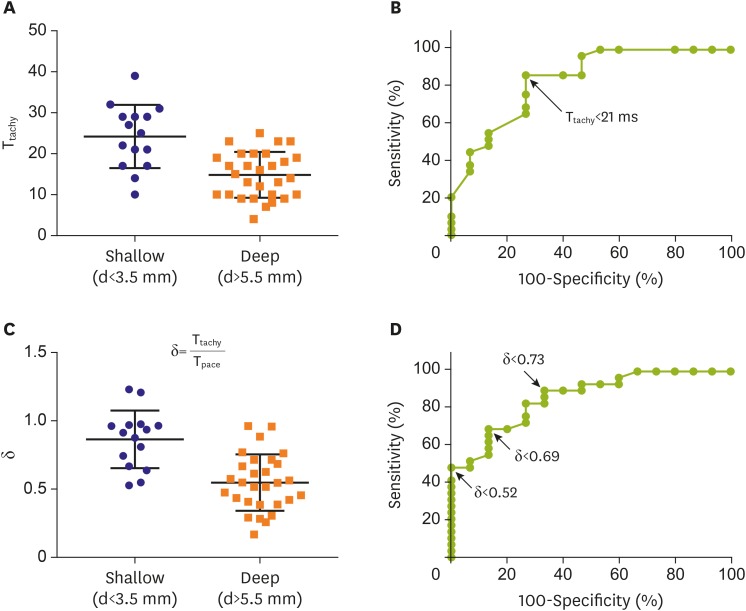 | Figure 7Ttachy in shallow source and deep source simulation (A) and ROC analysis results (B). δ in shallow source and deep source simulation (C) and ROC results (D). Bars in (A) and (C) indicate mean±standard deviation.δ = depth index; d = depth; ROC = receiver operating characteristic; Tpace = time interval between distal and proximal electrodes during distal electrode pacing of the mapping catheter; Ttachy = time interval between distal and proximal electrodes of the mapping catheter during needle electrode pacing.
|
δ values were 0.86±0.21 and 0.55±0.21 for shallow-source and deep-source simulation, respectively (p<0.001, Figure 7C). According to ROC analysis, a δ<0.73 was indicative of a deep source with 73% specificity and 83% sensitivity, a δ<0.63 was indicative of a deep source with 87% specificity and 69% sensitivity, and a δ<0.52 was indicative of a deep source with 100% specificity and 48% sensitivity (Figure 7D).
Simulation using in vivo data
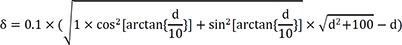
Based on the above data, following experimental condition was considered: l=12 mm and anisotropic conduction (k)=0.66. Equation (1) will thus be:
Plots of δ and depth according to above condition are shown in Figure 6B. When depth=5.5 mm, δ=0.52. Therefore, if δ<0.52, then the depth of the focal source will be >5.5 mm.
Go to :
DISCUSSION
Ttachy were shorter for deep sources. A Ttachy<21 ms was indicative of a deep source with 73% specificity and 86% sensitivity. A novel δ for estimating the depth of the focal source of activation was mathematically and experimentally demonstrated. The δ was smaller for deep sources, with δ<0.63 indicating a deep source with 87% specificity and 69% sensitivity.
Current RF ablation technology has limited capacity to create transmural lesions, especially in thick myocardium such as the ventricle. Therefore, if a deep source is expected, the endocardial strategy should be changed to an epicardial approach.
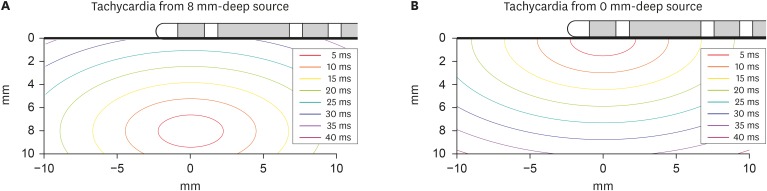
An ablation target can be determined as deep or shallow using an isochronal map generated by most electroanatomical mapping systems. In the case of a deep target, the area of the early-activation site will be relatively wide. Figure 8 shows a simulated isochronal map based on the present study. The deeper the focus location, the more similar the activation times between the distal and P.
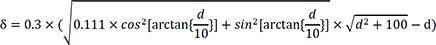
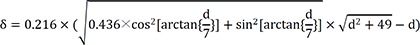
If a mapping catheter with 2-5-2 mm inter-electrode spacing is used, then l=7 mm. Equation (1) will be as following in the case of anisotropic conduction (k=0.66):
Plots of δ and depth according to above l are shown in Figure 6B (†). When d=5 mm, δ=0.39. Therefore, if δ<0.39, then the depth of the focal source will be >5 mm. Therefore, the δ indicating a deep source will be lower if a catheter with a short l is used for mapping. Use of a catheter with a very small l would not allow easy measurement of Ttachy and Tpace because their values would be very small, with possibly <10-ms difference.
Mapping for depth estimation can be applied to any focal tachycardia from atria or ventricles. As the data from this study are canine left ventricular data, direct application of Ttachy or δ values demonstrated in the present study may not be appropriate for human patients. However, human data for successful ablations could be obtained, such as Ttachy or δ indicating epicardial-origin ventricular tachycardia in the future clinical trials. As Ttachy is affected by the conduction velocity of the underlying myocardium, criteria using absolute values may have limited value. The δ may be relatively independent of conduction velocity because it is corrected by a parallel conduction component. However, it is affected by anisotropic conduction properties and non-homogeneity of the underlying myocardium.
In the real-world practice, it is not easy to place all 4 electrodes of a catheter firmly on the endocardial surface to perform appropriate measurement. However, this concept could be applicable in 3 dimensional electroanatomical mapping by observing the intervals of an isochronal map. Smaller Ttachy results in wider intervals in an isochronal map which indicate a deep source.
This study has some limitations. First, the hypothesis of the present study was based on the assumption of a homogeneous myocardial structure. However, conduction in the heart is not homogeneous in every direction, and there may even be physical obstacles such as myocardial scar. Second, in vivo data were obtained from an animal model, and experiments were performed during epicardial mapping. However, suspicion of an epicardial source during endocardial mapping is much more common in clinical practice. Therefore, the present observations may differ from those from clinical patients. Third, reentry is a more common mechanism than focal source activation in clinical ventricular tachycardia. Fourth, the myocardium surrounding the 2 electrodes as well as tissues between the electrodes can be captured by the electrical stimulation, thus an unavoidable error could be produced although minimal amplitude of stimulation was used. Fifth, there are possible chances of inter-observer and intra-observer errors in the measurement of time intervals. Sixth, a mapping catheter with an inter-electrode spacing of 2-10-2 mm is relatively less used than a catheter with 2-5-2 mm spacing. In addition, a catheter with an electrode tip size of 2 mm is relatively less used in clinical practice because an ablation catheter is used more frequently and that has a larger tip size than 2 mm.
Therefore, our results may have limited clinical applicability. However, the method demonstrated in the present study may be a relatively simple and useful technique for differentiating a deep source from a shallow source.
In conclusion, Ttachy was shorter and δ was smaller for a S than for a shallow activation source.
Go to :
 XML Download