Abstract
Background
The weather has well-documented effects on infectious disease and reports suggest that summer peaks in the incidences of gram-negative bacterial infections among hospitalized patients. We evaluated how season and temperature changes affect bloodstream infection (BSI) incidences of major pathogens to understand BSI trends with an emphasis on
Methods
Incidence rates of BSIs by Staphylococcus aureus, Enterococcus spp., Escherichia coli, Klebsiella pneumoniae, Acinetobacter spp., and Pseudomonas aeruginosa were retrospectively analyzed from blood cultures during 2008–2016 at a university hospital in Seoul, Korea according to the acquisition sites. Warm months (June–September) had an average temperature of ≥20 °C and cold months (December–February) had an average temperature of ≤5 °C.
Results
We analyzed 18,047 cases, where 43% were with community-onset BSI. E. coli (N = 5,365) was the most common pathogen, followed byEnterococcus spp. (N = 3,980),S. aureus (N = 3,075), K. pneumoniae (N = 3,043),Acinetobacter spp. (N = 1,657), andP. aeruginosa (N = 927). The incidence of hospital-acquired BSI byEnterococcus spp. was weakly correlated with temperature, and the median incidence was higher during cold months. The incidence of community-onset BSI by E. coli was higher in warm months and was weakly correlated with temperature.
Go to : 
References
2. Polgreen PM, Polgreen EL. Infectious diseases, weather, and climate. Clin Infect Dis. 2018; 66:815–7.

3. Eber MR, Shardell M, Schweizer ML, Laxminarayan R, Perencevich EN. Seasonal and temperature-associated increases in gram-negative bacterial bloodstream infections among hospitalized patients. PLoS One. 2011; 6:e25298.

4. Perencevich EN, McGregor JC, Shardell M, Furuno JP, Harris AD, Morris JG, et al. Summer peaks in the incidences of gram-negative bacterial infection among hospitalized patients. Infect Control Hosp Epidemiol. 2008; 29:1124–31.

5. Retailliau HF, Hightower AW, Dixon RE, Allen JR. Acinetobacter calcoaceticus: a nosocomial pathogen with an unusual seasonal pattern. J Infect Dis. 1979; 139:371–5.

6. Richet H. Seasonality in gram-negative and healthcare-associated infections. Clin Microbiol Infect. 2012; 18:934–40.

7. Rodrigues FS, Clemente de Luca FA, Ribeiro da Cunha A, Fortaleza CMCB. Seasons, weather and predictors of healthcare-associated gram-negative bloodstream infections: a case-only study. J Hosp Infect. 2019; 101:134–41.
8. Kim YA, Kim JJ, Won DJ, Lee K. Seasonal and temperature-associated increase in community-onset Acinetobacter baumannii complex colonization or infection. Ann Lab Med. 2018; 38:266–70.

9. Flournoy DJ, Stalling FH, Catron TL. Seasonal and monthly variation of Streptococcus pneumoniae and other pathogens in bacteremia (1961–1981). Ecol Dis. 1983; 2:157–60.
10. Friedman ND, Kaye KS, Stout JE, McGarry SA, Trivette SL, Briggs JP, et al. Healthcare-associated bloodstream infections in adults: a reason to change the accepted definition of community-acquired infections. Ann Intern Med. 2002; 137:791–7.
11. Colpan A, Johnston B, Porter S, Clabots C, Anway R, Thao L, et al. Escherichia coli Sequence type 131 (ST131) subclone H30 as an emergent multidrug-resistant pathogen among US veterans. Clin Infect Dis. 2013; 57:1256–65.

12. Kim YA, Kim JJ, Kim H, Lee K. Community-onset extended-spectrum-β-lactamase-producing Escherichia coli sequence type 131 at two Korean community hospitals: the spread of multidrug-resistant E. coli to the community via healthcare facilities. Int J Infect Dis. 2017; 54:39–42.

13. Spellberg B, Doi Y. Editor's choice: the rise of fluoroquinolone-resistant Escherichia coli in the community: scarier than we thought. J Infect Dis. 2015; 212:1853–5.
14. Lazarus B, Paterson DL, Mollinger JL, Rogers BA. Do human extraintestinal Escherichia coli infections resistant to expanded-spectrum cephalosporins originate from food-producing animals? a systematic review. Clin Infect Dis. 2014; 60:439–52.

15. Eveillard M, Kempf M, Belmonte O, Pailhoriès H, Joly-Guillou ML. Reservoirs of Acinetobacter baumannii outside the hospital and potential involvement in emerging human community-acquired infections. Int J Infect Dis. 2013; 17:e802–5.

16. Lee Y, Kim YA, Song W, Lee H, Lee HS, Jang SJ, et al. Recent trends in antimicrobial resistance in intensive care units in Korea. Korean J Nosocomial Infect Control. 2014; 19:29–36.

17. Ratkowsky D, Lowry R, McMeekin T, Stokes A, Chandler R. Model for bacterial culture growth rate throughout the entire biokinetic temperature range. J Bacteriol. 1983; 154:1222–6.

18. Raetz CR, Reynolds CM, Trent MS, Bishop RE. Lipid a modification systems in gram-negative bacteria. Annu Rew Bochem. 2007; 76:295–329.

19. Yang J, Bae S, Park C, Lee K. Presented at the Korean society of infectious diseases and Korean society of antimicrobial therapy. 2018.
20. Ahn GY, Lee SH, Jeong OY, Chaulagain BP, Moon DS, Park YJ. Trends of the species and antimicrobial susceptibility of microorganisms isolated from blood cultures of patients. Korean J Clin Microbiol. 2006; 9:42–50.
21. Kim N, Hwang J, Song K, Choe PG, Park WB, Kim ES, et al. Changes in antimicrobial susceptibility of blood isolates in a university hospital in South Korea, 1998–2010. Infect Chemother. 2012; 44:275–81.

22. Kim SY, Lim G, Kim MJ, Suh JT, Lee HJ. Trends in five-year blood cultures of patients at a university hospital (2003∼ 2007). Korean J Clin Microbiol. 2009; 12:163–8.
Go to : 
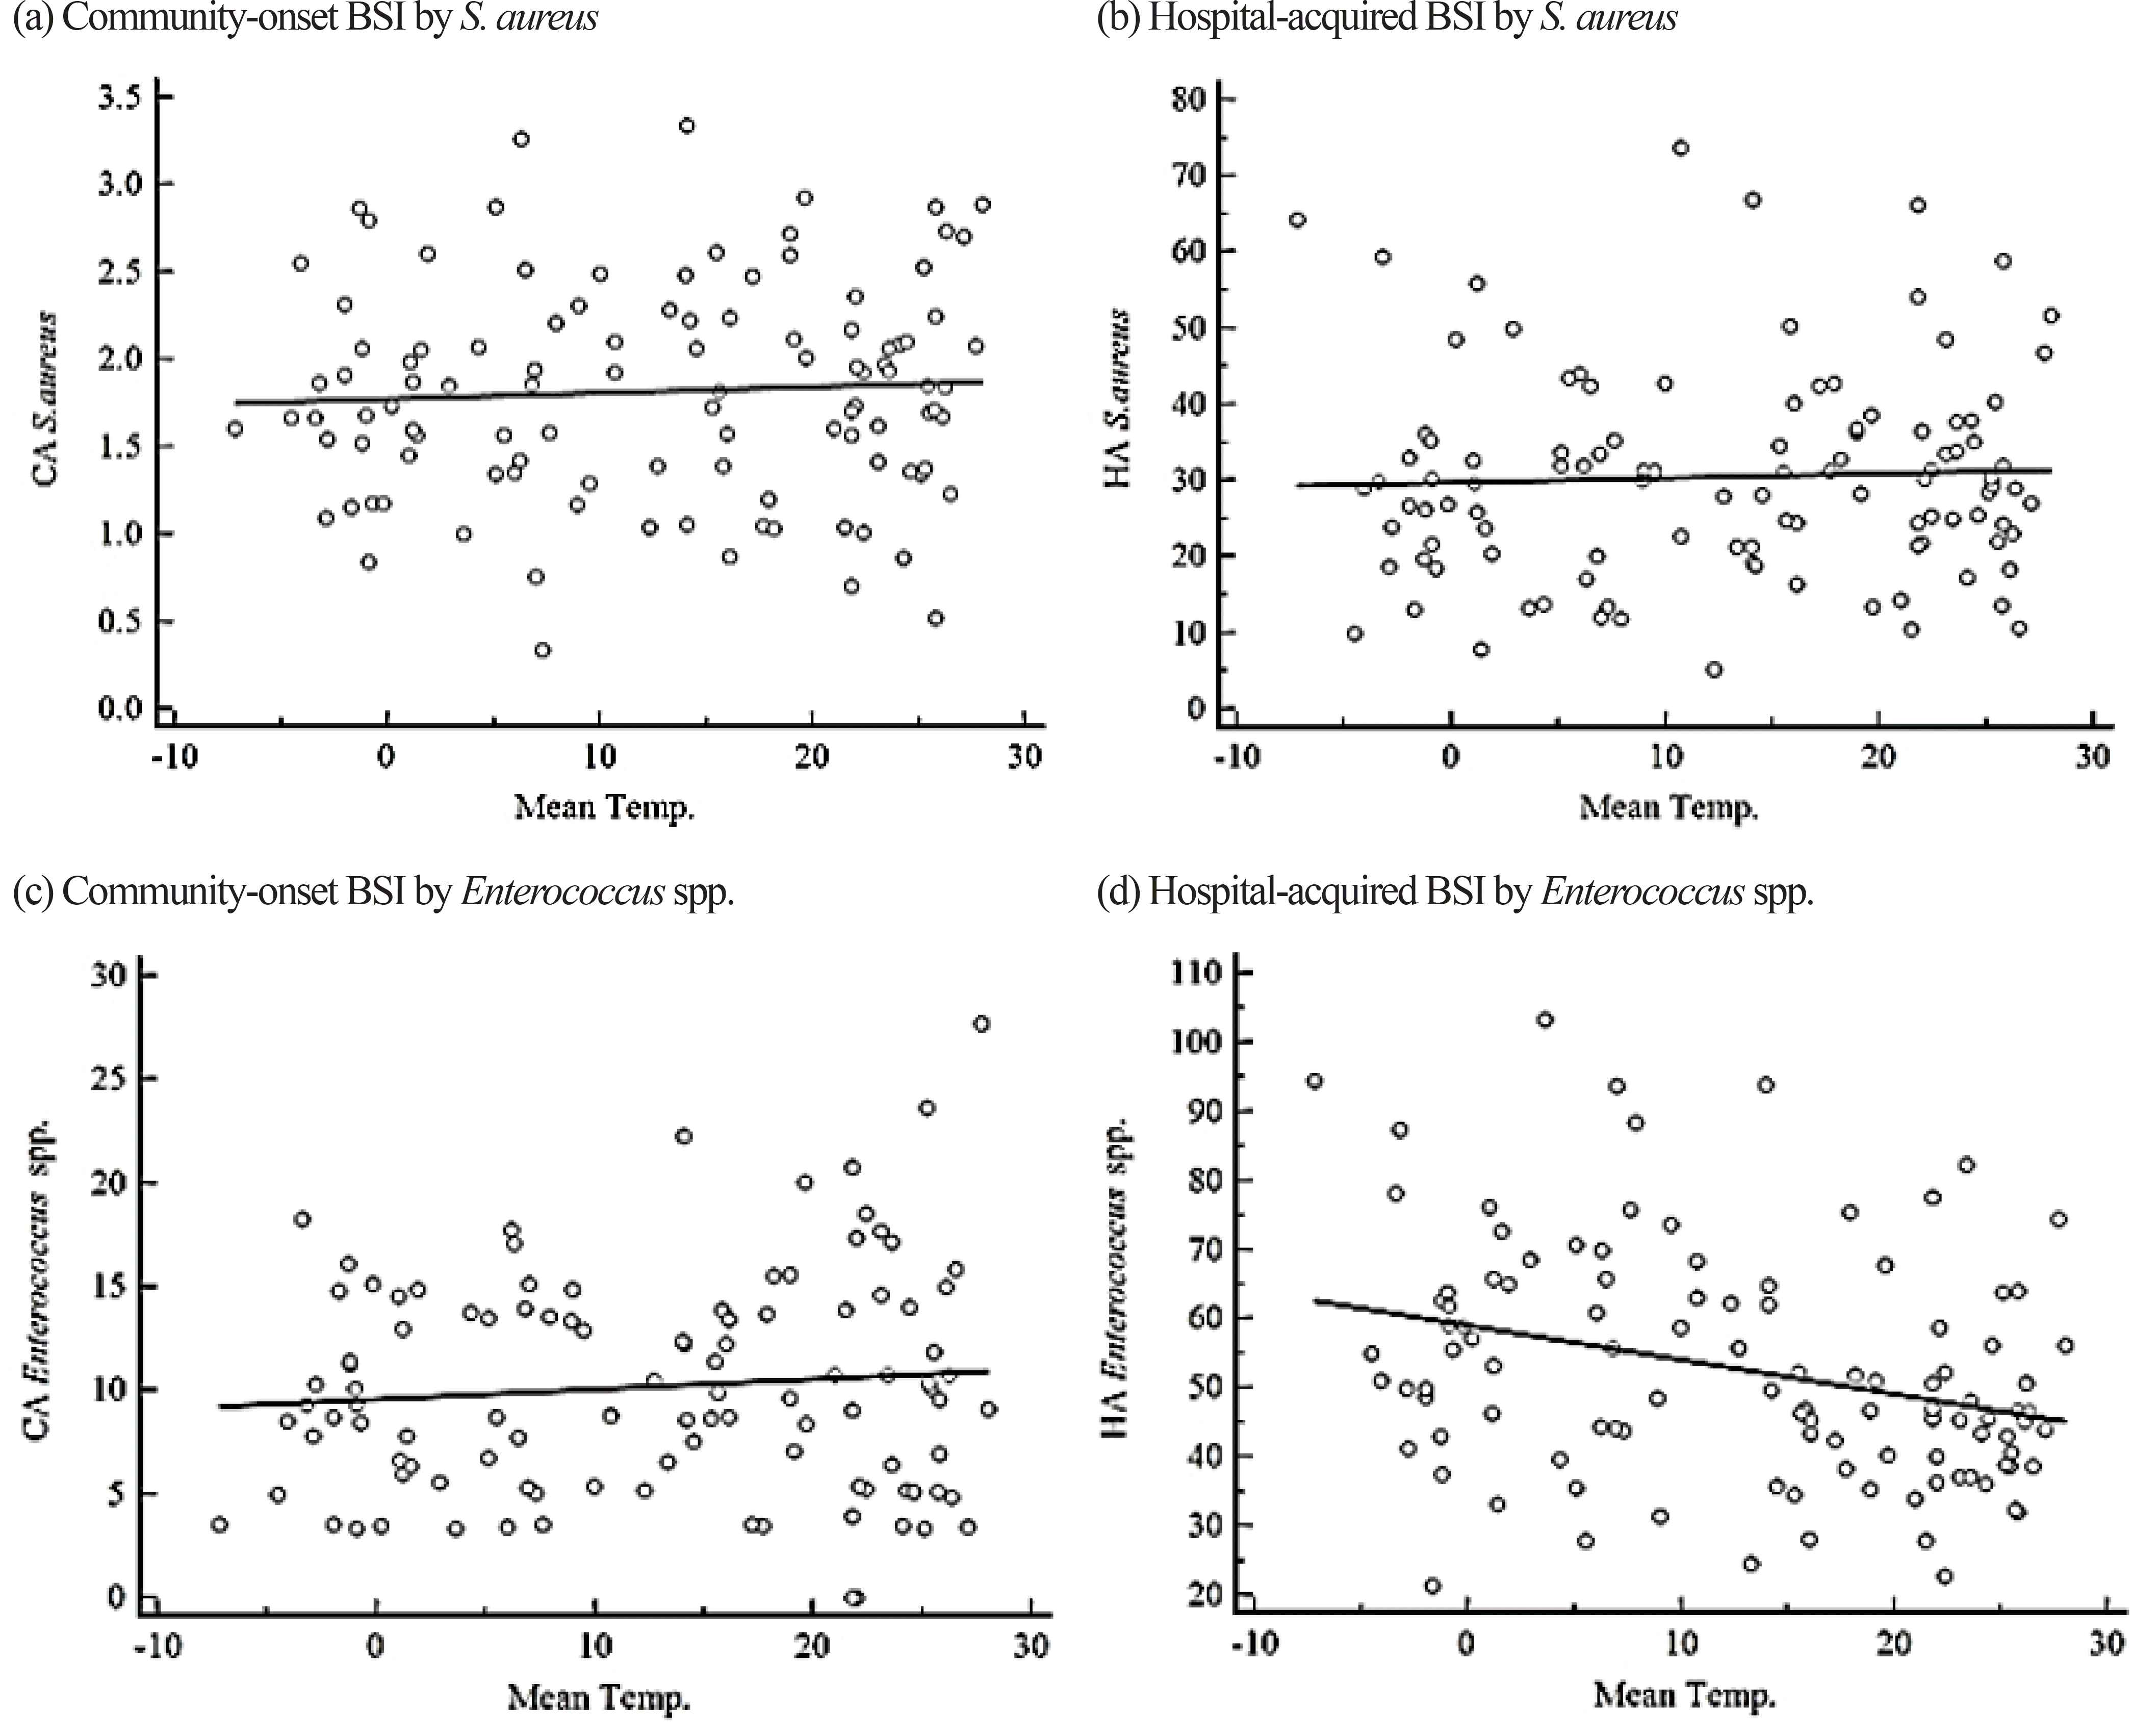
 | Fig. 1.Correlation between bloodstream infection (BSI) by gram-positive cocci and average monthly temperature from 2008–2016 based on Pearson's correlation coefficient. (a) Temperature (°C) vs. incidence rate of community-onset BSI by S. aureus (cases per 105 patient days), y = 0.00337x+1.774, r = 0.0565, P = 0.5612. (b) Temperature (°C) vs. incidence rate of hospital-acquired BSI by S. aureus (cases per 106 patient days), y = 0.0588x+29.781, r = 0.0444, P = 0.6484. (c) Temperature (°C) vs. incidence rate of community-onset BSI by Enterococcus spp. (cases per 105 patient days), y = 0.0488x+9.558, r = 0.0952, P = 0.3273. (d) Temperature (°C) vs. incidence rate of hospital-acquired BSI by Enterococcus spp. (cases per 106 patient days), y = −0.495x+59.061, r = −0.3020, P = 0.0015. CA, community-onset; HA, hospital-acquired; Temp., temperature. |
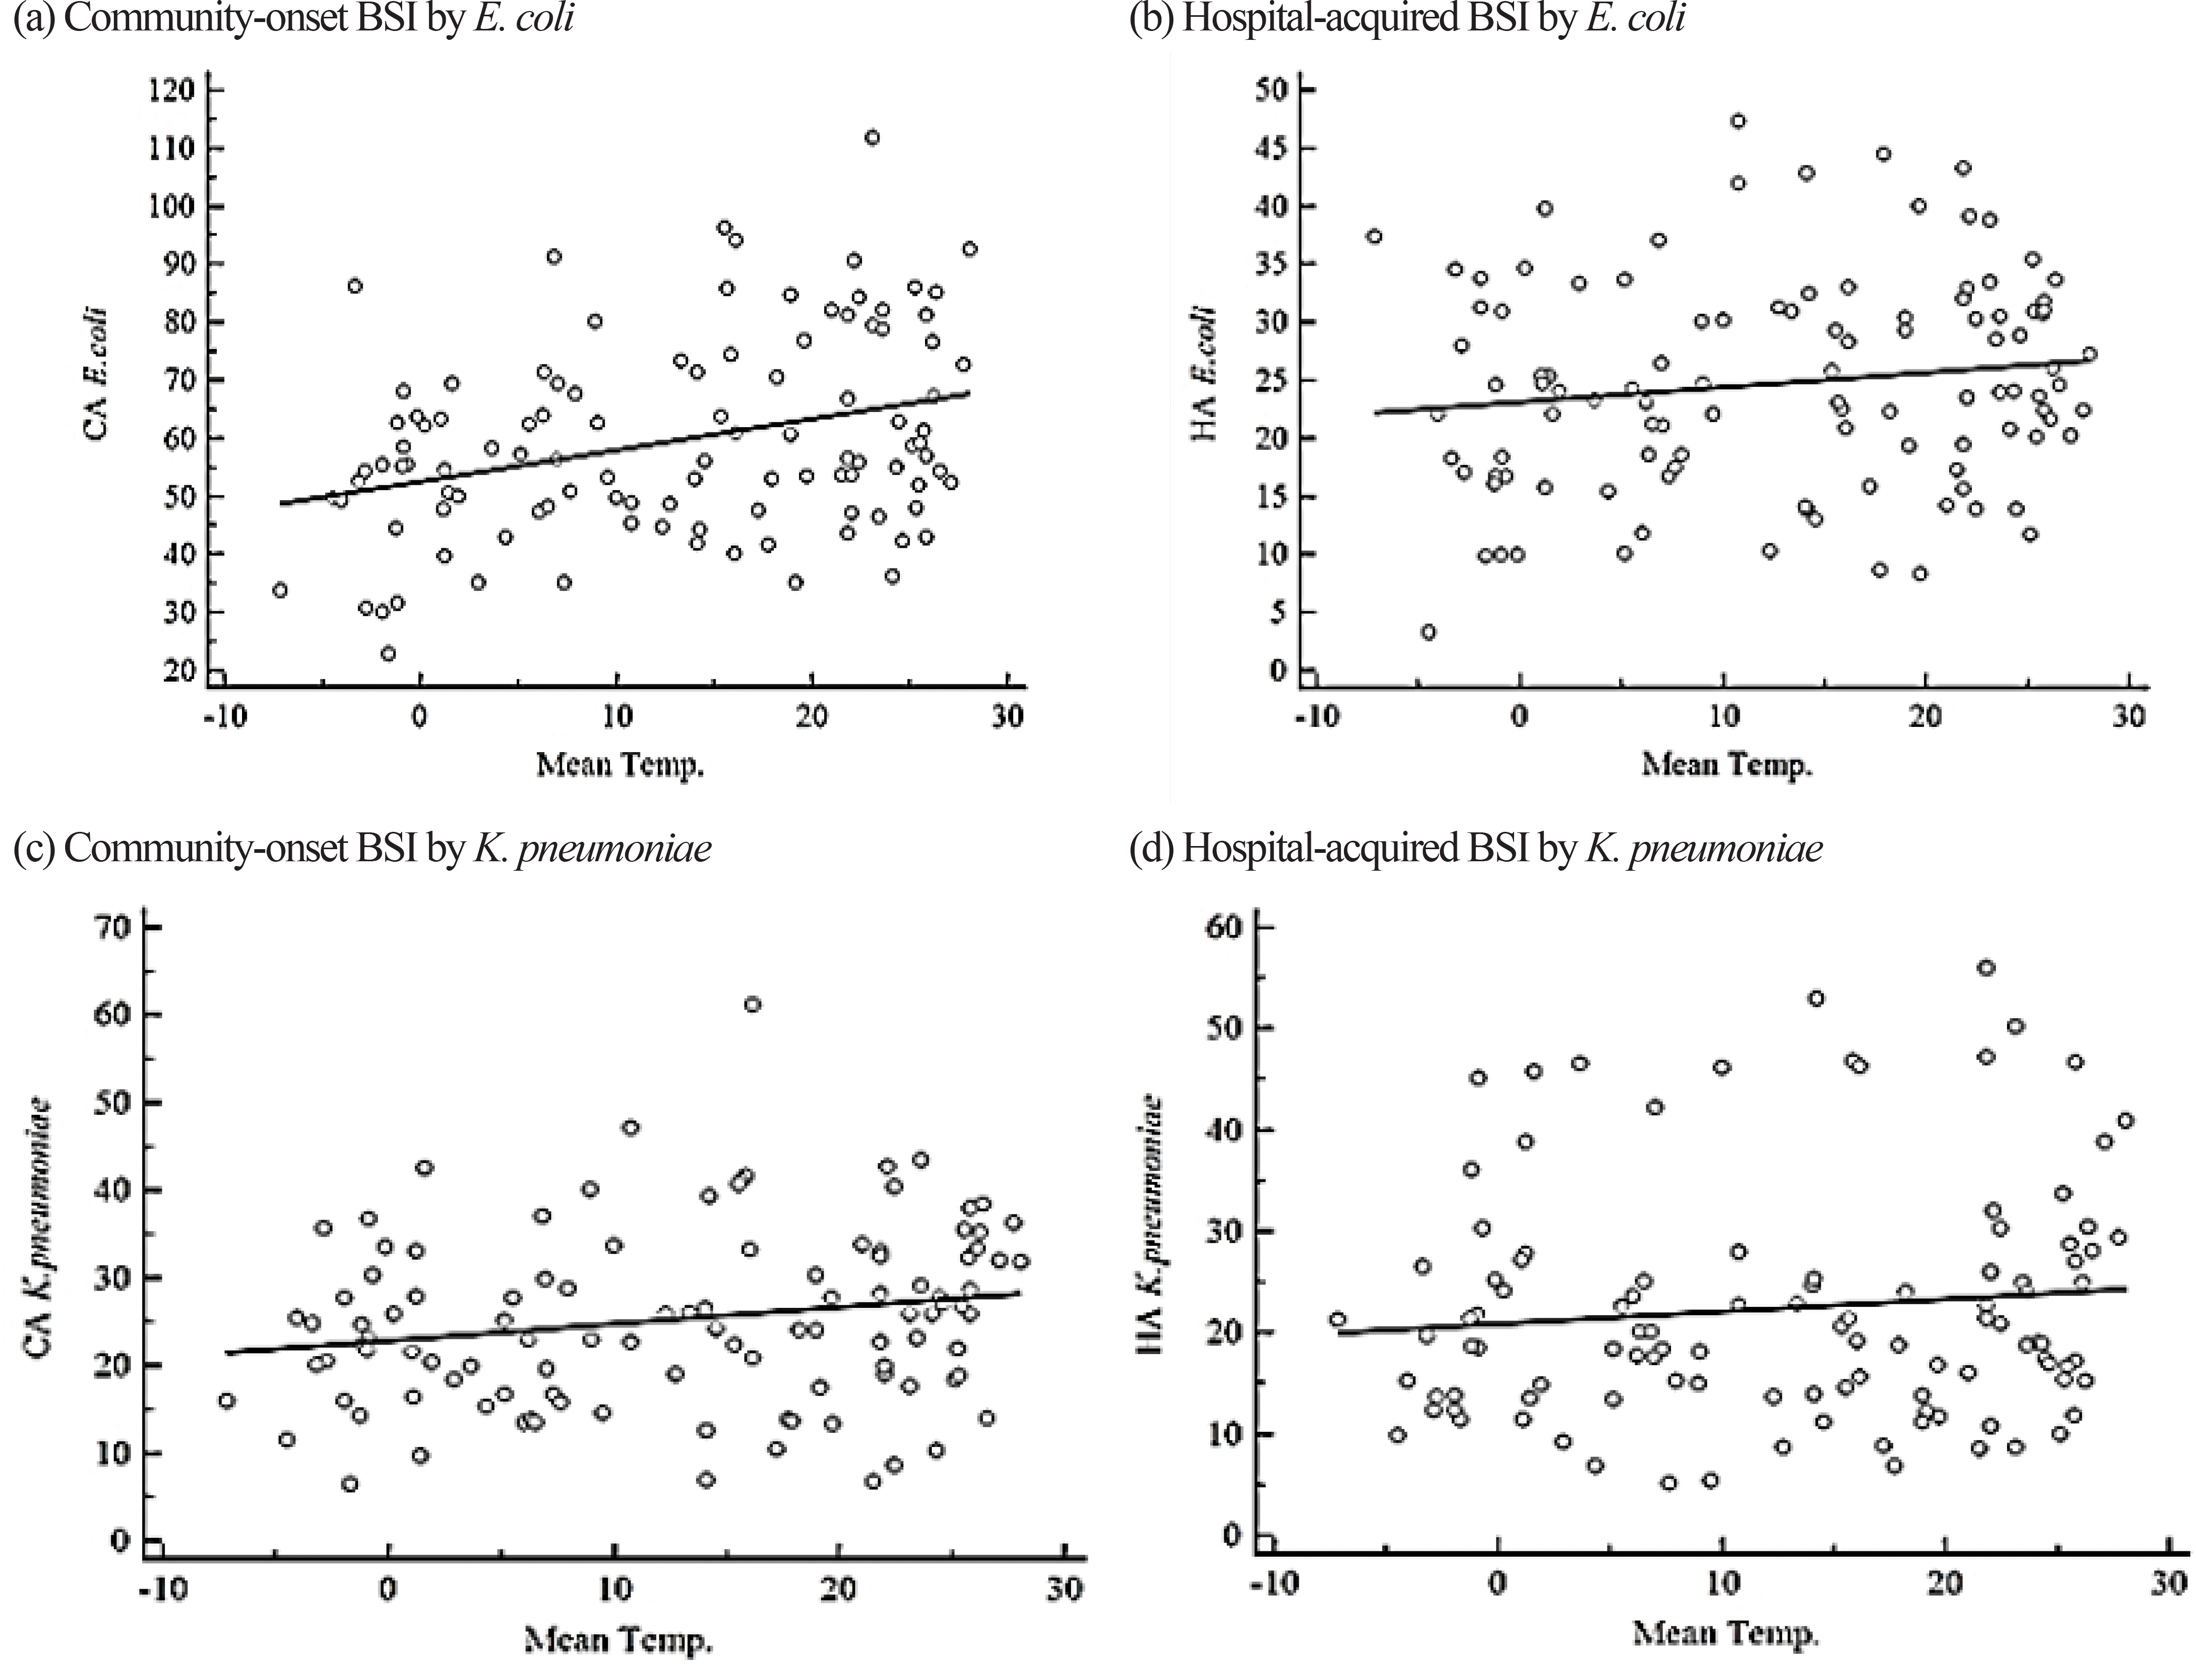
 | Fig. 2.Correlation between bloodstream infection (BSI) by gram-negative bacilli and average monthly temperature from 2008–2016 based on Pearson's correlation coefficient. (a) Temperature (°C) vs. incidence rate of community-onset BSI by E. coli (cases per 105 patient days), y = 0.540x+52.754, r = 0.3304, P = 0.0005. (b) Temperature (°C) vs. incidence rate of hospital-acquired BSI by E. coli (cases per 106 patient days), y = 0.128x+23.142, r = 0.1443, P = 0.1363. (c) Temperature (°C) vs. incidence rate of community-onset BSI by K. pneumoniae (cases per 105 patient days), y = 0.193x+22.874, r = 0.1986, P = 0.0394. (d) Temperature (°C) vs. incidence rate of hospital-acquired BSI by K. pneumoniae (cases per 106 patient days), y = 0.124x+20.931, r = 0.1094, P = 0.2596. CO, community-onset; HA, hospital-acquired; Temp., temperature. |
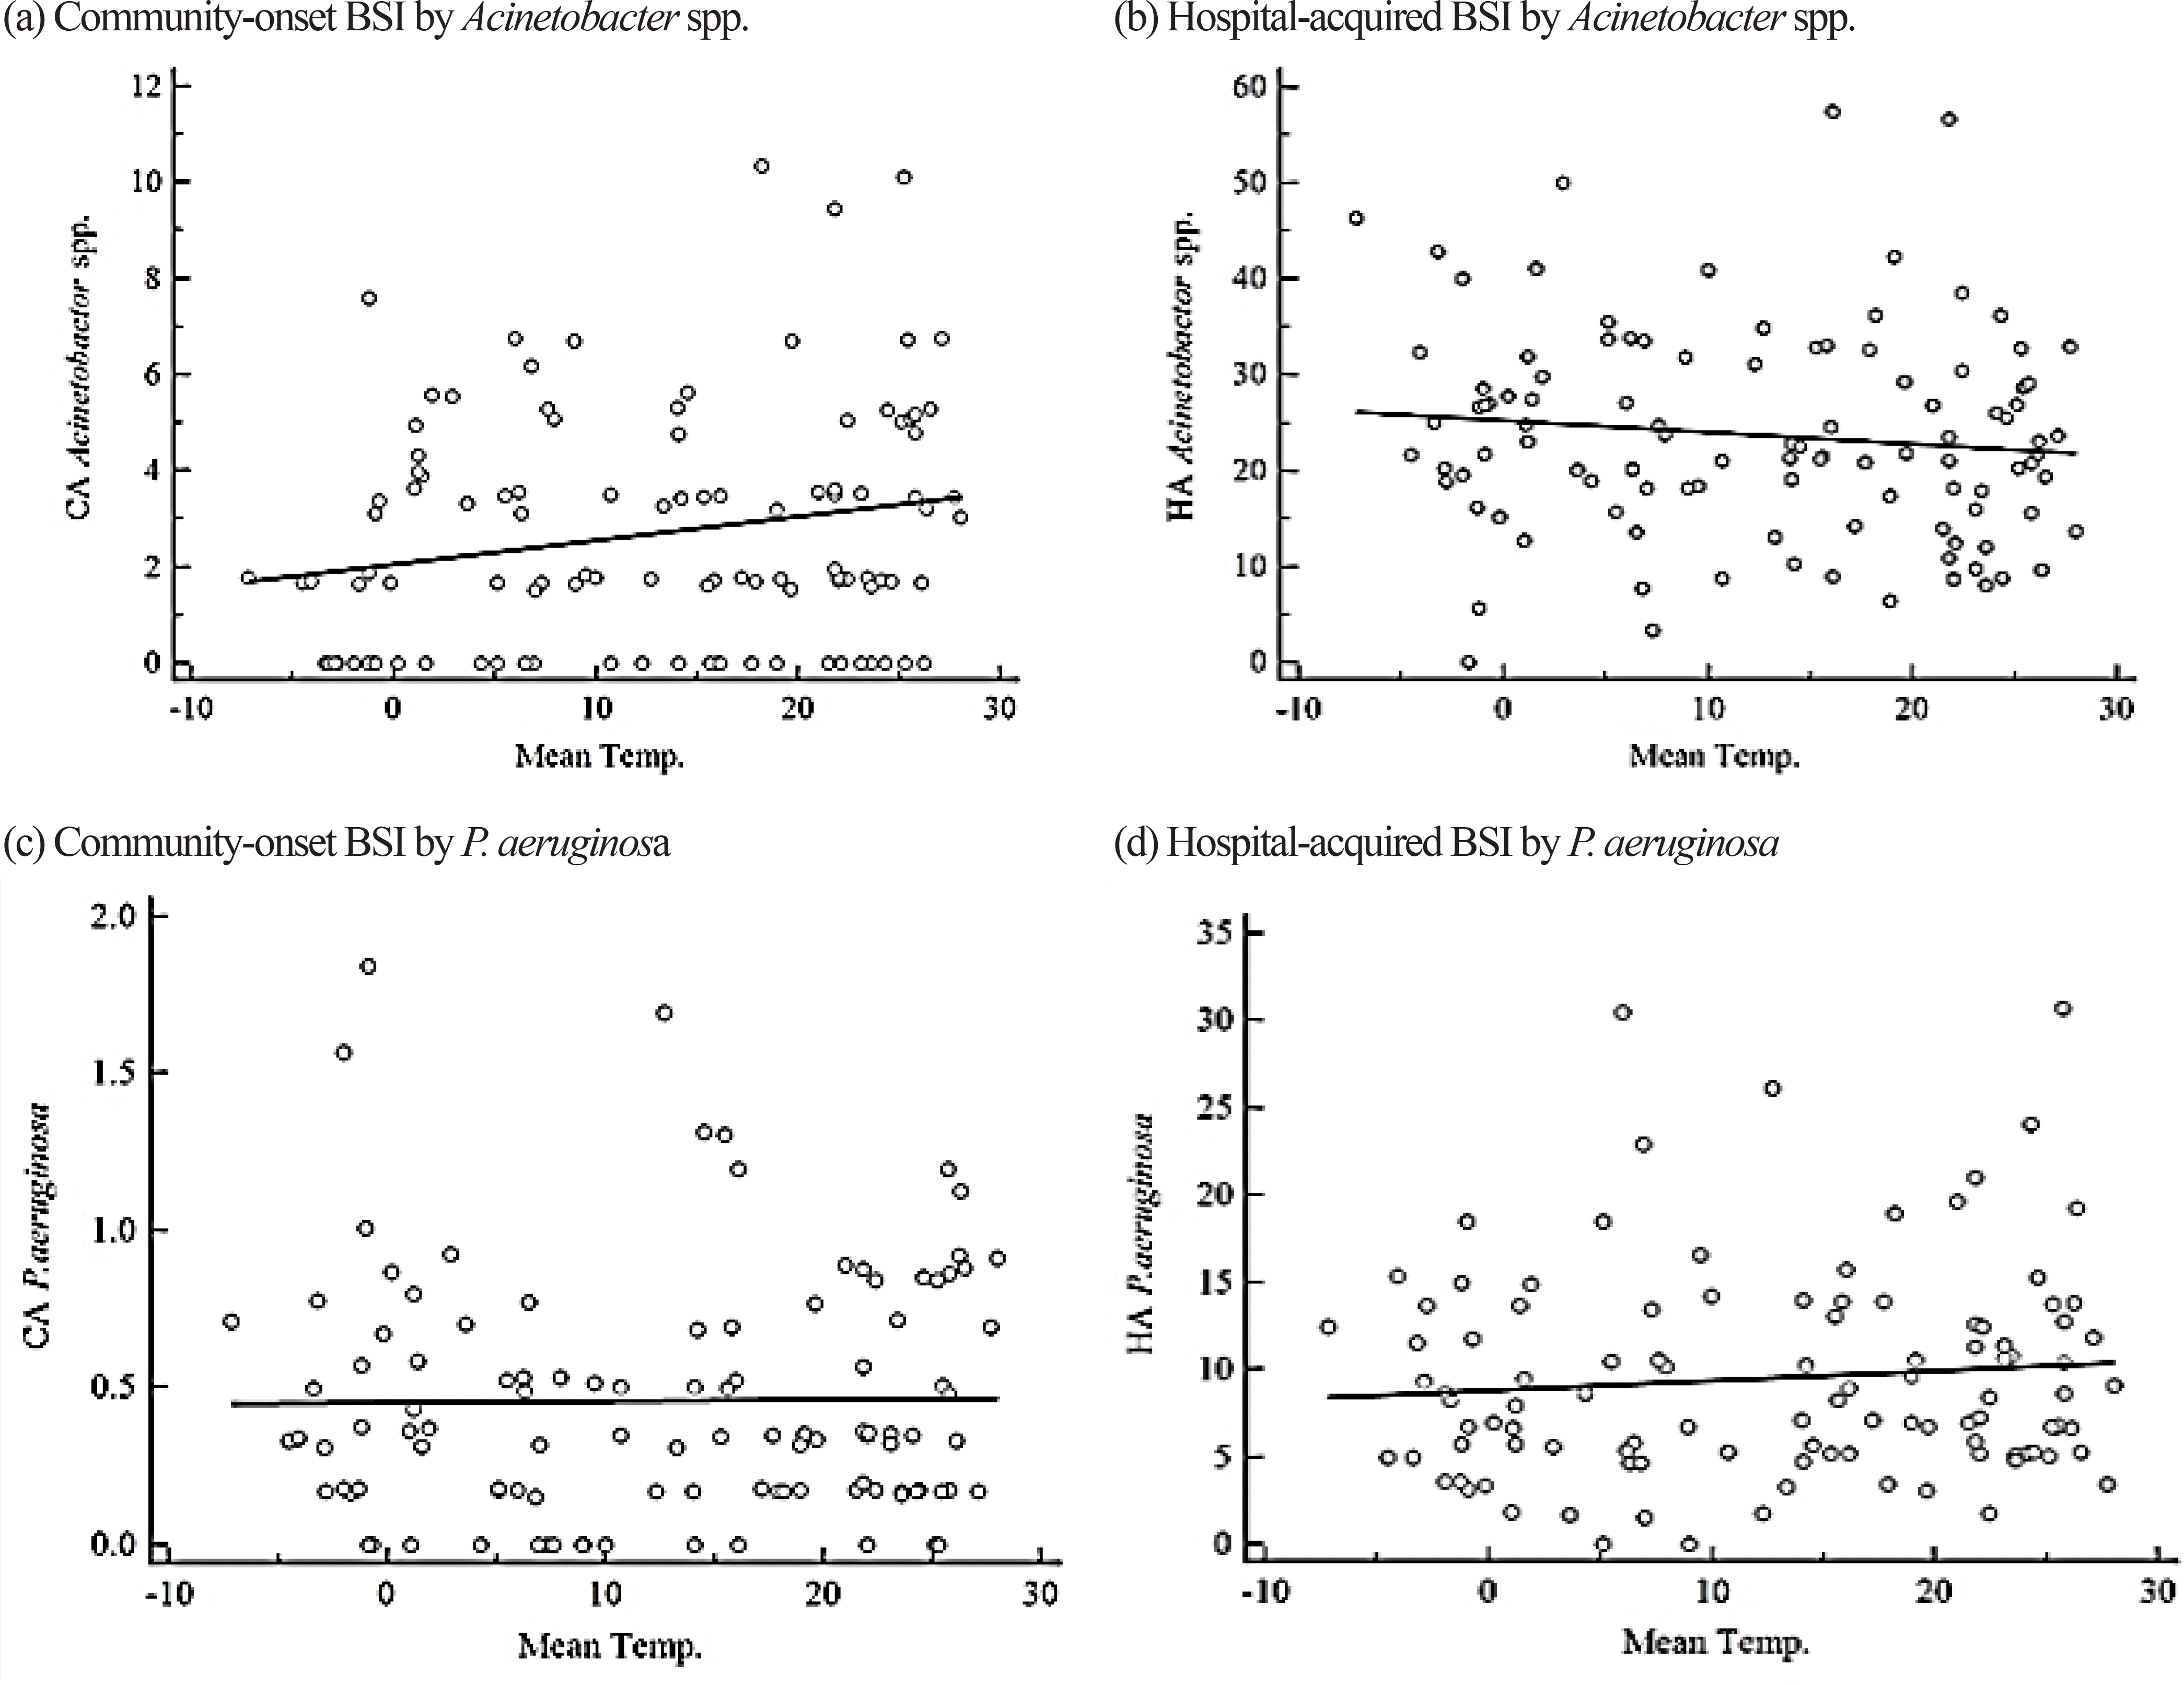
 | Fig. 3.Correlation between bloodstream infection (BSI) by glucose non-fermenters and average monthly temperature from 2008–2016. (a) Temperature (°C) vs. incidence rate of community-onset BSI by Acinetobacter spp. (cases per 105 patient days), y = 0.0500x+2.065, r = 0.2100, P = 0.0292. (b) Temperature (°C) vs. incidence rate of hospital-acquired BSI by Acinetobacter spp. (cases per 106 patient days), y = −0.121x+25.202, r = −0.1148, P = 0.2368. (c) Temperature (°C) vs. incidence rate of community-onset BSI by P. aeruginosa (cases per 105 patient days), y = 0.000520x+0.455, r = 0.0137, P = 0.8879. (d) Temperature (°C) vs. incidence rate of hospital-acquired BSI by P. aeruginosa (cases per 106 patient days), y = 0.0565x+8.814, r = −0.0957, P = 0.3241. CO, community-onset; HA, hospital-acquired; Temp., temperature. |
Table 1.
Etiologic agents of bloodstream infections according to acquisition site (2008–2016)
Table 2.
Incidence of community-onset bloodstream infections according to acquisition site and seasonal changes
Table 3.
Incidence of hospital-acquired bloodstream infections according to acquisition site and seasonal changes


 PDF
PDF ePub
ePub Citation
 Print
Print


 XML Download