

 PDF
PDF ePub
ePub Citation
 Print
Print


INTRODUCTION
Anchorage loss during orthodontic tooth movement (OTM) is one of the greatest concerns for clinicians. Mini-implants represent a substantial recent advancement in orthodontic treatment and are being successfully used to obtain absolute anchorage while treating various malocclusions. The clinical applications of miniimplants are varied, and they have been commonly used in complex multidisciplinary cases warranting OTM/anchorage preservation in all three dimensions.1 Although mini-implants have been used successfully over the past decade, several complications have been reported in the literature, including damage to the adjacent anatomical structures, irritation or inflammation of peri-implant tissues, and subsequent failure.2 A large body of evidence shows a failure rate between 14 to 20% for mini-implants, and their success rate is positively correlated with the anatomy of the insertion site.3 Numerous factors, including the quality and quantity of the bone at recipient sites, contribute to mini-implant failure. Additional evidence is warranted to confirm the influence of bone quality and quantity on mini-implant failure.4
The site of mini-implant placement is highly important for achieving absolute anchorage. Bone stock at the mini-implant placement site is a critical determinant of initial stability and subsequently influences the success rate of mini-implants. Placement sites with greater cortical bone thickness and higher cortical bone density are ideal and have been shown to contribute to the success rates.5 A lack of primary stability can often be attributed to low bone density or low bone stock at the placement site.6
With the modest failure rate and a rising demand for mini-implants in day-to-day clinical orthodontics, a thorough understanding of the associations between mini-implant failure and the associated tissue factors is highly warranted. By determining optimal placement sites and any associated factors, clinicians will be able to design their treatment plans accordingly and utilize these devices with a higher success rate. However, the current orthodontic and dental literature lacks evidence outlining the optimal site for mini-implant placement, necessitating further research.
The principal determinants of the success of mini-implants are the quality and quantity of the available bone at the targeted site. Therefore, it is imperative to study the bone parameters (thickness and density of the bone) at these potential clinical mini-implant placement locations. The primary objective of this study was to quantitatively analyze the cortical bone thickness at four different interdental areas from the distal region of the canine to the mesial region of the second molar in the maxilla and the mandible. Additionally, we quantified the bone density at each site in order to evaluate the bone quality at each location. Our second aim was to compare and contrast the bone parameters (cortical bone thickness and density) of these specific locations in terms of sex (male and female), growth status (growing and non-growing), and facial type (hypodivergent, normodivergent, and hyperdivergent). Our null hypothesis is that the bone parameters (bone thickness and density) at these interdental sites are not different between male and female patients, growing and non-growing patients, or among the three facial types.
MATERIALS AND METHODS
An Institutional Review Board exemption was obtained for evaluating cone-beam computed tomography (CBCT) volumes acquired from private practice in Miami, Florida. This retrospective study reviewed 290 CBCT images of patients seeking orthodontic treatment. All CBCT scanned images were de-identified for Protected Health Information by authorized personnel from the Department of Oral and Maxillofacial Radiology prior to using them as a part of the study population. CBCT scans were acquired using the i-CAT Next Generation (Imaging Sciences International, Hatfield, PA, USA) CBCT unit. A standardized protocol for the i-CAT for the extended (17 × 23-cm) field of view with a 0.3-mm slice thickness and a 26.9 seconds acquisition time was used.
All CBCT scans were saved in Digital Imaging and Communications in Medicine (DICOM)-3 format. CBCT-generated lateral cephalograms were imported and traced in Dolphin™ (Patterson Dental, Chatsworth, CA, USA) to categorize each patient under one of following vertical facial types (Figure 1): hyperdivergent (mean age: 21.9 ± 10.3 years), hypodivergent (mean age: 22.5 ± 9.4 years), and normodivergent (mean age: 21.7 ± 9.6 years). Angular and linear measurements were taken, and categories were determined using the following cephalometric measurement parameters: (1) facial height index - the ratio of the posterior facial height to the anterior facial height using the measurements of the sella (S) to gonion (Go) divided by the distance of the nasion (N) to menton (Me); (2) mandibular plane angle - the angle between the anterior cranial base (S to N) and the mandibular plane (formed by Me to Go); and (3) the Frankfort mandibular plane angle (FMA) - the angle between the Frankfort horizontal (porion to orbitale) and the mandibular plane (Me to Go).789 For the facial height index, ratios of < 61%, 61% to 69%, and > 69% indicated increased, normal, and decreased facial heights, respectively. For the mandibular plane angle, angles of < 21°, 21 to 29°, and > 29° indicated decreased, normal, and increased facial heights, respectively. For FMA, angles of < 27°, 27 to 37°, and > 37° indicated decreased, normal, and increased facial heights, respectively. If at least two of the three measurements were not in agreement for the categorization of a decreased, normal, or increased facial height, then those scans were excluded from the study.
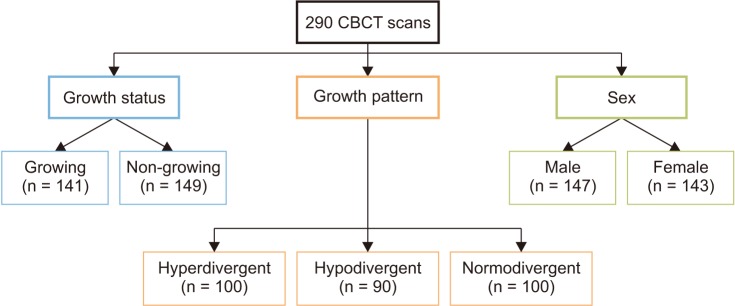
In addition to the facial type, the scans were also divided on the basis of sex and age into four additional groups: Group 1: growing subjects (mean age: 14.7 ± 1.6 years); Group 2: non-growing subjects (mean age: 29.0 ± 9.1 years); Group 3: male subjects (mean age: 21.3 ± 8.7 years); and Group 4: female subjects (mean age: 22.7 ± 10.7 years) (Figure 1). The exclusion criteria were as follows: (1) congenitally missing teeth, (2) CBCT scans showing supernumerary teeth, enlarged/cystic follicle, or any other pathology, (3) a history of systemic disease affecting the bone, (4) extraction of teeth for orthodontic purposes, and (5) a history of periodontal disease, orthognathic surgery, or genetic syndromes.
The images were randomly assigned numbers, and a board-certified oral and maxillofacial radiologist (A.T.) and a board-certified orthodontist (S.Y.), who were experienced in evaluating volumes and manipulating contrast and histograms of CBCT scans, blindly evaluated the scans using a third-party CBCT reconstruction software InVivo-5 (Anatomage, San Jose, CA, USA). The images were reviewed on a split-screen dual display monitor (HP Compaq LA2205wg; HP Inc., Houston, TX, USA) under standardized conditions of ambient light and sound. The investigator had the full capability to evaluate the volumes in all three orthogonal planes and manipulate contrast and histogram.
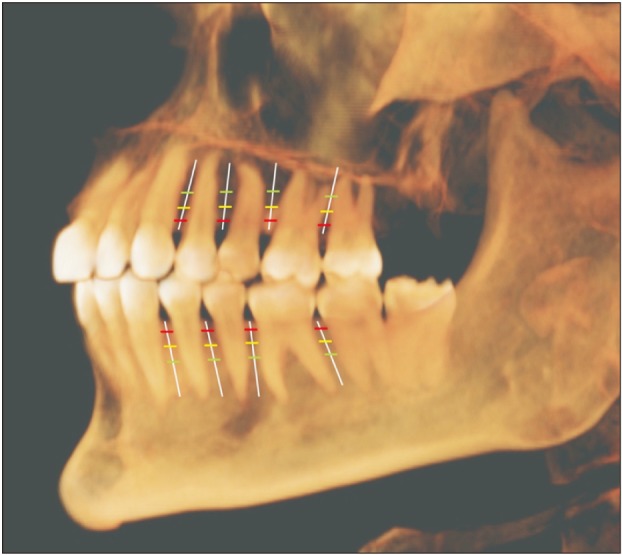
Once the scans were imported to the reconstruction program, they were aligned parallel to the Frankfort horizontal plane. The examiners initially reviewed 20 scans and were calibrated in terms of inter-examiner reliability. For each CBCT scan, a reconstructed panoramic view was used to make four coronal sections in the maxilla and the mandible at the following locations: (1) between the canine and first premolar, (2) between the first and second premolars, (3) between the second premolar and first molar, and (4) between the first and second molars (Figure 2). At each cross-section in the maxilla and mandible, the buccal bone thickness and density were measured at a distance of 2 mm, 6 mm, and 10 mm from the alveolar crest (Figure 2). The buccal bone thickness was measured using the ruler tool by drawing a line from the inner border to the outer border of the cortical plate. The density was measured using the pixel intensity value equivalent to the Hounsfield unit scale in the software program. To test the intra-examiner reliability, the same person measured bone parameters on 20 randomly selected scans four weeks later.
Statistical analysis
Simple descriptive statistics were used to summarize the data. Mean, standard deviation, and standard error of mean were computed for bone thickness and density (between the canine and first premolar, between the first and second premolars, between the second premolar and first molar, and between the first and second molars) at three different interdental locations: 2 mm, 6 mm, and 10 mm from the alveolar crest in the maxilla and the mandible for (A) growing and non-growing patients; (B) male and female patients; and (C) hyperdivergent, hypodivergent, and normodivergent patients. For all the outcomes, inter-examiner reliability was computed by Cronbach's alpha values (intra-class correlation coefficients). Results of one-sample Kolmogorov–Smirnov test showed normality of distribution for bone thickness and bone density at different locations. For assessment of the variability in bone thickness and bone density at different interdental sites in the maxilla and the mandible, in terms of the growth status (growing and non-growing) and sex (male and female), independent sample t-tests were performed. For the variability in the bone thickness and bone density at different interdental locations in the maxilla and the mandible, in terms of the facial pattern (hyperdivergent, hypodivergent, and normodivergent), analysis of variance and Tukey's multiple comparisons were performed. Multivariate regression analyses were used to investigate the factors associated with variability in bone thickness and density. All statistical tests were two-sided, and to minimize the probability of type I errors, a p-value of < 0.001 was deemed to be statistically significant. Cohen's kappa was 0.91 for intra-examiner reliability. Statistical analyses were computed using GraphPad Prism 8.1.1 software (GraphPad Software Inc., San Diego, CA, USA).
RESULTS
Buccal cortical bone thickness
Sex
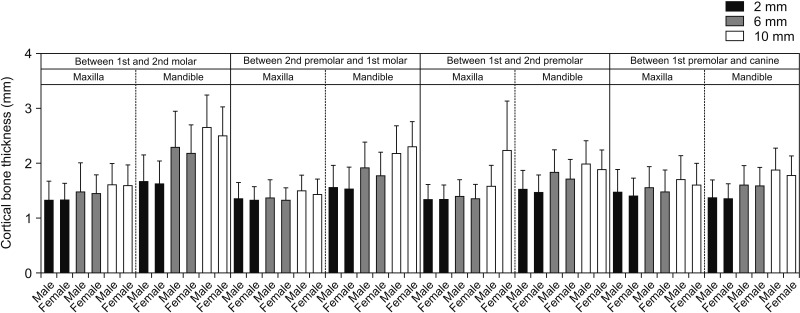
The sex comparison showed no significant difference (p > 0.001) in the cortical bone thickness between male and female subjects (Figures 3 and 4, Supplementary Table 1).
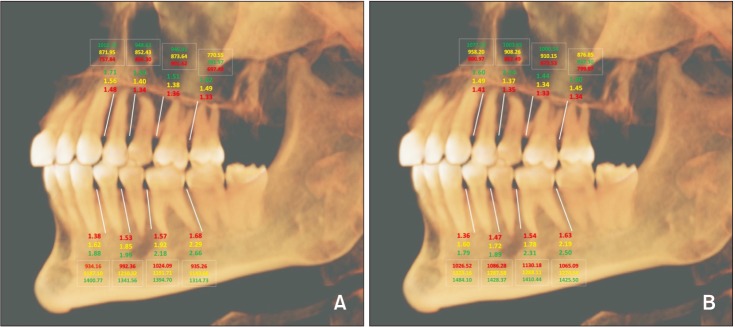
Figure 3
Mean thickness (mm) and density (Hounsfield unit, in boxes) of buccal cortical bone in male (A) and female (B) subjects for interdental locations 2 mm, 6 mm, and 10 mm from the crestal bone. For the maxilla - bottom to top and for the mandible - top to bottom. Red color represents the lowest value for a particular location, while yellow and green colors represent the intermediate and highest values, respectively.
![]()
Facial divergence
In the maxilla, the hyperdivergent and normodivergent subjects showed significant differences between the second premolar and first molar at 10 mm from the alveolar crest (p < 0.001) (Figures 5 and 6). In the mandible, significant differences (p < 0.001) were found at the following sites: (1) between the first and second molars at 6 mm and 10 mm from the alveolar crest in hyperdivergent vs. normodivergent and hyperdivergent vs. hypodivergent subjects; (2) between the second premolar and first molar at 6 mm from the alveolar crest between hyperdivergent vs. hypodivergent and hypodivergent vs. normodivergent subjects; and (3) between the first and second premolars at 10 mm from the alveolar crest between hyperdivergent vs. hypodivergent subjects (Figures 5 and 6, Supplementary Tables 2 and 3).
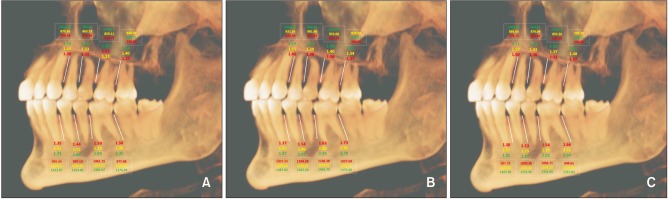
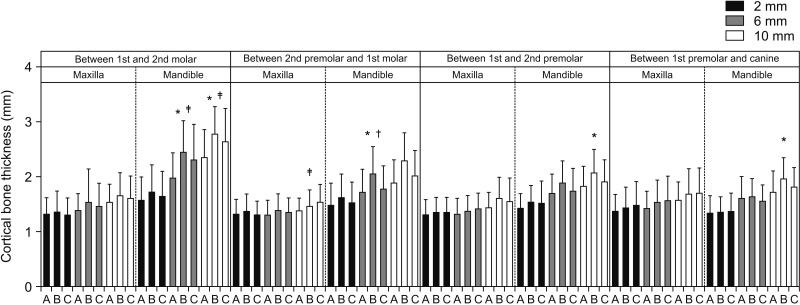
Figure 5
Mean thickness (mm) and density (Hounsfield unit, in boxes) of buccal cortical bone in hyperdivergent (A), hypodivergent (B), and normodivergent (C) subjects at interdental locations 2 mm, 6 mm, and 10 mm from the crestal bone. For the maxilla - bottom to top and for the mandible - top to bottom. Red color represents the lowest value for a particular location, while yellow and green represent the intermediate and highest values, respectively.
![]()
Figure 6
Intergroup comparisons of hyperdivergent, hypodivergent, and normodivergent subjects for cortical bone thickness at the respective interdental locations.
A, Hyperdivergent; B, hypodivergent; C, normodivergent.
Analysis of variance and Tukey's multiple comparisons; Signs for statistically significant difference (p < 0.001): *A vs. B, †B vs. C, ‡C vs. A.
![]()
Growth
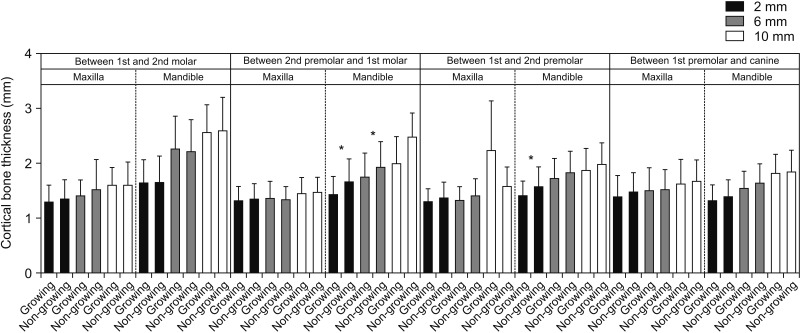
In the maxilla, there were no significant differences in bone thickness between growing and non-growing individuals. In the mandible, significant differences were observed (1) between the second premolar and first molar at 2 mm and 6 mm from the alveolar crest; and (2) between the first and second premolars at 2 mm from the alveolar crest (Figures 7 and 8, Supplementary Table 4).
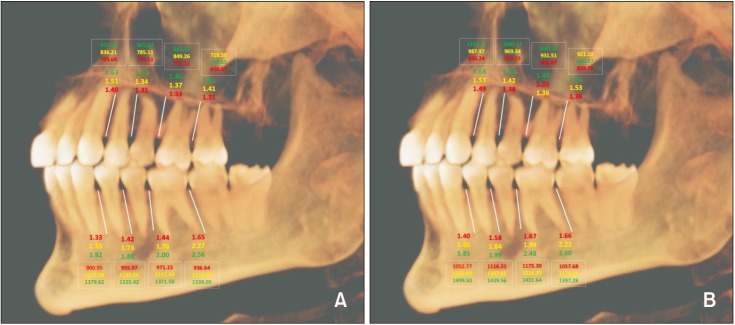
Figure 7
Mean thickness (mm) and density (Hounsfield unit, in boxes) of buccal cortical bone in growing (A) and non-growing (B) subjects for the interdental locations 2 mm, 6 mm, and 10 mm from the crestal bone: For the maxilla - bottom to top, and for the mandible - top to bottom. Red color represents the lowest value for a particular location, while yellow and green represent the intermediate and highest values, respectively.
![]()
Buccal cortical bone density
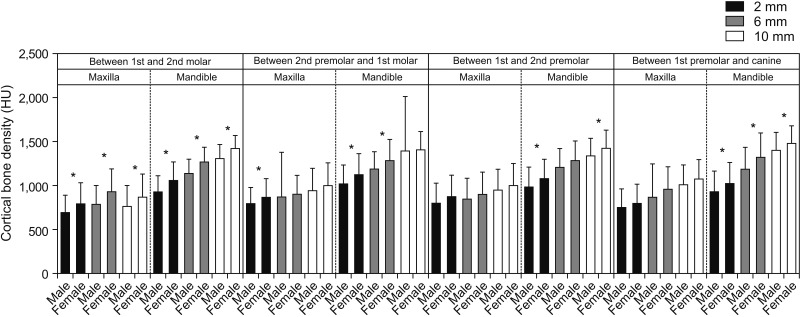
Sex
In our study subjects, we observed lower bone density in male subjects than that in females at all 24 locations. However, a significant difference (p < 0.001) between male and female subjects in the maxilla was found only between the first and second molars. In the mandible, significant differences (p < 0.001) between male and female subjects were observed (1) between the first and second molars at all three locations (2 mm, 6 mm, and 10 mm from the alveolar crest); (2) between the second premolar and first molar at 2 mm and 6 mm from the alveolar crest; (3) between the first and second premolars at 2 mm and 10 mm from the alveolar crest; and (4) between the canine and first premolar at all three locations (Figures 3 and 9, Supplementary Table 5).
Facial divergence
There was no significant difference (p > 0.001) in bone density with relation to the facial pattern in the maxilla and mandible, except in the mandible between the second premolar and first molar at 6 mm from the alveolar crest between normodivergent vs. hyperdivergent subjects (Figures 5 and 10, Supplementary Tables 6 and 7).
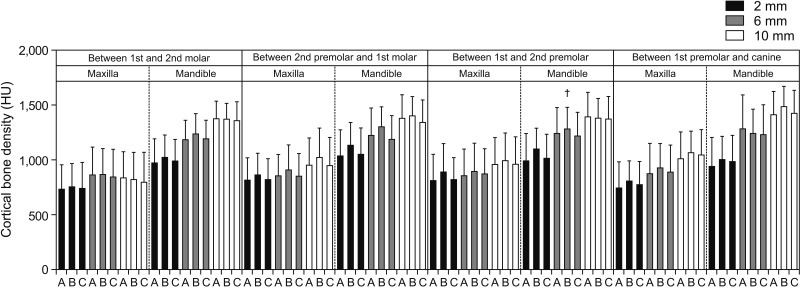
Figure 10
Intergroup comparisons of hyperdivergent, hypodivergent, and normodivergent subjects for cortical bone density at the respective interdental locations.
HU, Hounsfield unit; A, hyperdivergent; B, hypodivergent; C, normodivergent.
Analysis of variance and Tukey's multiple comparisons; Signs for statistically significant difference (p < 0.001): *A vs. B, †B vs. C, ‡C vs. A.
![]()
Growth
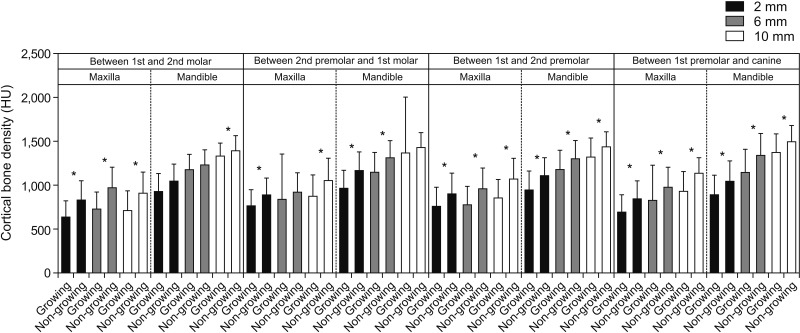
The bone density for a majority of the locations was found to be significantly (p < 0.001) lower in growing subjects than the corresponding values in non-growing subjects. However, in the maxilla, there was no significant difference (p > 0.001) between the second premolar and first molar at 6 mm from the alveolar crest. In the mandible, there was no significant difference (p > 0.001) between the first and second molars at 6 mm from the alveolar crest and between the second premolar and first molar at 10 mm from the alveolar crest (Figures 7 and 11, Supplementary Table 8).
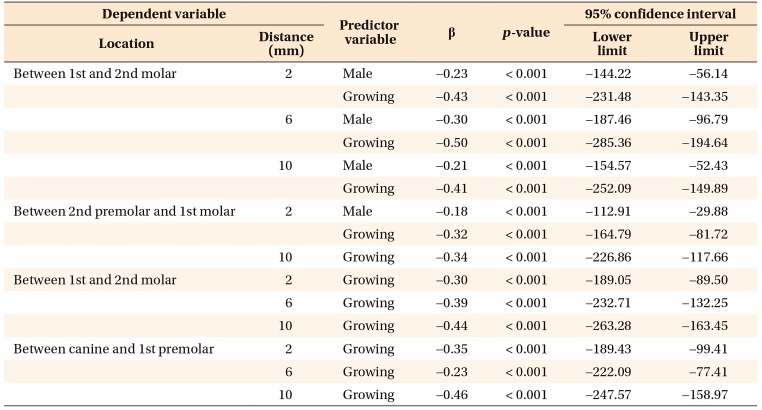
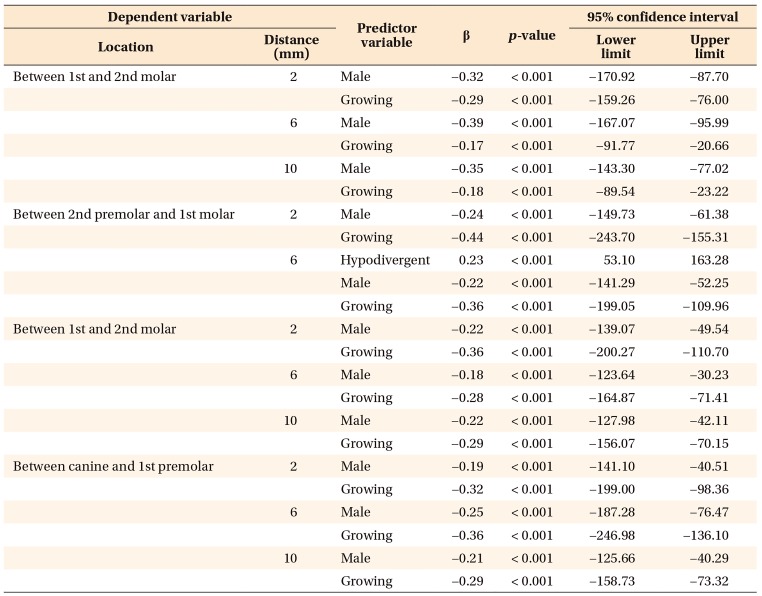
The multivariate regression model analyses are presented in Tables 1, 2, 3. Growth status and growth patterns (hyperdivergent and hypodivergent) were identified as predictors influencing the variability of bone thickness (Table 1). However, only sex (male) and growth status served as predictors influencing the variability of bone density in the study subjects (Tables 2 and 3).
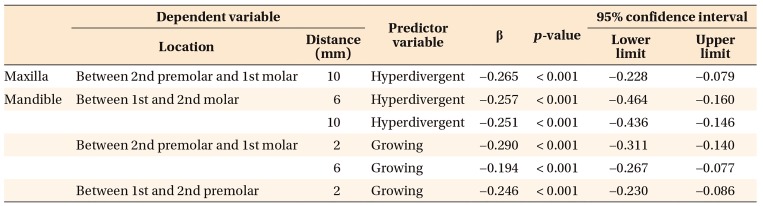
Table 1
Linear regression model for buccal cortical bone thickness at four maxillary and mandibular interdental locations at 2 mm, 6 mm, and 10 mm from the alveolar crest
![]()
Supplementary data is available at https://doi.org/10.4041/kjod.2020.50.2.108.
DISCUSSION
The principal determinants for mini-implant stability are mechanical retention, mini-implant design, quality and quantity of bone, and placement technique.10 The firmness of cortical bone is one of the primary factors controlling the stability of mini-implants.11 Several researchers have attempted to study cortical bone thickness to predict the stability of mini-implants. Baumgaertel and Hans12 reported a distinctive pattern of variability in the interdental cortical bone thickness. Marquezan et al.13 conducted a meta-analysis and showed a positive association between mini-implant stability and cortical bone thickness. Furthermore, Motoyoshi et al.14 found a linear relationship between the success rate and cortical bone thickness, and stated that mini-implants placed in an area with cortical bone thickness ≥ 1 mm have higher success rates.
Another host defining factor that significantly contributes to the stability of mini-implants is cortical bone density. Numerous studies on mini-implants have pointed out a considerable correlation between cortical bone density and pull-out strength.15 Cha et al.15 through their animal model, concluded that the cortical bone density, screw position, and type have a compound influence on the primary stability of a miniscrew. Furthermore, Iijima et al.16 published an in vitro study in which cortical bone thickness, density, and hardness were identified as factors influencing the failure force. In their independent in vitro study, Holm et al.17 pointed out that an increase in cortical bone density causes a significant rise in mini-implant insertion torque, leading to enhanced primary stability. Considering these facts, we designed this study to evaluate the host factors (cortical bone thickness and density) in a large sample size and to draw a schematic outline showing the anatomical sites with the most predictable primary stability of mini-implants.
In this study, multivariate regression analysis was used to predict the association between sex and cortical bone thickness, and we found no significant difference in the cortical bone thickness between male and female subjects (Figures 3 and 4). Our findings are in accordance with the results published by Farnsworth et al.,18 showing no sex-related differences in bone thickness. This observation is further supported by Chun and Lim19 and Ono et al.,20 who also reported no significant correlation between cortical bone thickness and sex. However, these results contradict those published by Cassetta et al.,21 showing significantly thicker cortical bone in male than in female subjects. A possible explanation for this contradiction could be the variability in subject populations and the level of significance (p < 0.05 in their study as compared to p < 0.001 in our study).
We found a significant difference in bone density between male and female subjects for most interdental locations in the mandible and a few interdental locations in the maxilla. One of the interesting observations in our study was that females had a higher bone density at all interdental locations (Figures 3 and 9). This is further supported by the findings of the study published by Fadhil and Al-khatib,22 who also reported higher bone density in female subjects. However, our findings contradict those published by Cassetta et al.,21 who reported significantly higher bone density in males. Similarly, Hiasa et al.23 showed that males had a higher bone density. Our results were different probably because of differences in study methodologies and the mean ages of the groups studied.
We also tried to elucidate the relationship between growth status and bone thickness and density. We observed no significant difference in bone thickness between growing and non-growing subjects for the majority of interdental locations (Figures 7 and 8). Our results are further supported by the findings reported by Sathapana et al.,24 who concluded that age had relatively little actual influence on alveolar cortical bone thickness. Similarly, a study published by Ono et al.20 also reports no significant difference in bone thickness between two age groups. However, this contradicts the findings published by Cassetta et al.,21 which showed significantly higher cortical bone thickness in adults as compared to adolescents. The reasons for the disagreement could be the comparatively smaller sample size as well as the level of significance (p < 0.05) in the previous study, which could have resulted in a higher probability of type I errors. However, when the comparison was made in terms of growth status and bone density, non-growing subjects showed higher bone density than growing subjects, and the difference was significant for most of the interdental locations (Figures 7 and 11). Cassetta et al.21 reported a similar pattern for cortical bone density when the comparison was made between adult and adolescent subjects. This is relatively unexplored territory, and no other studies documented in the literature have assessed bone density in relation to growth status to allow comparisons with our observations.
Finally, we also aimed to determine correlations between facial pattern and bone thickness and bone density. For the majority of sites, we found no significant difference in bone thickness and density among subjects with three different facial patterns (Figures 5, 6, and 10). Our findings are similar to those published by Sadek et al.,25 who showed a significant difference in bone thickness for only hyperdivergent and hypodivergent subjects at 7 mm from the crestal bone in mandibular interdental sites (p < 0.001). Horner et al.26 published contradictory results showing a significant difference in maxillary bone thickness in the posterior region between hyperdivergent and hypodivergent facial groups. This was further supported by Ozdemir et al.,27 who concluded that high-angle patients have significantly lower values for buccal bone thickness than low-angle patients. They also reported significantly less dense bone in the hyperdivergent facial group than that in the hypodivergent facial group. The primary reason for this contradiction can be variations in the number of subjects and the age group as well as the measurement sites.
In the multivariate models, only hyperdivergent facial pattern and growing status significantly contributed to regressions in bone thickness in mandibular interdental locations, as shown in Table 1. This suggests that a hyperdivergent facial pattern and growing status account for reductions in bone thickness in the mandible for specified locations. Furthermore, for the region between the first and second molars on the maxilla and all interdental locations on mandible, only male and growing subjects showed significant regression for bone density. However, for the rest of the locations in the maxilla, only growing subjects showed regression in bone density. In other words, male sex and growing status were the only predictors responsible for a significant decrease in bone density for maxillary and mandibular interdental locations (Tables 2 and 3).
Because no scientific research is perfect, this study has its own limitations. First, selection of participants with a specific racial allocation would have yielded more precise scientific data on the variations in the distribution of the buccal bone thickness and density in different geographic areas. Second, assessments based on skeletal age instead of chronological age would have provided more specific growth status for further evaluation; however, since scientific literature lacks strong evidence with such a large sample size for bone mapping in terms of density and thickness, this article will be a very important reference for prospective researchers to expand their understanding and for orthodontic clinicians to obtain a predictable success rate with mini-implants in their practice. Growth status, facial divergence and sex plays a big role in predicting the success of mini-implants.
CONCLUSION
1. The cortical bone thickness increases in the direction from the crestal bone towards the basal bone. There was no significant difference between male and female subjects in cortical bone thickness. Additionally, there was no difference in the maxillary and mandibular cortical bone thickness for growing and non-growing patients at almost all of the locations studied.
2. Female subjects tend to have a higher density of buccal cortical bone as compared to male. Additionally, non-growing individuals have a higher cortical bone density as compared to the younger population.
3. Bone parameters (thickness and density) are similar for subjects with hyperdivergent, hypodivergent, and normodivergent facial patterns.
 XML Download